Your browser does not fully support modern features. Please upgrade for a smoother experience.
Submitted Successfully!
 +1 credit
Thank you for your contribution! You can also upload a video entry or images related to this topic.
For video creation, please contact our Academic Video Service.
| Version | Summary | Created by | Modification | Content Size | Created at | Operation |
|---|---|---|---|---|---|---|
| 1 | Cassandra Walker | -- | 5061 | 2023-04-27 01:08:11 | | | |
| 2 | Rita Xu | Meta information modification | 5061 | 2023-04-27 03:47:30 | | |
Video Upload Options
We provide professional Academic Video Service to translate complex research into visually appealing presentations. Would you like to try it?
Cite
If you have any further questions, please contact Encyclopedia Editorial Office.
Walker, C.K.; Assadzadeh, S.; Wallace, A.J.; Delahunty, A.J.; Clancy, A.B.; Mcdonald, L.S.; Fitzgerald, G.J.; Nuttall, J.G.; Panozzo, J.F. Grain Quality On-Farm. Encyclopedia. Available online: https://encyclopedia.pub/entry/43545 (accessed on 21 July 2026).
Walker CK, Assadzadeh S, Wallace AJ, Delahunty AJ, Clancy AB, Mcdonald LS, et al. Grain Quality On-Farm. Encyclopedia. Available at: https://encyclopedia.pub/entry/43545. Accessed July 21, 2026.
Walker, Cassandra K., Sahand Assadzadeh, Ashley J. Wallace, Audrey J. Delahunty, Alexander B. Clancy, Linda S. Mcdonald, Glenn J. Fitzgerald, James G. Nuttall, Joe F. Panozzo. "Grain Quality On-Farm" Encyclopedia, https://encyclopedia.pub/entry/43545 (accessed July 21, 2026).
Walker, C.K., Assadzadeh, S., Wallace, A.J., Delahunty, A.J., Clancy, A.B., Mcdonald, L.S., Fitzgerald, G.J., Nuttall, J.G., & Panozzo, J.F. (2023, April 27). Grain Quality On-Farm. In Encyclopedia. https://encyclopedia.pub/entry/43545
Walker, Cassandra K., et al. "Grain Quality On-Farm." Encyclopedia. Web. 27 April, 2023.
Copy Citation
Grains intended for human consumption or feedstock are typically high-value commodities that are marketed based on either their visual characteristics or compositional properties. The combination of visual traits, chemical composition and contaminants is generally referred to as grain quality.
in-field
spectroscopy
grain size
grain color
quality
image analysis
machine learning
1. Introduction
The application of sensor technologies in agriculture is having an increasing role in measuring grain yield potential and grain quality throughout the cropping season. Important global arable crops include wheat, maize, canola, rice, soybean and barley due to their nutritional importance, functional properties, and commodity value. The grain quality of commercially grown crops is influenced by a range of factors, including cultivation practices, environment, harvest timing, grain handling, storage management and transportation [1][2][3][4][5][6][7]. The spatial variation observed in grain yields can be due to soil type, topography and interactions with the environment (e.g., frost and water availability) within and across fields and farms and is well recognized as a driver of variation in grain quality. In addition, with the increasing likelihood of extreme events and biotic pressures associated with climate change, it will be more challenging to maintain grain quality in future environments. Although growers currently manage these variations through better-adaptive cultivars, management practices and in-field sensors could provide improvements in managing grain quality and, ultimately, profits by providing information that would allow identification and segregation of grain quality by quantifying variation in quality obtained from the field. This would benefit end-users and add value to the farming enterprise.
Grain quality is defined by a range of physical and compositional properties, where the end-use dictates the grain and compositional traits and market potential [8][9][10]. Grain quality has traditionally been measured post-farmgate when growers deliver to grain receival agents, and the load is subsampled and tested within a clean testing environment such as a testing station or laboratory using benchtop instrumentation and human visual inspection. Grain quality when received by grain receival agents is graded using two approaches: firstly, subjective procedures undertaken by trained operators (grain inspectors) assessing visual traits, including stained, cracked, defective grain and contaminants, and secondly, objectively using standardized instrumentation, such as sieves to determine grain size and near infrared spectroscopy (NIR) to determine the composition, such as protein and moisture concentration [10][11]. Key traits used in valuing and trading grain include the percentage of small grain (screenings), foreign material (unable to be processed, milled or malted), contaminates, sprouted, stained or discolored grain, broken, damaged or distorted grain, presence of insects or mold, test weight, or composition including moisture concentration, protein concentration, low levels of aflatoxins and a high Hagberg falling number test [9][12][13][14]. Many of these traits are measured as % per weight of samples subsampled from the grain load. Manufacturers of end-product determine the specifications or limits associated with these quality traits, as grain outside the set specifications impacts the end-product quality. For example, small, shriveled grain that may be high in protein concentration would be undesirable when processing food products from wheat as these impact flour yields, baking loaf volume and dough rheology characteristics as reviewed by [15].
The application of sensor technologies pre-harvest is increasingly being incorporated into farming enterprises to determine the impact of environmental factors on grain production and yield. For example, field sensors are used to discern spatial and temporal information throughout the production system, including soil type variation and nitrogen inputs (e.g., electromagnetic conductivity [EM38]), growth habit (Normalized Difference Vegetative Index [NDVI] and relative greenness [SPAD]) [16][17], nutritional status (Canopy Chlorophyll Content Index [CCCI]) [18], the impact of abiotic stresses such as frost and heat [4][19], and biotics where RGB (Red, Green, Blue) imaging is used to target spraying weeds [20]. The next transition is to utilize sensors to record reliable, efficient, and relevant data associated with grain quality. Downgrades in grain quality can be caused by heat waves and frost during grain filling, drought, disease and the presence of weeds or other contaminants. Previous studies have shown that stresses such as high temperature, chilling, water stress (associated with soil type), and disease can vary spatially within grower’s fields [21][22][23][24]. Studies linking the spatial distribution of stress events to grain quality have predominantly been related to protein and protein quality in wheat [25][26]. However, limitations remain as to how sensor technologies can be applied to all crop types for a range of grain quality traits.
The monitoring of grain quality, pre- or post-harvest, is currently limited by the costs of the sensors, their availability, and the development of algorithms for measuring key grain quality traits. A deeper understanding of the grower’s perspective, in particular, the key quality traits of relevance to their farm business, is required to guide priorities when developing these applications. Consideration must also be given to a range of practical issues associated with deploying sensors on-farm and managing the logistics of a segregated grain supply chain. Previous studies have highlighted some opportunities to improve grower returns through segregating cereals at harvest [2][27][28][29]; the economics of actively managing grain quality on-farm needs to be quantified at the practical level.
Given the speed of sensor development and miniaturization, sensor technologies are commercially available that produce reliable data in an on-farm environment rather than in a clean laboratory. Moving sensors on-farm and in-field enable growers to strategically manage grain quality before the product is sold (post-farmgate) (Figure 1). The most common commercially available sensor that determines grain composition is the benchtop NIR. Growers subsample harvested grain and use these systems to determine moisture and protein prior to sale or storage.
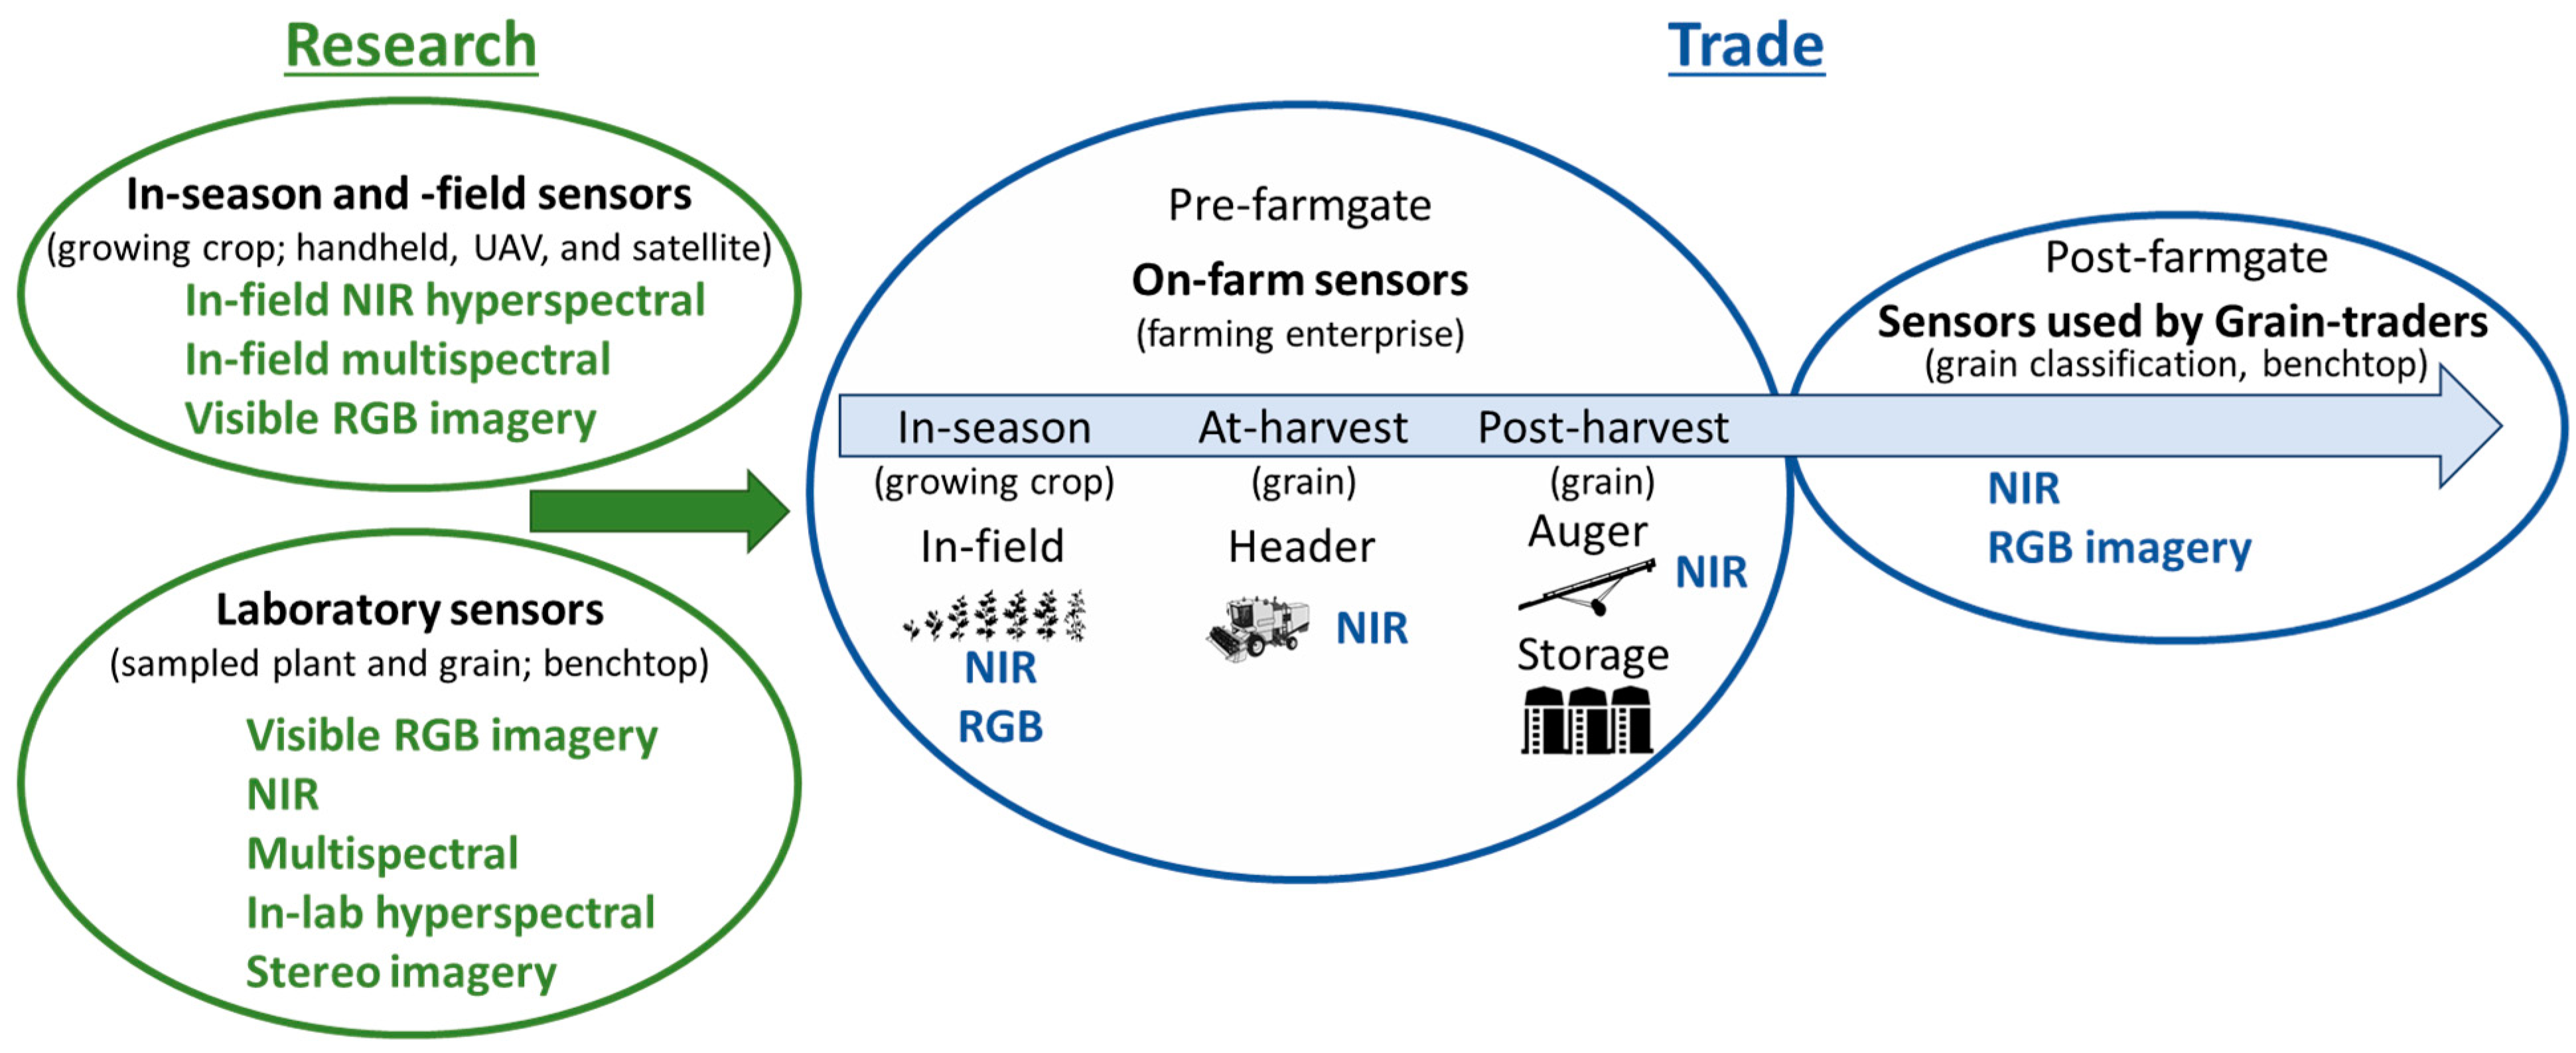
Figure 1. Commercially available practices used to predict grain quality in research and for trade purposes.
Technologies that are commercially available that have the potential to objectively measure grain quality for trade purposes and are likely to be adopted within the next 5 to 10 years include NIR, digital RGB imaging, multi- and hyper-spectral RGB and NIR sensors (Figure 1). These sensors enable rapid and non-destructive approaches to determine grain quality and are used to analyze plant and grain material for research purposes in-season, at-harvest, and post-harvest [19][22][30][31][32]. The focus is on digital imaging and NIR spectral technologies, as these are currently used in research in-lab and, as described, are moving from the lab to the farm, but there are several considerations needed to make this possible. The focus is the commercial and research landscape of current and emerging visible and NIR sensor systems, with consideration of the practicality of applying these technologies on-farm to assess quality traits used to determine market value. Low-cost portable sensors are moving from research, benchtop and laboratory applications to on-farm practical applications where grain quality can be measured objectively in real-time and inform grain management decisions prior to sale post-farm gate.
A critical step in applying sensor technology for determining grain quality is the analysis of the data collected. The application of different analytical techniques is dependent on the types of data generated by different types of sensors. Color space analysis [33], for example, is appropriate to use with digital imagery (RGB), while machine learning methods generally require very large data sets and are adept at finding patterns within high-dimensional data sets. As processing speeds increase and computational costs decrease, even more data-intense analytical techniques can be used to help interpret data in near real-time. To make the best use of sensors and the increasingly large amounts of data produced, it in critical to select appropriate software analytical techniques to work hand in hand with the sensor hardware.
1.1. Options for On-Farm Sensing Grain Quality
Within dryland cropping systems, proximal and remote sensing technologies are being used to capture and manage temporal and spatial variability that cause variation in crop growth, yield and quality across the landscape [34][35]. Remote sensing can operate at multiple scales to assess crop growth and stress, including using hand-held instruments at the field scale, airborne platforms at the field and farm scales and satellites at scales from field to regional levels (Figure 1). For example, a crop reflectance index, referred to as the Normalized Difference Vegetation Index (NDVI), measures the difference between near infrared (vegetation strongly reflects) and red light (vegetation absorbs). This index measures crop canopy cover and can correlate with plant biomass enabling the monitoring of vegetation systems [36]. In one long-term study which assessed the response of winter wheat to heat stress on the North China Plain, canopy reflectance measured from satellite platforms [37] was used to assess crop phenology and senescence rate (spatially and temporally), providing insight into climate change impacts on broadscale production potential. Canopy reflectance information using targeted spectral indices from the visible and near infrared spectral regions has also been correlated with plant nitrogen status in wheat [38], leading to the development of indices including the Canopy Content Chlorophyll Index (CCCI) and the Canopy Nitrogen Index (CNI) at the experimental plot scale. Further testing of these indices across different dryland growing environments in Australia and Italy confirmed their utility, with good agreement between these indices and canopy nitrogen concentration (r2 = 0.97) early in the growing season [18]. In this example, such canopy-based remotely sensed indices provide growers with a decision support tool to guide in-season nitrogen fertilizer application, enabling spatial management of fertilizer rate across the paddock, thus optimizing the match between plant nitrogen demand and application.
More recently, crop canopy reflectance characteristics have also been used to monitor frost damage in wheat grown in southern Australia [19][22], where rapid estimation of frost damage to crops on a spatial basis supports the timely management decisions by growers to reduce the economic impact of frost. In these studies, where hyperspectral reflectance and active light fluorescence were assessed, the reflectance indices Photochemical Response Index (PRI), Normalized Difference Red-Edge Index (NDRE), NDVI and the fluorescence-based index FLAV (Near Infrared Fluorescence excited with Red/Infrared Fluorescence excited with UV (375 nm) correlated well with frost damage experimentally imposed to field grown wheat at flowering. These principles are now evolving to a more widespread application within the grains industry, with service providers now offering seasonal satellite imagery and interpretation in the context of crop performance, spatial variation (topography) and soil characteristics. These data can be useful to inform the management of distinct parts of a paddock or farm (as management zones) for nutritional, abiotic, and biotic disorders to maximize yields and ensure high grain quality.
Research undertaken on-farm relates monitoring of canopy reflectance to crop growth and yield. However, this research highlights the importance and value of predicting the quality of the end-product, i.e., the grain, for growers on-farm. To predict grain-yield, a study that employed hand-held hyperspectral devices assessed variation in frost-affected lentil crops and confirmed that frost damage could be effectively detected in-season using remote sensing and that the stress response corresponds to both yield and quality outcomes [4][39]. Similarly, the use of the active light fluorometer index FLAV in chickpeas and the spectral reflectance-based Anthocyanin Release Index 1 in faba beans have shown utility for the detection of the disease Ascochyta blight at the leaf-level [40]. Given the potential for Ascochyta blight, a fungal disease in pulse grains caused by Ascochyta rabei, to affect grain quality, this offers the opportunity for improved control of diseases through spatial management of foliar fungicides [40], potentially reducing associated quality downgrades and seed carryover. More broadly, if variation in crop canopy reflectance (NIR) based on environmental stresses could be linked to grain quality, this would allow in-season mapping to predict spatial variation in grain quality prior to harvest. With this knowledge, the harvesting program could be tactically designed to harvest zones based on predicted yield and limit economic losses to environmental effects on grain quality within the grains industry.
Monitoring crop canopies using spectral analysis has the potential to provide growers with the tools to better manage grain quality. For this technology to be applied on-farm, further research is required to identify remote sensing measures that correlate with grain quality outcomes for key crop species. The logistics of employing such techniques on-farm must also be considered; the timeliness of collecting and interpreting spatial data to inform harvest zoning and the physical infrastructure and logistics to accommodate the various quality grades are two such examples. Developing prediction models for grain quality based on sensor data will inform harvest zones for quality and maximize financial return.
1.2. Data Acquisition Systems and Sample Handling
In addition to monitoring and managing grain quality prior to harvest, there are opportunities to directly monitor grain quality at various points in the supply chain from harvest through to sale. In this case, sensors could be installed within harvesting or grain handling machinery [26], in grain storage infrastructure [41], or in a ‘benchtop’ or laboratory setting similar to grain receival points [32]. Compared with in-season quality monitoring, assessment of grain quality at harvest or during movement to storage offers the advantage of avoiding the need for mapping and interpreting quality data prior to harvest, saving an additional operation. It may also allow for the identification of quality defects not otherwise evident through spectral analysis of the crop canopy; for example, instances where weeds or other contaminants (e.g., snails) arise closer to crop maturity.
Monitoring of grain quality at- or post-harvest can also be undertaken spatially, enabling proactive management in future seasons. Commercially available grain protein monitors are one such example [26][42], enabling segregation based on grain quality at harvest or during movement into or out of storage while providing information to inform future decisions relating to nitrogen fertilizer. In addition to segregating grain based on quality grade, monitoring quality at- or post-harvest may enable growers to blend grain of various quality levels in specific proportions prior to entering storage [42]. This strategy can be used to ‘lift’ low-quality grain from one grade to the next, helping to achieve the highest aggregate quality and price for grain produced across a farm business.
In addition to monitoring grain quality at-harvest or during movement into storage, directly monitoring grain quality could also be undertaken during storage. Studies such as [43][44] have shown that grain quality can change over time. While optimizing storage conditions through aeration, temperature control and fumigation can all help to maintain grain quality for longer, monitoring of stored grain in situ offers the potential to target marketing decisions based on projected commodity prices and prediction of grain quality over time.
In considering the on-farm application of grain quality monitoring systems, it is important to understand accuracy requirements. The ultimate success of quality monitoring is dependent on its ability to correctly classify a known volume of grain into its respective quality grade to trade. The accuracy required will depend on the crop species and the quality grade being targeted. This is further complicated where the quality of a given grain parcel varies across different target traits, e.g., contamination, color, and size, requiring more comprehensive monitoring systems with multiple algorithms (and perhaps different technologies) to account for the different traits within the grade. Typically, the utility of a monitoring system depends on the accuracy of both the instrument and the sampling process. Analyzing a sample that is representative of a given parcel of grain is vital to ensure the accuracy of the monitoring system [45] and the ability to apply it in an on-farm situation.
2. Sensor Technologies Used in the Agricultural Production System
Key sensor technologies employed post-farmgate to objectively measure grain quality include RGB imagery, NIR spectroscopy and multispectral spectroscopy. Hyperspectral spectroscopy will become more widely adopted for commercial applications on farms as new cheaper sensors are developed and manufactured. These technologies and grain quality applications are summarized in Table 1, and their advantages and limitations are outlined below.
Table 1. List of sensor technologies and examples of their applications in evaluating grain quality associated with measuring traits important for on-farm applications.
| Sensor Type | Spectral Range (nm) | Application | Product Stage | References |
|---|---|---|---|---|
| Digital camera (benchtop) |
RGB 1 | separation of red vs. white wheat, Fusarium damaged vs. undamaged, high vs. medium vs. low protein | Research | [46] |
| measure grain color, % hard endosperm | Patent | [47] | ||
| gradation of color, whiteness, and hard endosperm of the seed/grain |
Patent | [48] | ||
| measure grain plumpness, density, and volume |
Research | [49][50] | ||
| Stereo camera (in-field, mounted cameras) |
RGB | crop height estimation | Research | [51] |
| wheat canopy structure | Research | [52] | ||
| Near infrared (benchtop) |
900–1600 | variety identification and seed health | Research | [53] |
| 950–1650 | separation of red vs. white kernels, Fusarium damaged vs. undamaged, high vs. medium vs. low protein | Research | [46] | |
| 1100–2300 | prediction of protein and moisture constituency and grain type classification | Research | [31] | |
| 850–2300 | moisture, protein, oil concentration | Commercial | [54] | |
| Multispectral (benchtop) |
360–950; 8 bands |
characterization of desiccation | Research | [55] |
| 375–970; 19 bands |
variety identification and seed health | Research | [53] | |
| 375–970; 19 bands |
seed authentication; % adulterated samples | Research | [56] | |
| 360–950; 8 bands |
fungal contamination detection | Research | [57] | |
| 360–950; 8 bands |
identification of the histological origin | Research | [58] | |
| Hyperspectral (in-field point-based) |
405–850; 6 bands 405–850; 6 bands |
assessment of lentil size traits | Research | [32] |
| classification of defective vs. non-defective field pea | Research | [13] | ||
| 400–1000 350–2500 |
detection and classification of biotic and abiotic stresses in-field; crop yield predictions and mapping |
Research | [19][22][24][39][40] | |
| Hyperspectral (benchtop) |
400–1000 | seed authentication | Research | [56] |
| 400–1000 | detection of green vs. normal barley kernels | Research | [59] | |
| 980–2500 | protein in single wheat kernels | Research | [60] | |
| 1000–2500 | sprouting, enzymatic activity | Research | [61] | |
| 375–1050 | micronutrient composition; Ca, Mg, Mo, and Zn in wheat | Research | [62] |
2.1. Digital RGB Camera
Digital cameras are one of the most widely used sensors with broad applications ranging from industrial quality control and robotics to capturing photographs of scenes and objects. These sensors can provide data-rich information and are used to analyze a wide range of visual traits, key classifying grain quality [63]. Digital (RGB) cameras are typically equipped with light-sensitive Complementary Metal–Oxide–Semiconductor (CMOS) or Charge-Coupled Device (CCD) sensors to acquire colored images of scenes and objects [32][63]. Color filter arrays (CFAs) arranged in a mosaic pattern on top of the sensor selectively filter RGB light, and the intensity of the light in each color channel at different spatial points on the sensor is measured and used to compose an RGB image [63]. RGB cameras are commercially sold as DSLR (Digital Single Lens Reflex), small-scale machine vision cameras, industrial cameras, or as a device component, for example, in smartphones. The specific application of a camera depends on the resolution of the captured images, optics, light and color sensitivity, and frame rate, among a range of other factors. Factors including the signal-to-noise ratio and size of the sensor, optics, illumination and processing of the image (e.g., interpolation of pixels) determine the raw image data. The resolution of a static photo is usually expressed in megapixels, i.e., the number of pixels (length × width) in the image.
Digital cameras equipped with CMOS sensors are used for process-control and monitoring automated systems. Their adoption is mostly driven by reduced costs, improved power efficiency of the CMOS chips, and advancements in machine vision techniques for the analysis of the captured data. CMOS cameras can operate with both passive (sunlight) and active lighting, be deployed on vehicles or UAVs for remote monitoring, and the relatively small size of the generated data (e.g., compared to in-laboratory hyperspectral imaging) enables images to be processed in real-time.
Computer Vision (CV) is the scientific field in which computational methods are developed to derive meaningful information from camera data (images and videos). Computer vision includes computational methods for object and motion tracking, scene understanding, edge detection, segmentation, color and texture analysis [64], object detection, classification, and counting, among some of the applications [65].
Many indicators of food and plant quality, including ripeness of fruit, symptoms of diseases, nutrient deficiencies, damaged plants, weeds and plant species in crop fields, and others, manifest visually and thus assessed according to visual criteria; these features are suitable targets for detection by RGB cameras [32][63][66][67][68][69][70]. Throughout the agricultural industry, the assessment of morphological and phenotypic features usually requires a visual inspection, a labor-intensive process prone to subjectivity and errors. Digital image analysis can improve methods of grain and plant classification according to objective visual criteria. Applications of RGB imaging in grain quality are outlined in Table 1.
The advantage of using RGB cameras is that images are readily interpretable because the information captured is how a human perceives the appearance of the grain sample. Regarding the limitations of applying machine vision, these are similar to those encountered in human vision in that they both operate within the visible range of the light spectrum. Quantifying color using RGB imaging systems is complex as it can be difficult to correct or calibrate between systems due to differences in the camera optics, sample illumination, consistent presentation of the sample for image capture and different ways images can be processed and compressed for storage. The use of consistent lighting across samples and the inclusion of calibration panels within images is critical to robustly quantify grain characteristics. Digital imaging captures the external view of samples, where the internal grain structure and chemical information is not detected in RGB images. Therefore, to analyze sub-surface grain features, other spectroscopic techniques would need to be engaged, including NIR, Raman, NMR, UV, X-ray and fluorescence. Another limitation is the sample orientation. RGB imaging captures one viewpoint of a sample; therefore, traits, such as surface area, volume, length, width and diameter of samples, may not be representative depending on sample presentation. Also, certain complex processing traits have been analyzed using image analysis, such as grain milling, the error can be high and the range in laboratory values limited, compromising the accuracy and precision of the technique [30][71].
2.2. Stereo Cameras
Stereo vision and Structure from Motion (SfM) are two methods used for three-dimensional (3D) imaging with conventional digital cameras [72]. Binocular stereo vision uses images captured from two cameras at different angles and triangulation to compute the depth of scenes, analogous to the human binocular depth perception. In SfM, a single moving camera is used to obtain multiple images from different locations and angles, and the images are processed to obtain the 3D information. Stereo vision enables the estimation of the volume of objects and their spatial arrangements. Most of the applications of stereo cameras in agriculture are field-based and have been to generate 3D field maps [73] for biomass estimation [74], determine morphological features of wheat crops [52] and crop status, including growth, height, shape, nutrition and health [72]. There are limited applications of SfM for grain quality analysis; these include stereo imaging systems with two viewpoints, which have enabled the prediction of grain length, width, thickness and crease depth in wheat [75].
As with the two-dimensional (2D) or single imaging RGB systems, similar limitations are found with stereo vision systems: the information collected is within the visible range (RGB), sample color, differences between imaging systems, sample lighting, internal grain structure and chemical information is not detected, and sample orientation may not be visible. The benefit of using a stereo imaging system is that multiple positions of the sample are captured, and, therefore, the data is not limited to one viewpoint, allowing a complete view of the sample and thereby reducing the error in estimating traits such as surface area and sample volume.
2.3. Near Infrared Spectroscopy
The near infrared (NIR) region of the electromagnetic spectrum encompasses the 700–2500 nm wavelength range and covers the overtone and combination bands involving the C–H, O–H, and N–H functional groups, all of which are prevalent in organic molecules [54][76]. NIR spectroscopy is widely applied to the analysis of materials in agriculture, biomedicine, pharmaceutics, and petrochemistry. In the agriculture industry, NIR spectroscopy is used for determining the physicochemical properties of forages, grains and grain products, oilseeds, coffee, fruits and vegetables, meat and dairy, among many other agricultural products [54][76].
The instrumentation used in NIR spectroscopy consists of a light source (typically an incandescent lamp with broadband NIR radiation), a dispersive element (commonly a diffraction grating) to produce monochromatic light at different wavelengths, and a detector that records the intensity of the reflected or transmitted light at each wavelength [76]. An alternative method of obtaining the same information is with Fourier Transform near infrared (FT-NIR) spectroscopy, where the spectrum is reconstructed from interference patterns produced by a Michelson interferometer (interferogram) within the instrument [77]. Compared to dispersive NIR, FT-NIR systems can collect spectra at higher spectral resolutions; however, unlike gases, this advantage is not significant in the analysis of liquids and solid samples, where the spectral bands are broad (>2 nm). For whole-grain analysis (e.g., protein and moisture constituency), the predictive performance of both types of instruments (FT and dispersive) is similar, indicating no advantage of either method over the other [78].
NIR sensor readings are referenced with ‘white’ (reference) and ‘dark’ scans obtained from highly reflective (assumed to be 100% reflective) flat and homogenous materials such as fluoropolymers like Spectralon®, and dark current (no light) signals, respectively. The reference panel provides calibration to reflectance, which is the physical measure of light from the surface of an object, and the dark measurement quantifies sensor noise. The most common referencing methods assume a linear response for sample reflectance R, given by , where I is the intensity of the signal measured by the sensor and the dark (noise) from the sensor is removed from the sample and reference. Alternatively, sample reflectance may assume a non-linear relation, in which case the reflectance is typically modeled with a higher order polynomial equation, calibrated using a set of reflectance standards (e.g., Spectralon® doped with graded amounts of carbon black) whose reflectance span the ~0–100% reflective range.
NIR spectroscopy is widely adopted, is relatively affordable ($US5000–$50,000) depending on the application and spectral sensitivity needed and is available as both desktop and portable low-power instruments. NIR can provide accurate measures of the chemical constituency of a sample, including the w/w% of nitrogen concentration (and thus protein), moisture, carbohydrates, and oils, among other organic compounds. Because the NIR radiation can penetrate a sample, it can be used to investigate its chemical composition. Furthermore, in densely packed bulk grain where objects overlap and occlude one another, unlike in image analysis, the NIR device is operable and not sensitive to the orientation and careful arrangement of the individual grains and can be used to measure whole grain sample properties.
Traditional NIR spectroscopy sensors, unlike digital imaging, capture the average spectrum of a sample of grain packed within a measuring cell. Digital images capture two-dimensional information, and within the image features can measure grain size distribution, whereas NIR spectroscopy, typically in homogenous samples, quantifies an average (of the analyzed sample) quantity of all the individual grains within the sensor field of view. Complexities in sample composition, mixing of spectral components (different parts of the grains, shadows, contaminants, etc.), and low concentration of analytes can limit the accuracy of traits measured with a NIR instrument.
Applications for NIR spectroscopy include rapid determination of oil, protein, starch, and moisture in a range of grains and their products [54], including forages and food products [79]. Other applications include the identification of wheat varieties and seed health [53], fungal contamination [46] and prediction of protein and moisture concentration [54][79]. NIR has been widely adopted to measure protein and moisture concentration which is then used to determine the value (grade of the grain) and processing quality of the grain, i.e., baking quality in wheat and malting quality in barley.
2.4. Multispectral Imaging
Multispectral imaging acquires reflectance data at (often narrow) discrete bands (up to about 20) spanning the ultraviolet (UV), visible, and near infrared (NIR) regions of the electromagnetic spectrum. In contrast, RGB color images only provide data at three (broad wavelength) channels (R, G, and B) within the visible spectrum. Regardless of the modality (RGB, multispectral, or in-lab hyperspectral), the data is organized in three-dimensional numerical arrays (i.e., data cubes) where the first two dimensions (X and Y) correspond to the spatial information, and the third dimension (λ) stores the spectral information. There are three main methods for the acquisition of data in spectral imaging systems, named after the sequence of data acquisition along each of the X, Y and λ directions: (i) point-scanning (whiskbroom), (ii) line-scanning (push-broom) and (iii) area scanning methods. Multispectral imaging has similar applications to RGB imaging; however, as the spectral bands can extend beyond the visible region, multispectral imagers have been used to identify wheat varieties, detect black point disease or fungal contamination [53][57], track desiccation of seeds [55], seed authentication [56] and identify the histological origin of wheat grain [58]. Point-scanning involves the acquisition of a complete spectrum at each spatial point (X, Y), and the data is stored in band-interleaved-by-pixel (BIP) format. Because the spectrum at each pixel is acquired one at a time, this system is typically used in microscopy (e.g., atomic force microscopy) where acquisition speed is not a priority (because the object is not moving). In line-scanners, data is recorded line by line (y, λ) as the target sample moves along the X-direction. The data is stored in band-interleaved-by-line (BIL) format. This configuration is typically used in industrial scanners where samples are scanned during their movement on a conveyor under the imaging system. This is also typical when the sensor itself is moving across a stationary target, such as when deployed from an aircraft. In area-scanners, an entire 2D image is acquired at each λ, which results in a band-sequential (BSQ) data format. This method requires a rotating filter wheel or a tunable filter (e.g., Liquid crystal tenable filter, LCTF, or Acousto-optic tunable filters, AOTF) to target the wavelengths of interest at each scan and is generally not suitable for moving samples, unless movement is minimal with a high degree of overlap [76]. Other imaging systems use LEDs of different emission wavelengths (UV—NIR) to sequentially illuminate objects placed in a dark enclosure to capture greyscale images, which are then multiplexed along the λ direction to form the multispectral data. Variations in illumination (due to lighting geometry and setup), sensor sensitivity, imaging method, and environmental conditions (e.g., temperature and humidity) can affect the data quality acquired by spectral imaging systems, hence calibrations of these systems are very crucial and important for their function [30]. In remote sensing applications, the set of calibrations are often referred to as radiometric calibrations, which additionally account for the effects of altitude, weather, and other atmospheric conditions [80].
Low-frequency NIR wavelengths or UV have been used in multispectral imagers that can penetrate objects to capture information beyond the surface images of standard RGB cameras. Therefore, features ‘invisible’ to RGB imaging can be used to determine the chemical composition of samples, albeit with limited accuracy, depending on the number and frequency of the spectral bands. Multispectral systems are limited in their capacity to measure the chemical composition of samples effectively because only a limited number of wavebands tend to be utilized to ensure the instrument is low-cost. Hyperspectral imaging and spectroscopy methods are suited for this purpose. Furthermore, multispectral cameras are more expensive than digital RGB cameras.
References
- Panozzo, J.F.; Walker, C.K.; Maharjan, P.; Partington, D.L.; Korte, C.J. Elevated CO2 affects plant nitrogen and water-soluble carbohydrates but not in vitro metabolisable energy. J. Agron. Crop Sci. 2019, 205, 647–658.
- Martin, C.T.; McCallum, J.D.; Long, D.S. A Web-Based Calculator for Estimating the Profit Potential of Grain Segregation by Protein Concentration. Agron. J. 2013, 105, 721–726.
- Meneghetti, V.L.; Pohndorf, R.S.; Biduski, B.; Zavareze, E.d.R.; Gutkoski, L.C.; Elias, M.C. Wheat grain storage at moisture milling: Control of protein quality and bakery performance. J. Food Process. Preserv. 2019, 43, e13974.
- Delahunty, A.; Perry, E.; Wallace, A.; Nuttall, J. Frost response in lentil. Part 1. Measuring the impact on yield and quality. In Proceedings of the 19th Australian Agronomy Conference, Wagga Wagga, NSW, Australia, 25–29 August 2019.
- Walker, C.; Armstrong, R.; Panozzo, J.; Partington, D.; Fitzgerald, G. Can nitrogen fertiliser maintain wheat (Triticum aestivum) grain protein concentration in an elevated CO2 environment? Soil Res. 2017, 55, 518–523.
- Thakur, M.; Hurburgh, C.R. Framework for implementing traceability system in the bulk grain supply chain. J. Food Eng. 2009, 95, 617–626.
- Bourgault, M.; Löw, M.; Tausz-Posch, S.; Nuttall, J.G.; Delahunty, A.J.; Brand, J.; Panozzo, J.F.; McDonald, L.; O’Leary, G.J.; Armstrong, R.D.; et al. Effect of a Heat Wave on Lentil Grown under Free-Air CO2 Enrichment (FACE) in a Semi-Arid Environment. Crop Sci. 2018, 58, 803–812.
- Black, C.K.; Panozzo, J.F. Accurate Technique for Measuring Color Values of Grain and Grain Products Using a Visible-NIR Instrument. Cereal Chem. 2004, 81, 469–474.
- McDonald, L.S.; Assadzadeh, S.; Panozzo, J.F. Images, features, or feature distributions? A comparison of inputs for training convolutional neural networks to classify lentil and field pea milling fractions. Biosyst. Eng. 2021, 208, 16–27.
- McDonald, L.; Panozzo, J. A review of the opportunities for spectral-based technologies in post-harvest testing of pulse grains. Legume Sci. 2022, e175.
- Grain Trade Australia. Trading Standards. Available online: https://www.graintrade.org.au/commodity_standards (accessed on 13 April 2023).
- Assadzadeh, S.; Walker, C.K.; McDonald, L.S.; Panozzo, J.F. Prediction of milling yield in wheat with the use of spectral, colour, shape, and morphological features. Biosyst. Eng. 2022, 214, 28–41.
- McDonald, L.S.; Panozzo, J.F.; Salisbury, P.A.; Ford, R. Discriminant Analysis of Defective and Non-Defective Field Pea (Pisum sativum L.) into Broad Market Grades Based on Digital Image Features. PLoS ONE 2016, 11, e0155523.
- Caporaso, N.; Whitworth, M.; Fisk, I. Application of calibrations to hyperspectral images of food grains: Example for wheat falling number. J. Spectr. Imaging 2017, 6, 1–15.
- Nuttall, J.G.; O’Leary, G.J.; Panozzo, J.F.; Walker, C.K.; Barlow, K.M.; Fitzgerald, G.J. Models of grain quality in wheat—A review. Field Crops Res. 2017, 202, 136–145.
- Walsh, O.S.; Torrion, J.A.; Liang, X.; Shafian, S.; Yang, R.; Belmont, K.M.; McClintick-Chess, J.R. Grain yield, quality, and spectral characteristics of wheat grown under varied nitrogen and irrigation. Agrosyst. Geosci. Environ. 2020, 3, e20104.
- Rodriguez, D.; Fitzgerald, G.J.; Belford, R.; Christensen, L.K. Detection of nitrogen deficiency in wheat from spectral reflectance indices and basic crop eco-physiological concepts. Aust. J. Agric. Res. 2006, 57, 781–789.
- Cammarano, D.; Fitzgerald, G.; Basso, B.; O’Leary, G.; Chen, D.; Grace, P.; Fiorentino, C. Use of the Canopy Chlorophyl Content Index (CCCI) for Remote Estimation of Wheat Nitrogen Content in Rainfed Environments. Agron. J. 2011, 103, 1597–1603.
- Nuttall, J.G.; Perry, E.M.; Delahunty, A.J.; O’Leary, G.J.; Barlow, K.M.; Wallace, A.J. Frost response in wheat and early detection using proximal sensors. J. Agron. Crop Sci. 2019, 205, 220–234.
- Behmann, J.; Mahlein, A.-K.; Rumpf, T.; Römer, C.; Plümer, L. A review of advanced machine learning methods for the detection of biotic stress in precision crop protection. Precis. Agric. 2015, 16, 239–260.
- Basso, B.; Fiorentino, C.; Cammarano, D.; Cafiero, G.; Dardanelli, J. Analysis of rainfall distribution on spatial and temporal patterns of wheat yield in Mediterranean environment. Eur. J. Agron. 2012, 41, 52–65.
- Perry, E.M.; Nuttall, J.G.; Wallace, A.J.; Fitzgerald, G.J. In-field methods for rapid detection of frost damage in Australian dryland wheat during the reproductive and grain-filling phase. Crop Pasture Sci. 2017, 68, 516–526.
- McEntee, P.; Bennett, S.; Belford, R.; Harper, J.; Trotter, M. Mapping the stability of spatial production in integrated crop and pasture systems: Towards zonal management that accounts for both yield and livestock-landscape interactions. In Proceedings of the 13th International Conference on Precision Agriculture, St. Louis, MO, USA, 31 July–3 August 2016; pp. 1–13.
- Pantazi, X.E.; Moshou, D.; Oberti, R.; West, J.; Mouazen, A.M.; Bochtis, D. Detection of biotic and abiotic stresses in crops by using hierarchical self organizing classifiers. Precis. Agric. 2017, 18, 383–393.
- Skerritt, J.H.; Adams, M.L.; Cook, S.E.; Naglis, G. Within-field variation in wheat quality: Implications for precision agricultural management. Aust. J. Agric. Res. 2002, 53, 1229–1242.
- Whelan, B.M.; Taylor, J.A.; Hassall, J.A. Site-specific variation in wheat grain protein concentration and wheat grain yield measured on an Australian farm using harvester-mounted on-the-go sensors. Crop Pasture Sci. 2009, 60, 808–817.
- Cillis, D.; Pezzuolo, A.; Gasparini, F.; Marinello, F.; Sartori, L. Differential harvesting strategy: Technical and economic feasibility. In Proceedings of the 6th International Conference on Trends in Agricultural Engineering, Prague, Czech Republic, 7–9 September 2016.
- Tozer, P.R.; Isbister, B.J. Is it economically feasible to harvest by management zone? Precis. Agric. 2007, 8, 151–159.
- Long, D.S.; McCallum, J.D.; Scharf, P.A. Optical-Mechanical System for On-Combine Segregation of Wheat by Grain Protein Concentration. Agron. J. 2013, 105, 1529–1535.
- ElMasry, G.; Mandour, N.; Al-Rejaie, S.; Belin, E.; Rousseau, D. Recent Applications of Multispectral Imaging in Seed Phenotyping and Quality Monitoring-An Overview. Sensors 2019, 19, 51090.
- Assadzadeh, S.; Walker, C.; McDonald, L.; Maharjan, P.; Panozzo, J. Multi-task deep learning of near infrared spectra for improved grain quality trait predictions. J. Near Infrared Spectrosc. 2020, 28, 275–286.
- LeMasurier, L.S.; Panozzo, J.F.; Walker, C.K. A digital image analysis method for assessment of lentil size traits. J. Food Eng. 2014, 128, 72–78.
- León, K.; Mery, D.; Pedreschi, F.; León, J. Color measurement in L*a*b* units from RGB digital images. Food Res. Int. 2006, 39, 1084–1091.
- Hatfield, J.L.; Gitelson, A.A.; Schepers, J.S.; Walthall, C.L. Application of Spectral Remote Sensing for Agronomic Decisions. Agron. J. 2008, 100, S-117–S-131.
- Jackson, R. Remote Sensing of Biotic and Abiotic Plant Stress. Annu. Rev. Phytopathol. 1986, 24, 265–287.
- Rouse, J.; Haas, R.; Schell, J.A.; Deering, D.W. Monitoring vegetation systems in the Great Plains with ETRS. In Proceedings of the 3rd ETRS Symposium, NASA SP353, Washington, DC, USA, 10–14 December 1974.
- Chen, Y.; Zhang, Z.; Tao, F.; Palosuo, T.; Rötter, R.P. Impacts of heat stress on leaf area index and growth duration of winter wheat in the North China Plain. Field Crops Res. 2018, 222, 230–237.
- Fitzgerald, G.; Rodriguez, D.; O’Leary, G. Measuring and predicting canopy nitrogen nutrition in wheat using a spectral index—The canopy chlorophyll content index (CCCI). Field Crops Res. 2010, 116, 318–324.
- Perry, E.; Delahunty, A.; Nuttall, J.; Clancy, A.; Wallace, A. Frost response in lentil. Part 2. Detecting early frost damage using proximal sensing. In Proceedings of the 19th Australian Agronomy Conference, Wagga Wagga, NSW, Australia, 25–29 August 2019.
- Wallace, A.; Nuttall, J.; Perry, E.; Brand, J.; Henry, F. Proximal sensors to detect fungal disease in chickpea and faba bean. In Proceedings of the “Doing More with Less”, Proceedings of the 18th Australian Agronomy Conference 2017, Ballarat, VIC, Australia, 24–28 September 2017.
- Singh, C.B.; Fielke, J.M. Recent developments in stored grain sensors, monitoring and management technology. IEEE Instrum. Meas. Mag. 2017, 20, 32–55.
- Clancy, P. Finding the sweet spot in nitrogen fertilization by measuring protein with an on combine NIR analyser. In Proceedings of the 69th Australasian Grain Science Conference, Melbourne, VIC, Australia, 26–29 August 2019; pp. 106–108.
- Cassells, J.A.; Reuss, R.; Osborne, B.G.; Wesley, I.J. Near Infrared Spectroscopic Studies of Changes in Stored Grain. J. Near Infrared Spectrosc. 2007, 15, 161–167.
- Gras, P.; Kaur, S.; Lewis, D.; O’Riordan, B.; Suter, D.; Thomson, W. How and why to keep grain quality constant. In Proceedings of the Stored Grain in Australia 2000: Proceedings of the 2nd Australian Postharvest Technical Conference, Adelaide, South Australia, 1–4 August 2000; pp. 195–198.
- Wrigley, C.W. Potential methodologies and strategies for the rapid assessment of feed-grain quality. Aust. J. Agric. Res. 1999, 50, 789–806.
- Pearson, T.C.; Maghirang, E.; Dowell, F. A Multispectral Sorting Device for Wheat Kernels. Am. J. Agric. Sci. Technol. 2013, 2, 45–60.
- Tragesser, S. Use of Color Image Analyzers for Quantifying Grain Quality Traits. U.S. Patent 5,835,206, 10 November 1998.
- Jones, M.A.; Foster, D.J.; Rimathe, D.M. Method and Apparatus for Analyzing Quality Traits of Grain or Seed. U.S. Patent 8,031,910, 4 October 2004.
- Walker, C.K.; Panozzo, J.; Ford, R.; Moody, D. Measuring grain plumpness in barley using image analysis. In Proceedings of the 14th Australian Barley Technical Symposium, Sunshine Coast, QLD, Australia, 13–16 September 2009; pp. 1–7.
- Walker, C.; Ford, R.; Muñoz-Amatriaín, M.; Panozzo, J. The detection of QTLs associated with endosperm hardness, grain density, malting quality and plant development traits in barley using rapid phenotyping tools. Theor. Appl. Genet. 2013, 126, 2533–2551.
- Kim, W.-S.; Lee, D.-H.; Kim, Y.-J.; Kim, T.; Lee, W.-S.; Choi, C.-H. Stereo-vision-based crop height estimation for agricultural robots. Comput. Electron. Agric. 2021, 181, 105937.
- Dandrifosse, S.; Bouvry, A.; Leemans, V.; Dumont, B.; Mercatoris, B. Imaging Wheat Canopy Through Stereo Vision: Overcoming the Challenges of the Laboratory to Field Transition for Morphological Features Extraction. Front. Plant Sci. 2020, 11, 96.
- Vrešak, M.; Halkjaer Olesen, M.; Gislum, R.; Bavec, F.; Ravn Jørgensen, J. The Use of Image-Spectroscopy Technology as a Diagnostic Method for Seed Health Testing and Variety Identification. PLoS ONE 2016, 11, e0152011.
- Williams, P.C.; Norris, K. Near-Infrared Technology in the Agricultural and Food Industries, 2nd ed.; American Association of Cereal Chemists (AACC): St. Paul, MN, USA, 2001.
- Jaillais, B.; Perrin, E.; Mangavel, C.; Bertrand, D. Characterization of the desiccation of wheat kernels by multivariate imaging. Planta 2011, 233, 1147–1156.
- Wilkes, T.; Nixon, G.; Bushell, C.; Waltho, A.; Alroichdi, A.; Burns, M. Feasibility Study for Applying Spectral Imaging for Wheat Grain Authenticity Testing in Pasta. Food Nutr. Sci. 2016, 7, 355–361.
- Jaillais, B.; Roumet, P.; Pinson-Gadais, L.; Bertrand, D. Detection of Fusarium head blight contamination in wheat kernels by multivariate imaging. Food Control 2015, 54, 250–258.
- Jaillais, B.; Bertrand, D.; Abecassis, J. Identification of the histological origin of durum wheat milling products by multispectral imaging and chemometrics. J. Cereal Sci. 2012, 55, 210–217.
- Shahin, M.A.; Hatcher, D.W.; Symons, S.J. 17-Development of multispectral imaging systems for quality evaluation of cereal grains and grain products. In Computer Vision Technology in the Food and Beverage Industries; Sun, D.-W., Ed.; Woodhead Publishing: Cambridge, UK, 2012; pp. 451–482.
- Caporaso, N.; Whitworth, M.B.; Fisk, I.D. Protein content prediction in single wheat kernels using hyperspectral imaging. Food Chem. 2018, 240, 32–42.
- McGoverin, C.M.; Engelbrecht, P.; Geladi, P.; Manley, M. Characterisation of non-viable whole barley, wheat and sorghum grains using near-infrared hyperspectral data and chemometrics. Anal. Bioanal. Chem. 2011, 401, 2283–2289.
- Hu, N.; Li, W.; Du, C.; Zhang, Z.; Gao, Y.; Sun, Z.; Yang, L.; Yu, K.; Zhang, Y.; Wang, Z. Predicting micronutrients of wheat using hyperspectral imaging. Food Chem. 2021, 343, 128473.
- Vithu, P.; Moses, J.A. Machine vision system for food grain quality evaluation: A review. Trends Food Sci. Technol. 2016, 56, 13–20.
- Humeau-Heurtier, A. Texture Feature Extraction Methods: A Survey. IEEE Access 2019, 7, 8975–9000.
- Brosnan, T.; Sun, D.-W. Inspection and grading of agricultural and food products by computer vision systems—A review. Comput. Electron. Agric. 2002, 36, 193–213.
- Liu, D.; Ning, X.; Li, Z.; Yang, D.; Li, H.; Gao, L. Discriminating and elimination of damaged soybean seeds based on image characteristics. J. Stored Prod. Res. 2015, 60, 67–74.
- Mahajan, S.; Das, A.; Sardana, H.K. Image acquisition techniques for assessment of legume quality. Trends Food Sci. Technol. 2015, 42, 116–133.
- Pearson, T.; Moore, D.; Pearson, J. A machine vision system for high speed sorting of small spots on grains. J. Food Meas. Charact. 2012, 6, 27–34.
- Wu, D.; Sun, D.-W. Colour measurements by computer vision for food quality control—A review. Trends Food Sci. Technol. 2013, 29, 5–20.
- Neuman, M.R.; Sapirstein, H.D.; Shwedyk, E.; Bushuk, W. Wheat grain colour analysis by digital image processing II. Wheat class discrimination. J. Cereal Sci. 1989, 10, 183–188.
- Huang, M.; Wang, Q.G.; Zhu, Q.B.; Qin, J.W.; Huang, G. Review of seed quality and safety tests using optical sensing technologies. Seed Sci. Technol. 2015, 43, 337–366.
- Vázquez-Arellano, M.; Griepentrog, H.W.; Reiser, D.; Paraforos, D.S. 3-D Imaging Systems for Agricultural Applications—A Review. Sensors 2016, 16, 618.
- Rovira-Más, F.; Zhang, Q.; Reid, J.F. Stereo vision three-dimensional terrain maps for precision agriculture. Comput. Electron. Agric. 2008, 60, 133–143.
- Boldt, J.L.; Williams, K.; Rooper, C.N.; Towler, R.H.; Gauthier, S. Development of stereo camera methodologies to improve pelagic fish biomass estimates and inform ecosystem management in marine waters. Fish. Res. 2018, 198, 66–77.
- Sun, C.; Berman, M.; Coward, D.; Osborne, B. Thickness measurement and crease detection of wheat grains using stereo vision. Pattern Recognit. Lett. 2007, 28, 1501–1508.
- Park, B.; Lu, R. Hyperspectral Imaging Technology in Food and Agriculture; Springer: New York, NY, USA, 2015.
- Subramanian, A.; Rodriguez-Saona, L. Chapter 7-Fourier Transform Infrared (FTIR) Spectroscopy. In Infrared Spectroscopy for Food Quality Analysis and Control; Sun, D.-W., Ed.; Academic Press: San Diego, CA, USA, 2009; pp. 145–178.
- Armstrong, P.R.; Maghirang, E.; Xie, F.; Dowell, F. Comparison of Dispersive and Fourier-transform NIR Instruments for Measuring Grain and Flour Attributes. Appl. Eng. Agric. 2006, 22, 453–457.
- Shenk, J.S.; Workman, J.J.; Westerhaus, M.O. Application of NIR spectroscopy to agricultural products. In Handbook of Near-Infrared Analysis; Burns, D.A., Ciurczak, E.W., Eds.; CRC Press: Boca Raton, FL, USA, 2007; pp. 419–474.
- Guo, Y.; Senthilnath, J.; Wu, W.; Zhang, X.; Zeng, Z.; Huang, H. Radiometric Calibration for Multispectral Camera of Different Imaging Conditions Mounted on a UAV Platform. Sustainability 2019, 11, 978.
More
Information
Subjects:
Remote Sensing
Contributors
MDPI registered users' name will be linked to their SciProfiles pages. To register with us, please refer to https://encyclopedia.pub/register
:
View Times:
1.2K
Entry Collection:
Remote Sensing Data Fusion
Revisions:
2 times
(View History)
Update Date:
27 Apr 2023
Table of Contents


Notice
You are not a member of the advisory board for this topic. If you want to update advisory board member profile, please contact office@encyclopedia.pub.
OK
Confirm
Only members of the Encyclopedia advisory board for this topic are allowed to note entries. Would you like to become an advisory board member of the Encyclopedia?
Yes
No
${ textCharacter }/${ maxCharacter }
Submit
Cancel
Back
Comments
${ item }
|
${ item.createdUser.fullName }
${ item.createdAt }
${ item.vote }
${ item.reply }
Delete
${ reply.createdUser.fullName }
${ reply.createdAt }
${ reply.vote }
Delete
There is no reply to this comment~
${ item.replyTextCharacter }/${ item.replyMaxCharacter }
Submit
Cancel
More
No more~
There is no comment~
${ textCharacter }/${ maxCharacter }
Submit
Cancel
${ selectedItem.replyTextCharacter }/${ selectedItem.replyMaxCharacter }
Submit
Cancel
Confirm
Are you sure to Delete?
Yes
No