Your browser does not fully support modern features. Please upgrade for a smoother experience.
Please note this is a comparison between Version 1 by Cassandra Walker and Version 2 by Rita Xu.
Grains intended for human consumption or feedstock are typically high-value commodities that are marketed based on either their visual characteristics or compositional properties. The combination of visual traits, chemical composition and contaminants is generally referred to as grain quality.
- in-field
- spectroscopy
- grain size
- grain color
- quality
- image analysis
- machine learning
1. Introduction
The application of sensor technologies in agriculture is having an increasing role in measuring grain yield potential and grain quality throughout the cropping season. Important global arable crops include wheat, maize, canola, rice, soybean and barley due to their nutritional importance, functional properties, and commodity value. The grain quality of commercially grown crops is influenced by a range of factors, including cultivation practices, environment, harvest timing, grain handling, storage management and transportation [1][2][3][4][5][6][7][1,2,3,4,5,6,7]. The spatial variation observed in grain yields can be due to soil type, topography and interactions with the environment (e.g., frost and water availability) within and across fields and farms and is well recognized as a driver of variation in grain quality. In addition, with the increasing likelihood of extreme events and biotic pressures associated with climate change, it will be more challenging to maintain grain quality in future environments. Although growers currently manage these variations through better-adaptive cultivars, management practices and in-field sensors could provide improvements in managing grain quality and, ultimately, profits by providing information that would allow identification and segregation of grain quality by quantifying variation in quality obtained from the field. This would benefit end-users and add value to the farming enterprise.
Grain quality is defined by a range of physical and compositional properties, where the end-use dictates the grain and compositional traits and market potential [8][9][10][8,9,10]. Grain quality has traditionally been measured post-farmgate when growers deliver to grain receival agents, and the load is subsampled and tested within a clean testing environment such as a testing station or laboratory using benchtop instrumentation and human visual inspection. Grain quality when received by grain receival agents is graded using two approaches: firstly, subjective procedures undertaken by trained operators (grain inspectors) assessing visual traits, including stained, cracked, defective grain and contaminants, and secondly, objectively using standardized instrumentation, such as sieves to determine grain size and near infrared spectroscopy (NIR) to determine the composition, such as protein and moisture concentration [10][11][10,11]. Key traits used in valuing and trading grain include the percentage of small grain (screenings), foreign material (unable to be processed, milled or malted), contaminates, sprouted, stained or discolored grain, broken, damaged or distorted grain, presence of insects or mold, test weight, or composition including moisture concentration, protein concentration, low levels of aflatoxins and a high Hagberg falling number test [9][12][13][14][9,12,13,14]. Many of these traits are measured as % per weight of samples subsampled from the grain load. Manufacturers of end-product determine the specifications or limits associated with these quality traits, as grain outside the set specifications impacts the end-product quality. For example, small, shriveled grain that may be high in protein concentration would be undesirable when processing food products from wheat as these impact flour yields, baking loaf volume and dough rheology characteristics as reviewed by [15].
The application of sensor technologies pre-harvest is increasingly being incorporated into farming enterprises to determine the impact of environmental factors on grain production and yield. For example, field sensors are used to discern spatial and temporal information throughout the production system, including soil type variation and nitrogen inputs (e.g., electromagnetic conductivity [EM38]), growth habit (Normalized Difference Vegetative Index [NDVI] and relative greenness [SPAD]) [16][17][16,17], nutritional status (Canopy Chlorophyll Content Index [CCCI]) [18], the impact of abiotic stresses such as frost and heat [4][19][4,19], and biotics where RGB (Red, Green, Blue) imaging is used to target spraying weeds [20]. The next transition is to utilize sensors to record reliable, efficient, and relevant data associated with grain quality. Downgrades in grain quality can be caused by heat waves and frost during grain filling, drought, disease and the presence of weeds or other contaminants. Previous studies have shown that stresses such as high temperature, chilling, water stress (associated with soil type), and disease can vary spatially within grower’s fields [21][22][23][24][21,22,23,24]. Studies linking the spatial distribution of stress events to grain quality have predominantly been related to protein and protein quality in wheat [25][26][25,26]. However, limitations remain as to how sensor technologies can be applied to all crop types for a range of grain quality traits.
The monitoring of grain quality, pre- or post-harvest, is currently limited by the costs of the sensors, their availability, and the development of algorithms for measuring key grain quality traits. A deeper understanding of the grower’s perspective, in particular, the key quality traits of relevance to their farm business, is required to guide priorities when developing these applications. Consideration must also be given to a range of practical issues associated with deploying sensors on-farm and managing the logistics of a segregated grain supply chain. Previous studies have highlighted some opportunities to improve grower returns through segregating cereals at harvest [2][27][28][29][2,27,28,29]; the economics of actively managing grain quality on-farm needs to be quantified at the practical level.
Given the speed of sensor development and miniaturization, sensor technologies are commercially available that produce reliable data in an on-farm environment rather than in a clean laboratory. Moving sensors on-farm and in-field enable growers to strategically manage grain quality before the product is sold (post-farmgate) (Figure 1). The most common commercially available sensor that determines grain composition is the benchtop NIR. Growers subsample harvested grain and use these systems to determine moisture and protein prior to sale or storage.
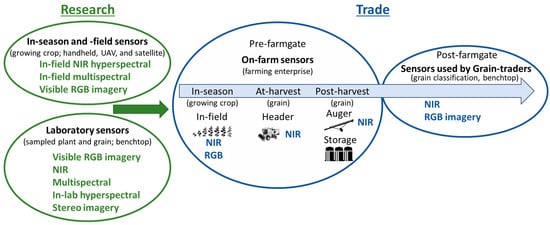
Figure 1. Commercially available practices used to predict grain quality in research and for trade purposes.
Technologies that are commercially available that have the potential to objectively measure grain quality for trade purposes and are likely to be adopted within the next 5 to 10 years include NIR, digital RGB imaging, multi- and hyper-spectral RGB and NIR sensors (Figure 1). These sensors enable rapid and non-destructive approaches to determine grain quality and are used to analyze plant and grain material for research purposes in-season, at-harvest, and post-harvest [19][22][30][31][32][19,22,30,31,32]. The focus is on digital imaging and NIR spectral technologies, as these are currently used in research in-lab and, as described, are moving from the lab to the farm, but there are several considerations needed to make this possible. The focus is the commercial and research landscape of current and emerging visible and NIR sensor systems, with consideration of the practicality of applying these technologies on-farm to assess quality traits used to determine market value. Low-cost portable sensors are moving from research, benchtop and laboratory applications to on-farm practical applications where grain quality can be measured objectively in real-time and inform grain management decisions prior to sale post-farm gate.
A critical step in applying sensor technology for determining grain quality is the analysis of the data collected. The application of different analytical techniques is dependent on the types of data generated by different types of sensors. Color space analysis [33], for example, is appropriate to use with digital imagery (RGB), while machine learning methods generally require very large data sets and are adept at finding patterns within high-dimensional data sets. As processing speeds increase and computational costs decrease, even more data-intense analytical techniques can be used to help interpret data in near real-time. To make the best use of sensors and the increasingly large amounts of data produced, it in critical to select appropriate software analytical techniques to work hand in hand with the sensor hardware.
1.1. Options for On-Farm Sensing Grain Quality
Within dryland cropping systems, proximal and remote sensing technologies are being used to capture and manage temporal and spatial variability that cause variation in crop growth, yield and quality across the landscape [34][35][34,35]. Remote sensing can operate at multiple scales to assess crop growth and stress, including using hand-held instruments at the field scale, airborne platforms at the field and farm scales and satellites at scales from field to regional levels (Figure 1). For example, a crop reflectance index, referred to as the Normalized Difference Vegetation Index (NDVI), measures the difference between near infrared (vegetation strongly reflects) and red light (vegetation absorbs). This index measures crop canopy cover and can correlate with plant biomass enabling the monitoring of vegetation systems [36]. In one long-term study which assessed the response of winter wheat to heat stress on the North China Plain, canopy reflectance measured from satellite platforms [37] was used to assess crop phenology and senescence rate (spatially and temporally), providing insight into climate change impacts on broadscale production potential. Canopy reflectance information using targeted spectral indices from the visible and near infrared spectral regions has also been correlated with plant nitrogen status in wheat [38], leading to the development of indices including the Canopy Content Chlorophyll Index (CCCI) and the Canopy Nitrogen Index (CNI) at the experimental plot scale. Further testing of these indices across different dryland growing environments in Australia and Italy confirmed their utility, with good agreement between these indices and canopy nitrogen concentration (r2 = 0.97) early in the growing season [18]. In this example, such canopy-based remotely sensed indices provide growers with a decision support tool to guide in-season nitrogen fertilizer application, enabling spatial management of fertilizer rate across the paddock, thus optimizing the match between plant nitrogen demand and application. More recently, crop canopy reflectance characteristics have also been used to monitor frost damage in wheat grown in southern Australia [19][22][19,22], where rapid estimation of frost damage to crops on a spatial basis supports the timely management decisions by growers to reduce the economic impact of frost. In these studies, where hyperspectral reflectance and active light fluorescence were assessed, the reflectance indices Photochemical Response Index (PRI), Normalized Difference Red-Edge Index (NDRE), NDVI and the fluorescence-based index FLAV (Near Infrared Fluorescence excited with Red/Infrared Fluorescence excited with UV (375 nm) correlated well with frost damage experimentally imposed to field grown wheat at flowering. These principles are now evolving to a more widespread application within the grains industry, with service providers now offering seasonal satellite imagery and interpretation in the context of crop performance, spatial variation (topography) and soil characteristics. These data can be useful to inform the management of distinct parts of a paddock or farm (as management zones) for nutritional, abiotic, and biotic disorders to maximize yields and ensure high grain quality. Research undertaken on-farm relates monitoring of canopy reflectance to crop growth and yield. However, this resviearchw highlights the importance and value of predicting the quality of the end-product, i.e., the grain, for growers on-farm. To predict grain-yield, a study that employed hand-held hyperspectral devices assessed variation in frost-affected lentil crops and confirmed that frost damage could be effectively detected in-season using remote sensing and that the stress response corresponds to both yield and quality outcomes [4][39][4,39]. Similarly, the use of the active light fluorometer index FLAV in chickpeas and the spectral reflectance-based Anthocyanin Release Index 1 in faba beans have shown utility for the detection of the disease Ascochyta blight at the leaf-level [40]. Given the potential for Ascochyta blight, a fungal disease in pulse grains caused by Ascochyta rabei, to affect grain quality, this offers the opportunity for improved control of diseases through spatial management of foliar fungicides [40], potentially reducing associated quality downgrades and seed carryover. More broadly, if variation in crop canopy reflectance (NIR) based on environmental stresses could be linked to grain quality, this would allow in-season mapping to predict spatial variation in grain quality prior to harvest. With this knowledge, the harvesting program could be tactically designed to harvest zones based on predicted yield and limit economic losses to environmental effects on grain quality within the grains industry. Monitoring crop canopies using spectral analysis has the potential to provide growers with the tools to better manage grain quality. For this technology to be applied on-farm, further research is required to identify remote sensing measures that correlate with grain quality outcomes for key crop species. The logistics of employing such techniques on-farm must also be considered; the timeliness of collecting and interpreting spatial data to inform harvest zoning and the physical infrastructure and logistics to accommodate the various quality grades are two such examples. Developing prediction models for grain quality based on sensor data will inform harvest zones for quality and maximize financial return.1.2. Data Acquisition Systems and Sample Handling
In addition to monitoring and managing grain quality prior to harvest, there are opportunities to directly monitor grain quality at various points in the supply chain from harvest through to sale. In this case, sensors could be installed within harvesting or grain handling machinery [26], in grain storage infrastructure [41], or in a ‘benchtop’ or laboratory setting similar to grain receival points [32]. Compared with in-season quality monitoring, assessment of grain quality at harvest or during movement to storage offers the advantage of avoiding the need for mapping and interpreting quality data prior to harvest, saving an additional operation. It may also allow for the identification of quality defects not otherwise evident through spectral analysis of the crop canopy; for example, instances where weeds or other contaminants (e.g., snails) arise closer to crop maturity. Monitoring of grain quality at- or post-harvest can also be undertaken spatially, enabling proactive management in future seasons. Commercially available grain protein monitors are one such example [26][42][26,42], enabling segregation based on grain quality at harvest or during movement into or out of storage while providing information to inform future decisions relating to nitrogen fertilizer. In addition to segregating grain based on quality grade, monitoring quality at- or post-harvest may enable growers to blend grain of various quality levels in specific proportions prior to entering storage [42]. This strategy can be used to ‘lift’ low-quality grain from one grade to the next, helping to achieve the highest aggregate quality and price for grain produced across a farm business. In addition to monitoring grain quality at-harvest or during movement into storage, directly monitoring grain quality could also be undertaken during storage. Studies such as [43][44][43,44] have shown that grain quality can change over time. While optimizing storage conditions through aeration, temperature control and fumigation can all help to maintain grain quality for longer, monitoring of stored grain in situ offers the potential to target marketing decisions based on projected commodity prices and prediction of grain quality over time. In considering the on-farm application of grain quality monitoring systems, it is important to understand accuracy requirements. The ultimate success of quality monitoring is dependent on its ability to correctly classify a known volume of grain into its respective quality grade to trade. The accuracy required will depend on the crop species and the quality grade being targeted. This is further complicated where the quality of a given grain parcel varies across different target traits, e.g., contamination, color, and size, requiring more comprehensive monitoring systems with multiple algorithms (and perhaps different technologies) to account for the different traits within the grade. Typically, the utility of a monitoring system depends on the accuracy of both the instrument and the sampling process. Analyzing a sample that is representative of a given parcel of grain is vital to ensure the accuracy of the monitoring system [45] and the ability to apply it in an on-farm situation.2. Sensor Technologies Used in the Agricultural Production System
Key sensor technologies employed post-farmgate to objectively measure grain quality include RGB imagery, NIR spectroscopy and multispectral spectroscopy. Hyperspectral spectroscopy will become more widely adopted for commercial applications on farms as new cheaper sensors are developed and manufactured. These technologies and grain quality applications are summarized in Table 1, and their advantages and limitations are outlined below.Table 1. List of sensor technologies and examples of their applications in evaluating grain quality associated with measuring traits important for on-farm applications.
| Sensor Type | Spectral Range (nm) | Application | Product Stage | References | ||||||
|---|---|---|---|---|---|---|---|---|---|---|
| Digital camera (benchtop) |
RGB | 1 | separation of red vs. white wheat, Fusarium damaged vs. undamaged, high vs. medium vs. low protein | Research | [46] | |||||
| measure grain color, % hard endosperm | Patent | [47] | ||||||||
| gradation of color, whiteness, and hard endosperm of the seed/grain |
Patent | [48] | ||||||||
| measure grain plumpness, density, and volume |
Research | [49][50] | [49,50] | |||||||
| Stereo camera (in-field, mounted cameras) |
RGB | crop height estimation | Research | [51] | ||||||
| wheat canopy structure | Research | [52] | ||||||||
| Near infrared (benchtop) |
900–1600 | variety identification and seed health | Research | [53] | ||||||
| 950–1650 | separation of red vs. white kernels, Fusarium damaged vs. undamaged, high vs. medium vs. low protein | Research | [46] | |||||||
| 1100–2300 | prediction of protein and moisture constituency and grain type classification | Research | [31] | |||||||
| 850–2300 | moisture, protein, oil concentration | Commercial | [54] | |||||||
| Multispectral (benchtop) |
360–950; 8 bands |
characterization of desiccation | Research | [55] | ||||||
| 375–970; 19 bands |
variety identification and seed health | Research | [53] | |||||||
| 375–970; 19 bands |
seed authentication; % adulterated samples | Research | [56] | |||||||
| 360–950; 8 bands |
fungal contamination detection | Research | [57] | |||||||
| 360–950; 8 bands |
identification of the histological origin | Research | [58] | |||||||
| Hyperspectral (in-field point-based) |
405–850; 6 bands 405–850; 6 bands |
assessment of lentil size traits | Research | [32] | ||||||
| classification of defective vs. non-defective field pea | Research | [13] | ||||||||
| 400–1000 350–2500 |
detection and classification of biotic and abiotic stresses in-field; crop yield predictions and mapping |
Research | [19][22][24][39] | [19 | [ | ,22 | 40 | ,24,39 | ] | ,40] |
| Hyperspectral (benchtop) |
400–1000 | seed authentication | Research | [56] | ||||||
| 400–1000 | detection of green vs. normal barley kernels | Research | [59] | |||||||
| 980–2500 | protein in single wheat kernels | Research | [60] | |||||||
| 1000–2500 | sprouting, enzymatic activity | Research | [61] | |||||||
| 375–1050 | micronutrient composition; Ca, Mg, Mo, and Zn in wheat | Research | [62] |