2. Faradaic Electrolysis
It is well known that electrolysis is an electrochemical process that occurs when a direct or pulsed current passes through the electrolytic cell. To perform electrolysis, the electrolytic cell must contain the following essential components:
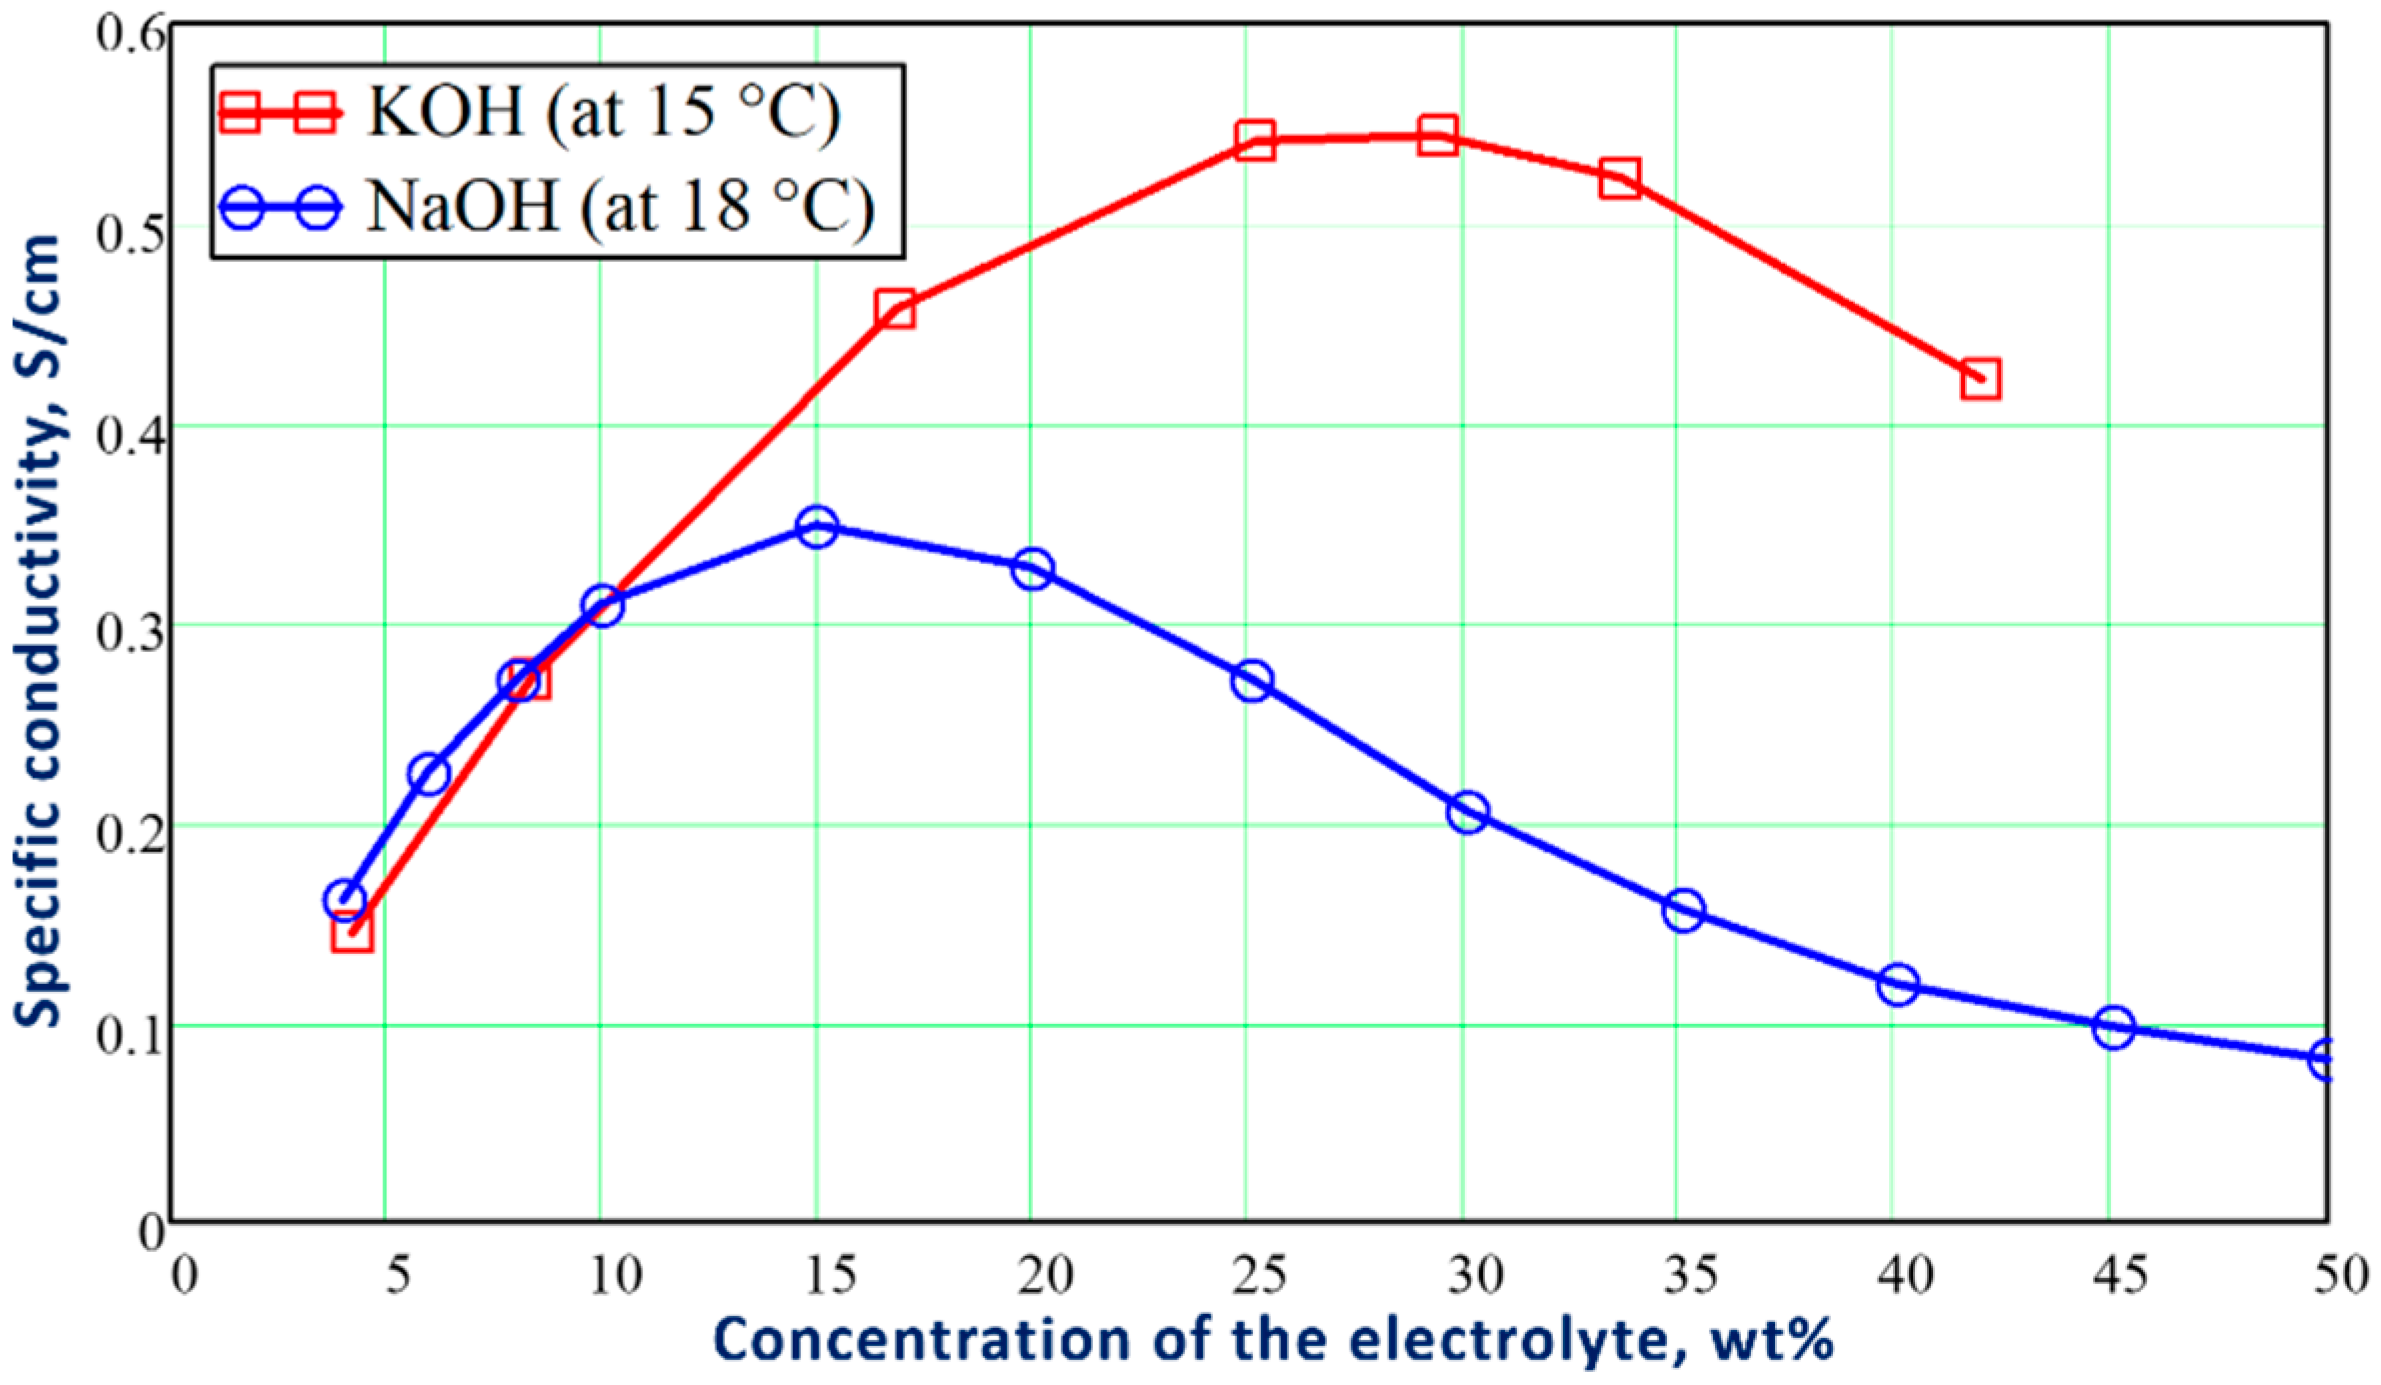
Figure 1 shows the influence of the weight concentration of KOH and NaOH electrolytes on the specific conductivity of their aqueous solutions.
Figure 1. Influence of the weight concentration of KOH and NaOH on the specific conductivity of their aqueous solutions at 15 °C and 18 °C, respectively. The diagram was built based on the tabular data presented in
[11].
According to Kohlrausch’s law of independent ionic migration, both cations and anions contribute to the conductivity of the electrolytic solutions. Thus, the specific conductivity of the electrolytic solutions can be estimated using the following formula
[12]:
To decrease the resistance losses in the electrolytic cell, the electrolyte concentration is selected in the optimal range to have the highest conductivity of the electrolytic solution. For this reason, the optimal range of the concentration for KOH electrolyzers varies between 25–30 wt%
[13].
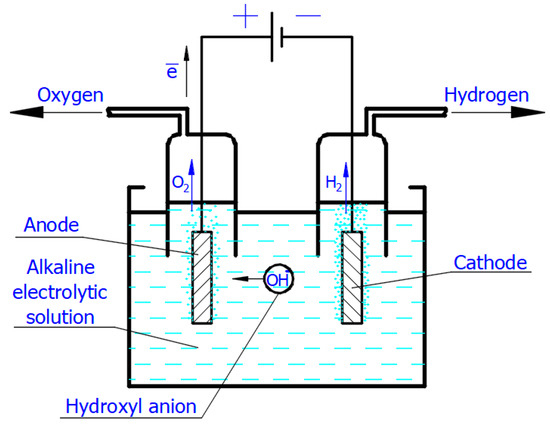
Applying the voltage from the direct current supply to the electrodes immersed in the electrolytic solution causes the motion of free ions (
Figure 2). Thus, in the Faradaic electrolysis of aqueous solutions of hydroxides of active metals situated at the top of the reactivity series of metals (from Cesium Cs to Aluminum Al), at the negative electrode called the
cathode, the reduction reaction of the water molecules with electrons taken from the cathode occurs only to form hydrogen molecules and negatively charged hydroxyl ions
[10]:
Figure 2. Scheme of the simplest alkaline electrolytic cell illustrating production of H2 and O2 according to Equations (2) and (4). The scheme shows only hydroxyl anions participating in the charge transport.
As seen from Equation (2), the cations of active metals do not participate in this electrochemical reaction. However, as recently reported by Monteiro et al.
[14], the metal cations in the electrolytic solution have a significant effect on the activity of the cathode reaction (also known as the hydrogen evolution reaction) occurring on different metallic surfaces.
In the electrolysis of aqueous solutions of hydroxides or salts of metals situated in the middle of the reactivity series of metals (from titanium Ti to lead Pb), in addition to the hydrogen-generating reaction (Equation (2)) at the cathode, the reduction reaction of n-fold positively charged metal ions takes place as well
[12]:
According to Faraday’s first law of electrolysis, the substance mass evolved at the electrode surface in the electrolysis is proportional to the quantity of electric charge passed through the electrolytic solution, i.e.,
[12]:
In the standard conditions (p = 101 325 Pa,
T = 298 K), the decomposition of each mole of water demands a theoretical minimum of electrical energy input of 237.23 kJ, which is known as the change of the standard Gibbs free energy of water (
ΔG). It also demands some external heat input of 48.6 kJ, known as the bound energy (
TΔS), which should be delivered to the electrolytic solution at temperature
T to raise its entropy by
ΔS. Therefore, the water decomposition cannot proceed without supplying the energy of 285.83 kJ per mole of water. This energy is known as the change of the standard enthalpy of water (
ΔH). These thermodynamic functions, such as the change of the enthalpy, Gibbs free energy, and bound energy, are known as the thermodynamic potentials. They are interlinked with each other by the equation
[17]:
However, this value of the standard potential is theoretical, and practically, due to the ohmic losses and other side reactions, the electrolytic cell operates at a certain overpotential. In industrial electrolyzers, the actual potential of the electrolytic cells varies from 1.7 to 2.5 V. This overpotential decreases the energy yield of hydrogen production.
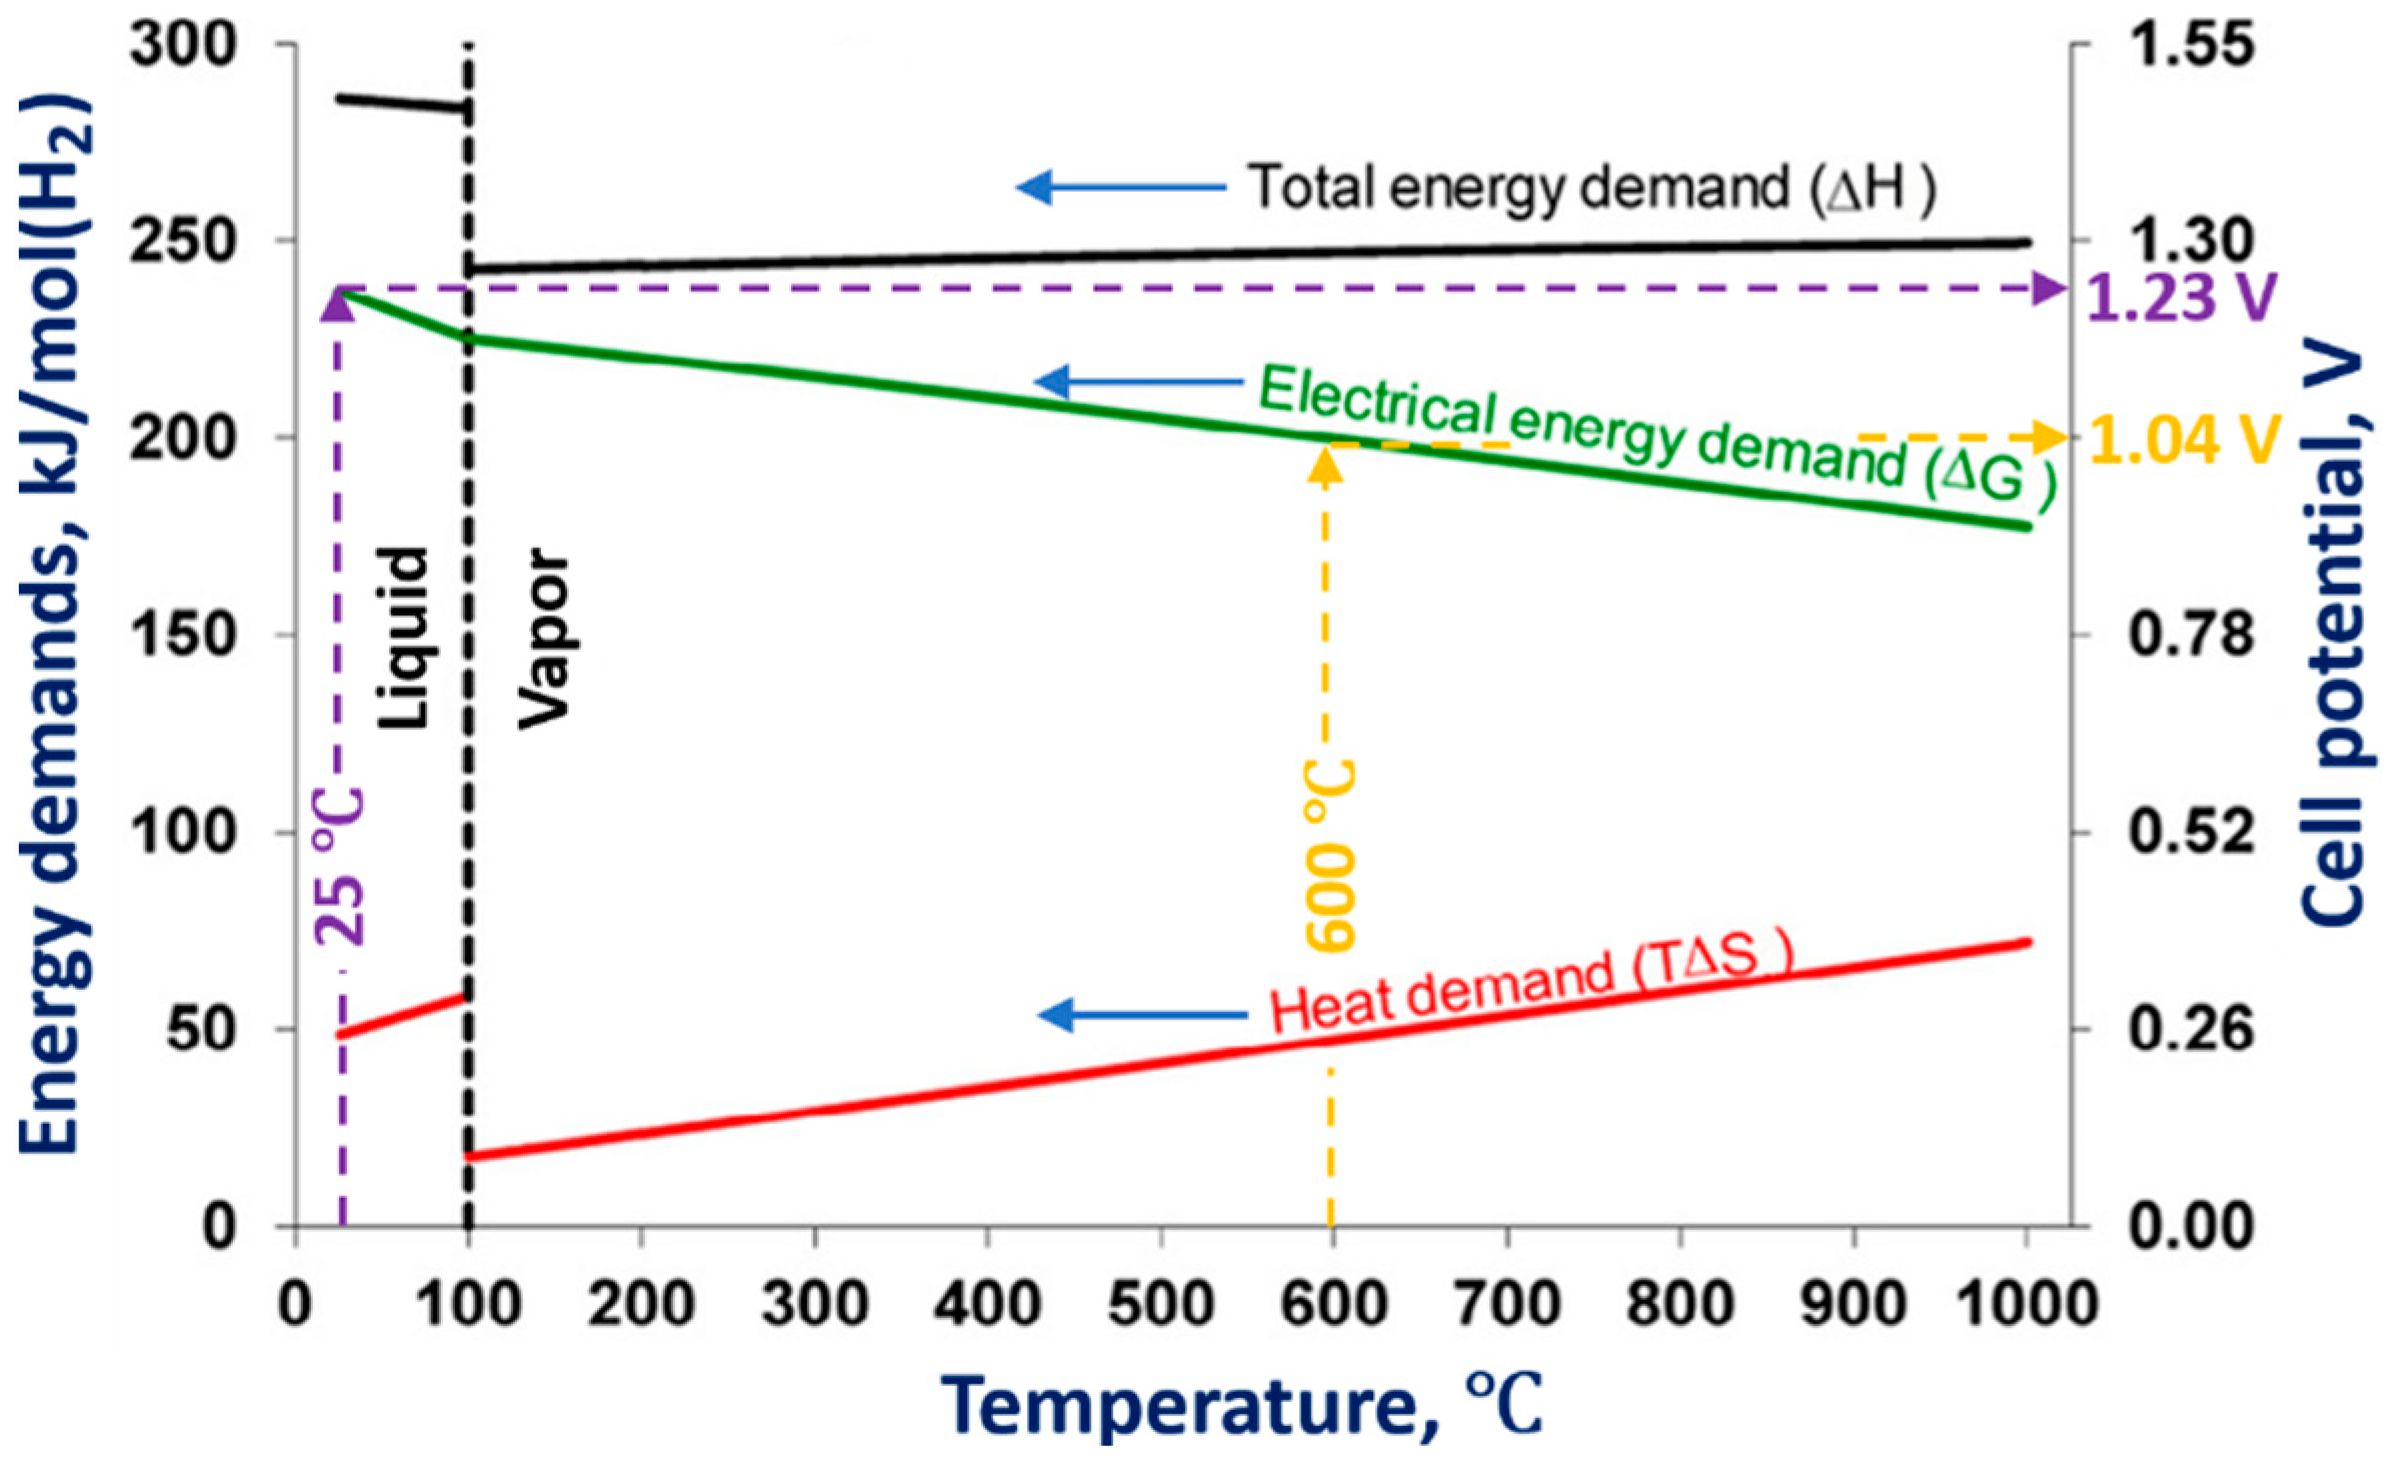
One way to improve the energy yield of hydrogen production is to decrease the electrolytic cell’s overpotential by increasing the electrolytic solution’s temperature. Figure 3 shows the influence of the electrolytic solution temperature on the changes of enthalpy (ΔH), Gibbs free energy (ΔG), and bound energy (TΔS).
Figure 3. Influence of the temperature of the electrolytic solution on the energy demands for water decomposition. Reprinted from
[18] with permission from Elsevier. Changes in the cell potential for 25 °C and 600 °C of the electrolytic solution temperatures are also shown.
As can be seen from Figure 3, an increase in the temperature of the electrolytic solution leads to a decrease in the Gibbs free energy, which results in the decrease in the electrical energy input required to carry out the water decomposition. Performing the electrolysis at an elevated temperature to produce hydrogen is called high-temperature water/steam electrolysis.
At higher temperatures, more expensive electrical energy (attributed to the change of the Gibbs free energy ΔG) needed for the water decomposition can be substituted by less expensive thermal energy (the bound energy TΔS). The thermal energy can be delivered from some waste heat source, which makes the high-temperature water/steam electrolysis attractive from an economic point of view.
Figure 3 also shows values of the cell potentials needed to be applied for the water decomposition at 25 °C and 600 °C. At 25 °C, the cell potential is 1.23 V, whereas at 600 °C, which corresponds to the steam electrolysis, the cell potential is 1.04 V. These values are found as the projections of the intersection points of isotherms (vertical dashed lines in
Figure 3) of 25 °C and 600 °C with the electrical energy demand line (
ΔG) to the cell potential axis (right-hand vertical axis). Practically, in the high-temperature water/steam electrolysis, the potential of the electrolytic cell can be reduced below 1 V
[18][19].
3. Transformation of the Faradaic Electrolysis into PDSE
The Faradaic electrolysis transforms into PDSE with an increased applied voltage that has a value sufficient to ionize the species in the gas–vapor envelope at the electrode, and subsequently, induce the electrical discharge plasma in the envelope.
Regardless of the electric potential polarity, the plasma is formed at the electrode, which its active surface area (immersed in the electrolytic solution) is smaller than that of the other electrode. The electrode at which the plasma is formed is called the
discharge electrode [20]. If the smaller electrode is positively charged (being an anode), the discharge formed around it is called the
anodic glow discharge. If the smaller electrode is negatively charged (being a cathode), the discharge around it is called the
cathodic glow discharge (see
Figure 4). Correspondingly, PDSE is either the anodic or cathodic regime of PDSE. The length of electrodes exposed to the electrolytic solution is called the
active length of the electrodes.
In the anodic and cathodic regimes of PDSE, the plasma around the discharge electrode takes over the role of the positive and negative electrode, respectively, whereas the second electrode (larger one) immersed in the electrolytic solution with no plasma formation acts as a counter electrode. In PDSE, the plasma–liquid interaction allows both electrochemical and plasma-chemical synthesis of the substances
[1][21].
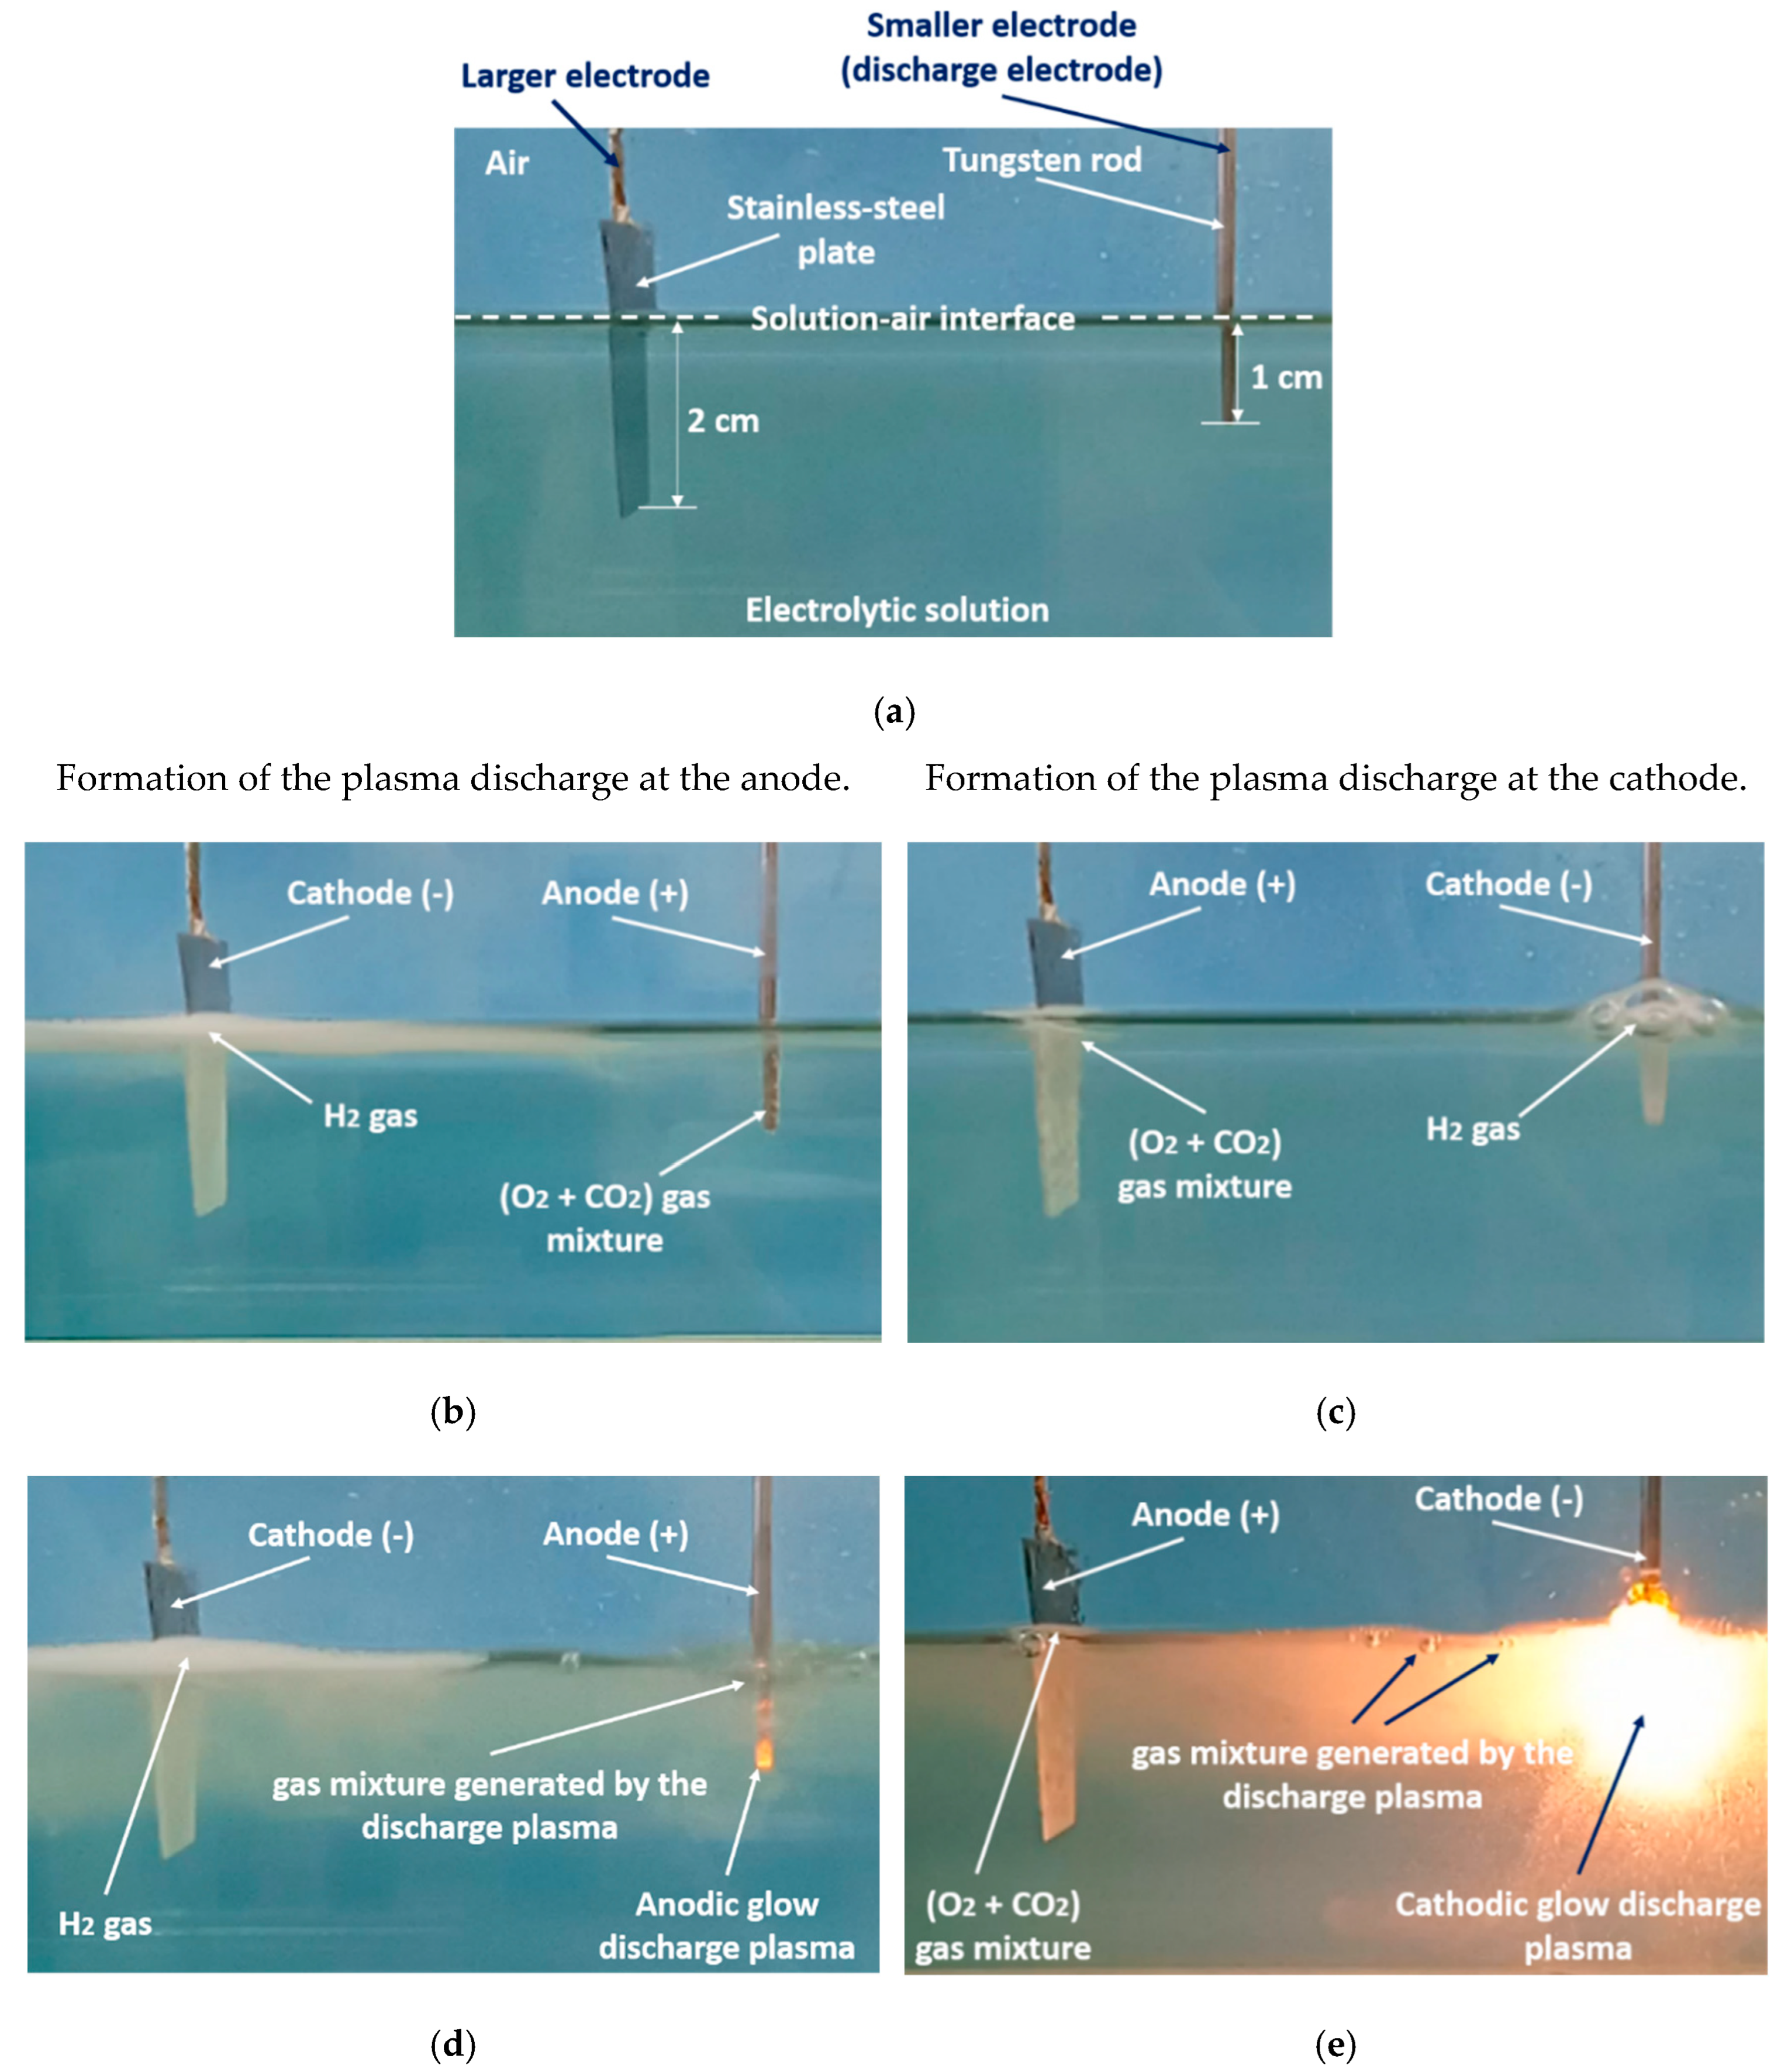
Figure 4a–e illustrates the transformation of the electrolysis from its Faradaic form into PDSE.
Figure 4a shows a typical electrolytic cell with a smaller and a larger electrode for PDSE before applying DC voltage. Figure 4b,d illustrates the formation of PDSE at the anode with the applied voltage, whereas Figure 4c,e illustrates the formation of PDSE at the cathode.
Figure 4b–e confirms that, regardless of the voltage polarity, both glow discharges, the anodic and cathodic, form at the electrode of a smaller active surface area, i.e., at the tungsten rod whose surface area is about 12 times smaller than that of the stainless-steel plate. In the anodic regime of PDSE, the plasma forms a thin layer around the tungsten rod (Figure 4d). The plasma formed in the cathodic regime of PDSE (Figure 4e) occupies a much larger volume around the tungsten rod than that in the anodic regime of PDSE (Figure 4d). This shows that the cathodic regime of PDSE is more efficient for steam generation. The brightness of the cathodic glow discharges is stronger than that of the anodic glow discharges, although the applied voltage is lower in the cathodic regime of PDSE (120 V in the cathodic regime of PDSE versus 130 V in the anodic regime of PDSE).
Sharma et al.
[22] confirmed that the cathodic regime of PDSE can be applied for continuous steam generation with a steam generation efficiency of 80%. Zheng et al.
[23] showed that in the cathodic regime of PDSE, the plasma formed around the discharge electrode is highly negative. The above differences in the microscopic appearance of the anodic and cathodic regimes of PDSE are due to the difference in the mechanisms of the formation of the glow discharges at the anode and cathode.
Figure 4. Transformation of the electrolysis from the Faradaic form into the anodic and cathodic regimes of PDSE with increasing applied voltage: (
a) the electrolytic cell before applying DC voltage, (
b) Faradaic electrolysis at an applied voltage of 20 V (tungsten rod served as an anode), (
c) Faradaic electrolysis at an applied voltage of 20 V (tungsten rod served as a cathode), (
d) the anodic regime of PDSE at the applied voltage of 130 V (discharge onset voltage was 60 V), (
e) the cathodic regime of PDSE at the applied voltage of 120 V (discharge onset voltage was 52 V). The electrolytic solution was 10 wt% Na
2CO
3 water solution at the initial temperature of 22 °C and atmospheric pressure. The electrodes: a stainless-steel plate with a thickness of 0.4 mm and 2 cm × 2cm active surface area exposed to the electrolytic solution and a tungsten rod with a diameter of 2 mm. The active length of the stainless-steel plate was 2 cm. The active length of the tungsten rod was 1 cm. The ratio of the active surface area of the smaller electrode and that of the larger electrode is about 1/12
[24].
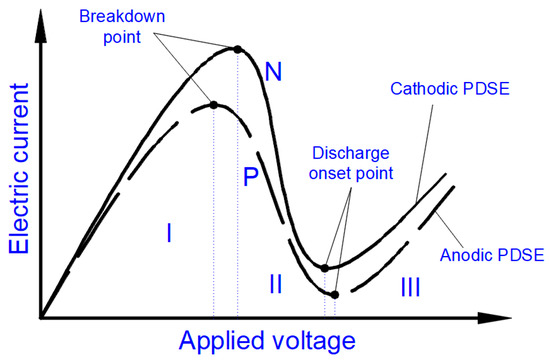
Figure 5 shows typical shapes of the current-voltage characteristics
I(
V) of the electrolysis comprising the Faradaic, transition, and PDSE phases. The current-voltage characteristics are shown for two cases: when the smaller electrode is positively (marked P) or negatively (marked N) charged. The case of a positively charged smaller electrode terminates with the anodic regime of PDSE, whereas the case of a negatively charged smaller electrode terminates with the cathodic regime of PDSE. Although the
I(
V) characteristics differ, they have similar shapes, and each has two extremum points, which divide the electrolysis into three phases (
Figure 5). The first phase (marked I) is the Faradaic electrolysis. It ends at a breakdown point when the Faradaic electrolysis terminates due to the formation of a stable gas–vapor envelope around the discharge electrode due to the coalescence of gas and vapor bubbles. The gas and vapor bubbles are produced by the Faradaic electrolysis and by evaporation of the electrolytic solution, especially at higher electric current densities, causing higher Joule heating. The value of the electric current density at which the Faradaic electrolysis terminates (i.e., at the
breakdown point) depends on the material of the discharge electrode, conductivity of the electrolytic solution, temperature, and surface tension
[1].
Figure 5. A typical shape of the current-voltage characteristics of the electrolysis. The characteristics shown correspond to two cases: positively (P) and negatively (N) charged smaller electrode. The first case terminates with the anodic regime of PDSE. The second terminates with the cathodic regime of PDSE. Voltage regions: I—the Faradaic electrolysis (starting from 0 V and terminating at the breakdown point), II—the transition region (starting from the breakdown point and terminating at the discharge onset point), III—the anodic and cathodic regimes of PDSE (initiating at the discharge onset point). The experimental current-voltage characteristics can be found in
[4][20][23][25][26][27][28][29].
When increasing the applied voltage above the value defined by the breakdown point, the second phase (marked II) appears. In this phase, the thickness of the gas–vapor envelope around the discharge electrode rises, leading to a decrease in the electric current (as seen in
Figure 5) due to the rise in the electrical resistance through the gas and vapor in the envelope. According to the experimental study by Gupta and Singh
[1], the electrical resistance of the gas–vapor envelope surrounding the discharge electrode is about 10 000 Ohms, whereas the electrical resistance of the electrolytic solution is a few orders of magnitude smaller. The applied voltage increasing in the second phase becomes high enough to cause the ionization of the gas–vapor envelope. The second phase ends when the ionization of the gas and vapor in the envelope transfers into the electrical discharge. This is marked on the
I(
V) characteristics by the second extreme point, called the
discharge onset point.
At applied voltages higher than that pointed out by the discharge onset point, the electrolysis’s third phase (marked III) exists. This phase is called PDSE. The second phase is a transition between the first phase (the Faradaic electrolysis) and the third phase (PDSE). The second phase is called the transition phase.
Allagui and Elwakil
[25] revealed that the transition phase of the current-voltage characteristic, recorded at positive and negative
dV/dt (increasing- and decreasing-step voltage sweeps) of the cathodic regime of PDSE, contains hysteresis, which is explained by the transitional appearance/disappearance of the space charge structure, composed of the self-organized gas film on the one hand and the glow-discharge volume surrounding the working electrode on the other.
The second extreme point, named the discharge onset point, indicates the initiation of the electrical discharges within the gas–vapor envelope. That is why the third section of the current-voltage characteristic corresponds to the plasma formation in the electrolytic solution.
As shown in
[30][31][32], the values of the breakdown and discharge onset voltages strongly depend on the conductivity of the electrolytic solution applied. In general, lower specific conductivities of the aqueous electrolytic solutions result in higher values of the breakdown and discharge onset voltages, e.g., the breakdown at the conductivity of the KCl aqueous solution of 5 mS/cm and discharge onset voltages are equal to 270 V and 310 V, respectively. At higher specific conductivities, both voltages significantly decrease. For example, for the conductivity of a KCl aqueous solution of 600 mS/cm, the breakdown and discharge onset voltages are 30 V and 90 V, respectively
[32].
According to the results of the comprehensive investigations carried out by Sengupta et al.
[1][2][3][4][5], the discharge onset voltage also depends on the polarity of PDSE. They found that in the anodic regime of PDSE, the discharge onset voltage was 420 V, whereas in the cathodic regime of PDSE, it was only 160 V in the same aqueous K
2SO
4 electrolytic solution with a 0.05 M concentration. That is why PDSE develops much easier in the cathodic regime than in the anodic regime under the same conditions. The same feature of the plasma formation in the cathodic and anodic regimes of PDSE was observed in another experiment, presented in
Figure 4d,e. In the 10 wt% Na
2CO
3 aqueous solution, the discharge onset voltage was 52 V in the cathodic regime of PDSE, whereas it was 60 V in the anodic regime of PDSE.
4. Physicochemical Processes Occurring in the Cathodic and Anodic Regimes of PDSE
Previous studies
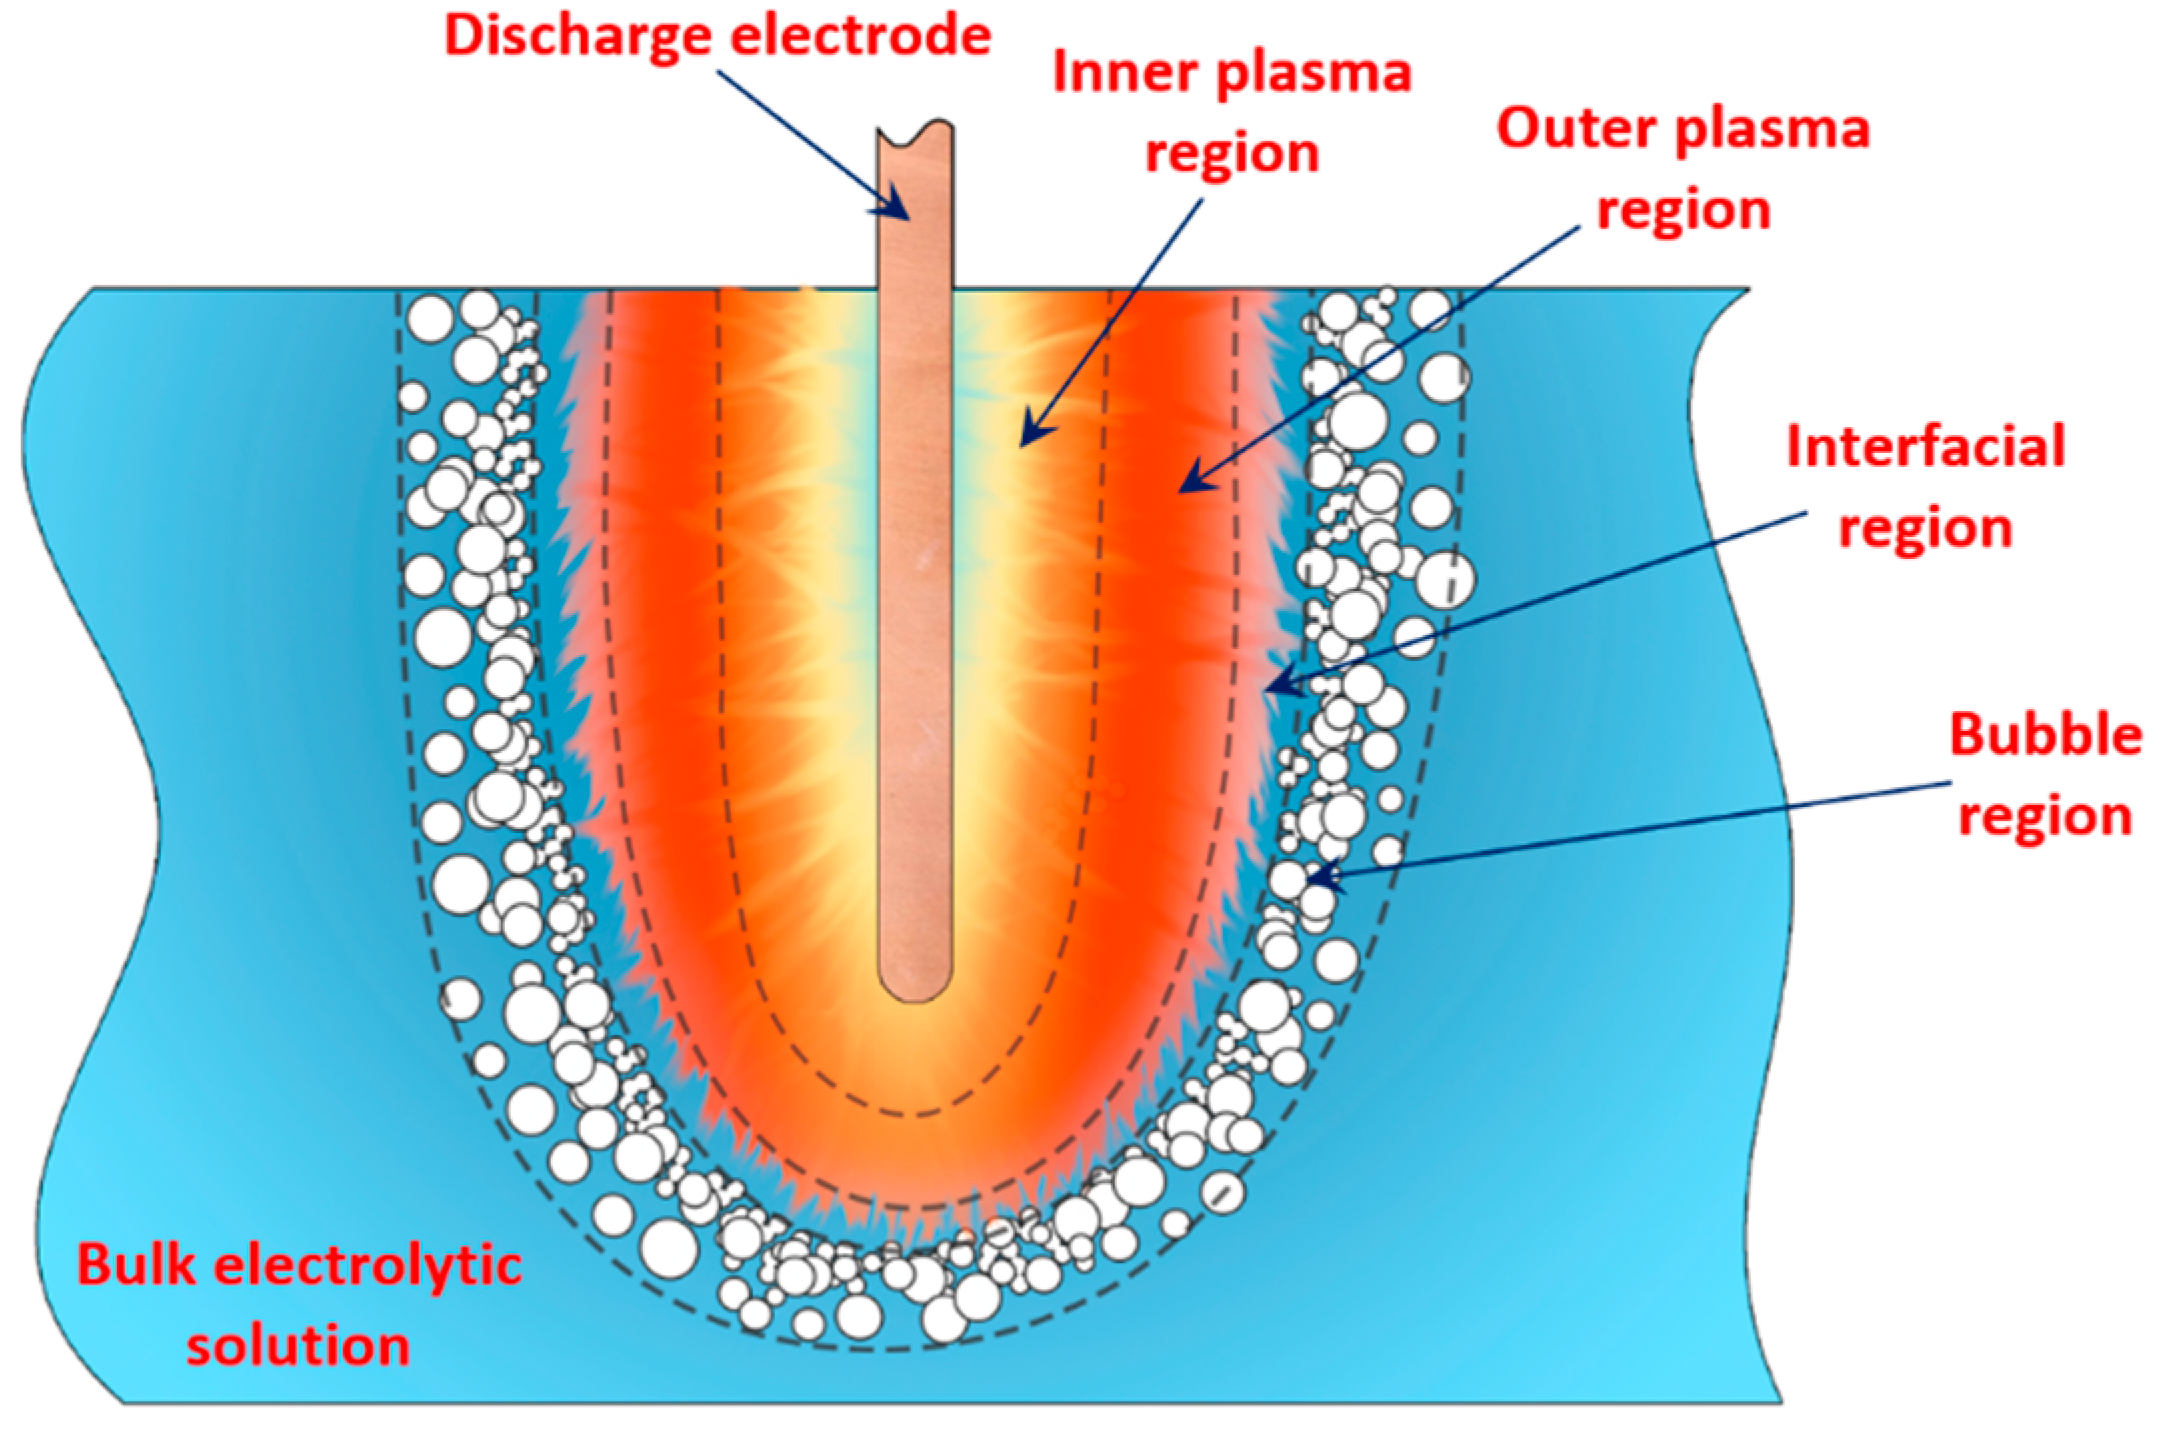
[1][2][3][4][5][33] showed that in PDSE, the total yields (total amount of all substances produced at the discharge electrode) include chemical yields produced according to Faraday’s first law of electrolysis (Equation (6)), called the Faradaic yield (products), and extra amount of substances, the production of which does not obey Equation (6). This extra amount of substances is called the non-Faradaic yield (products). The non-Faradaic yield of the anodic and cathodic regimes of PDSE is derived from two different reaction regions (
Figure 6): i.e., the plasma region around the discharge electrode and the interfacial region (the aqueous electrolytic solution situated close to the plasma interface).
Figure 6. Illustration of the regions at the discharge electrode.
According to Gupta and Singh
[1], at the discharge electrode in the cathodic regime of PDSE, the non-Faradaic yield (extra H
2 yield over the Faradaic yield of H
2, O
2, and H
2O
2 yields) accounts for about 75% of the substances produced in the plasma region and about 25% of the substances produced in the interfacial region (
Figure 6). In contrast to the cathodic regime of PDSE, at the discharge electrode in the anodic regime of PDSE, only about 20% of this extra amount of substances (extra O
2 yield over the Faradaic yield of O
2, H
2, and H
2O
2 yields) are produced in the plasma region, and 80% is derived from the interfacial region.
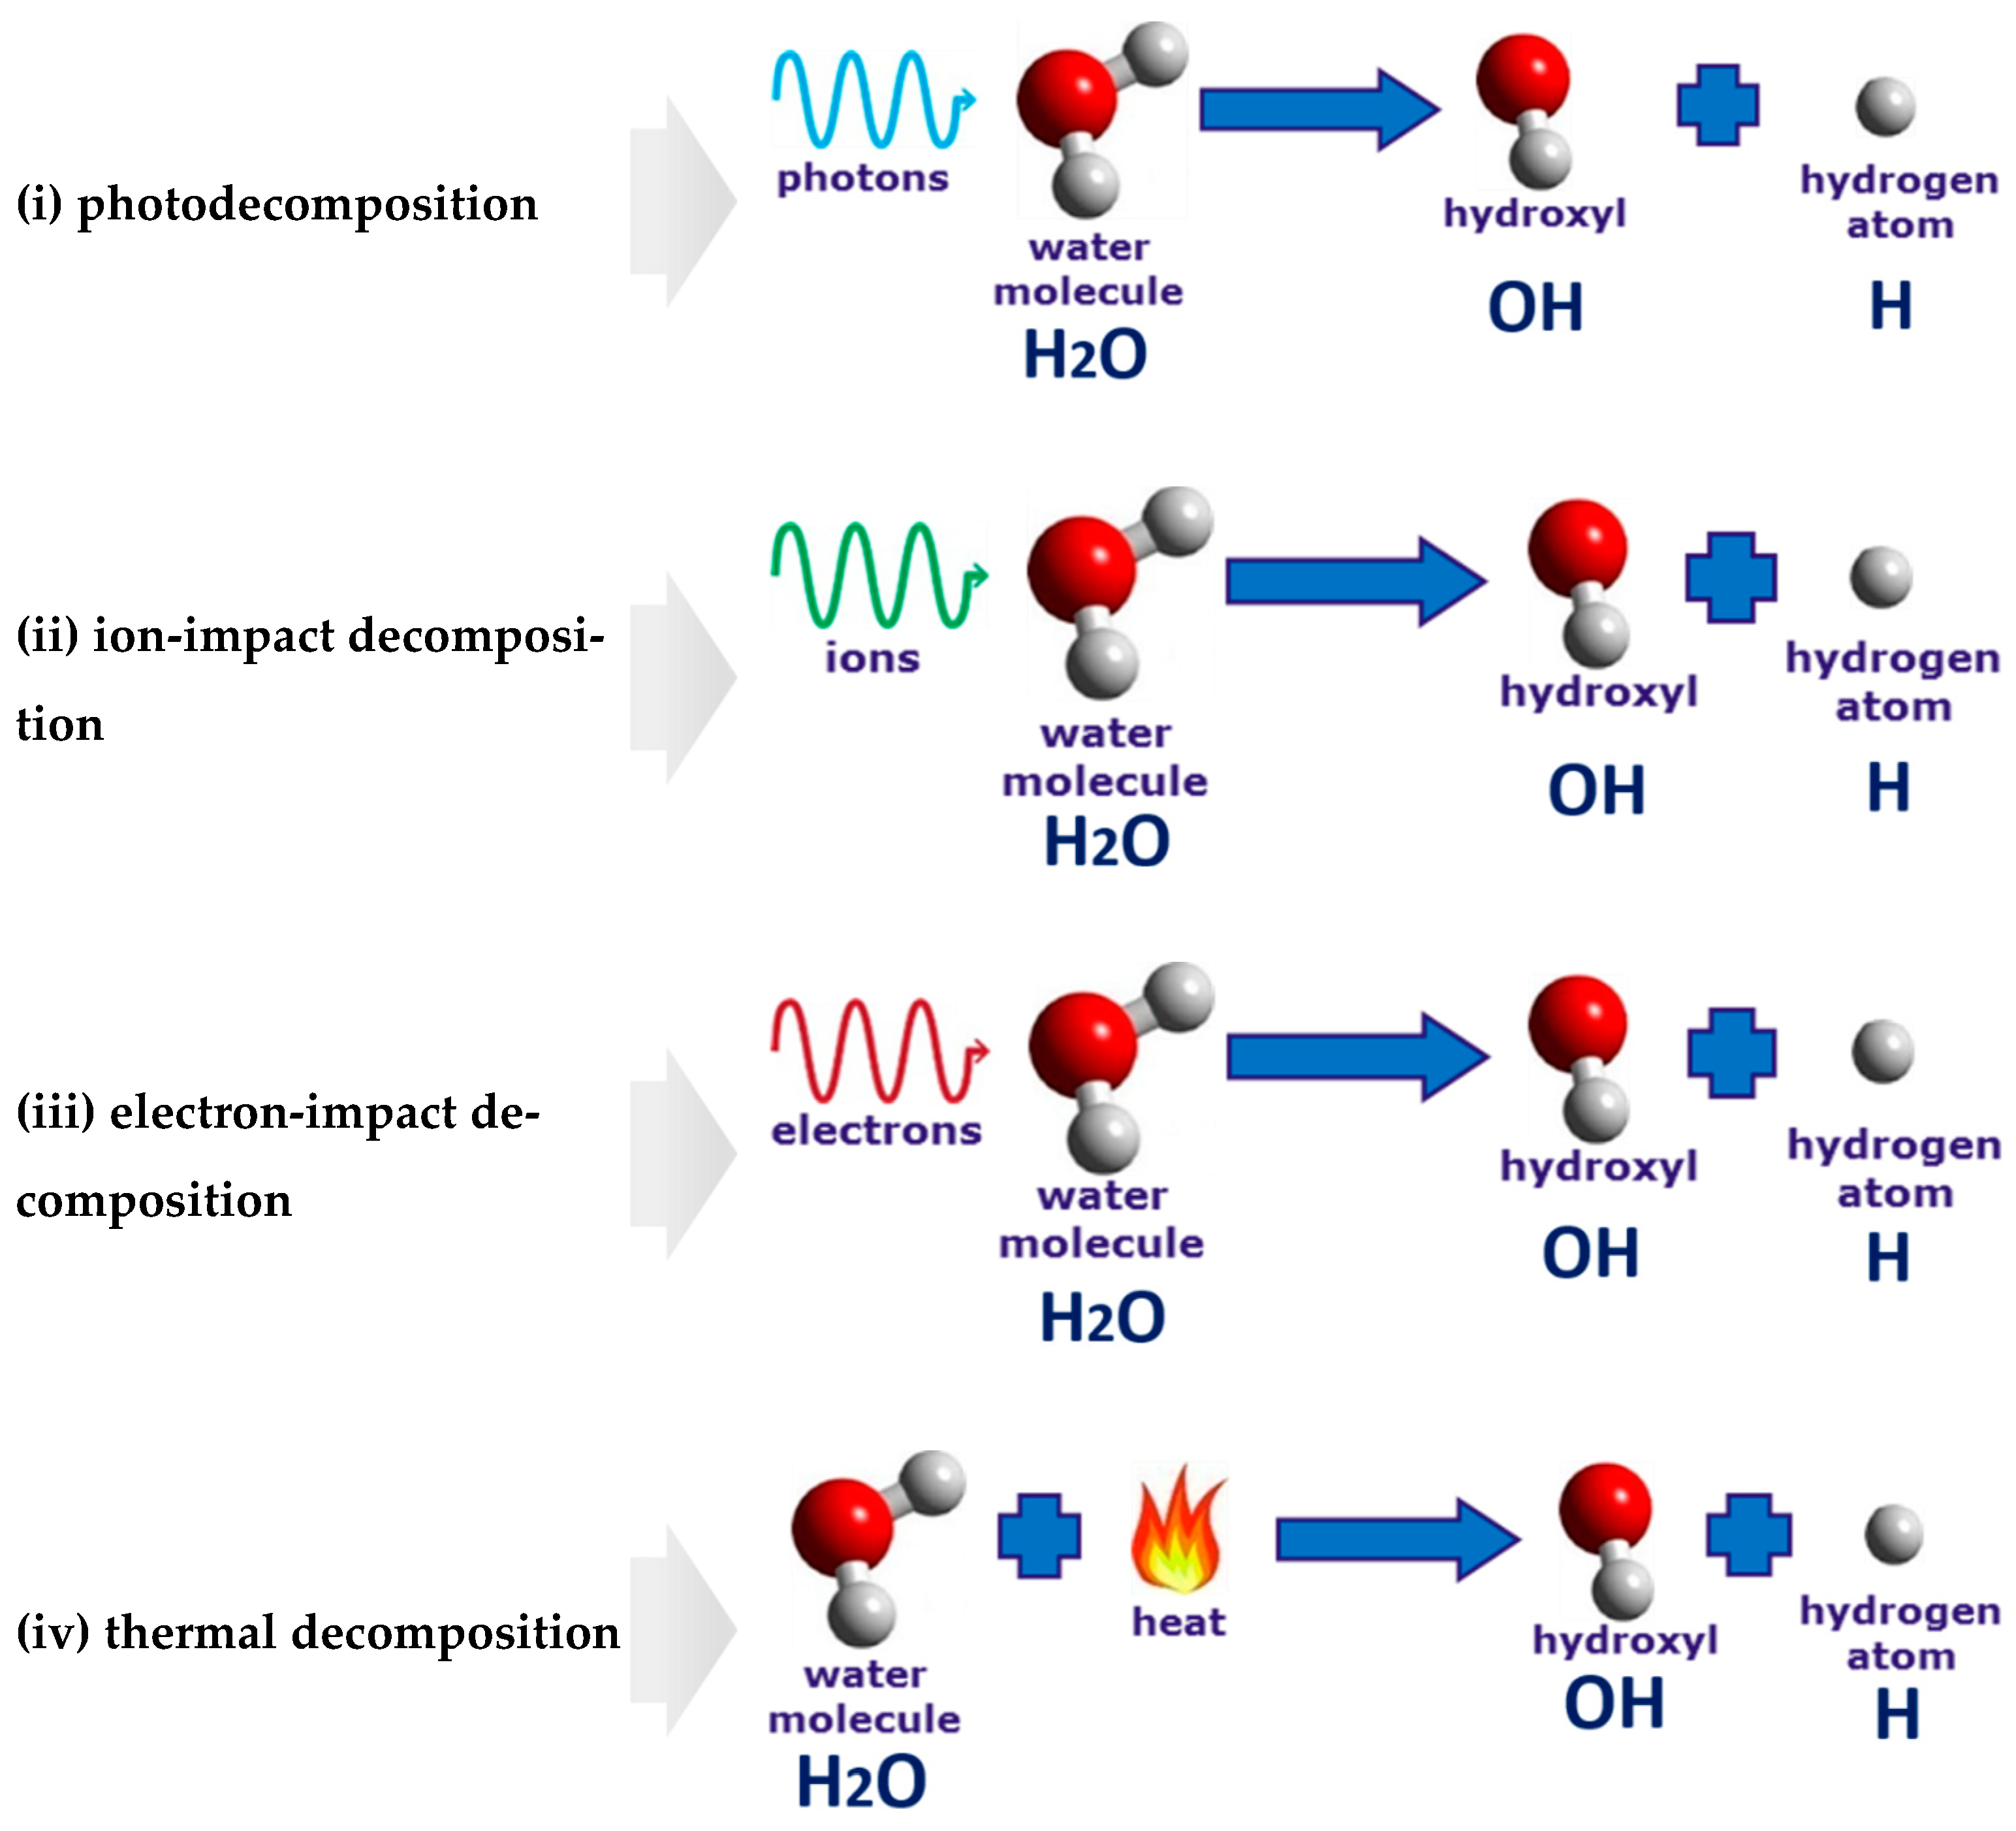
According to
[34][35], four different processes are responsible for the decomposition of the water molecules in the vicinity of the discharge electrode. They are (i) photodecomposition, (ii) ion-impact decomposition, (iii) electron-impact decomposition, and (iv) thermal decomposition (
Figure 7).
Figure 7. Illustration of the four processes leading to the water decomposition in the vicinity of the discharge electrode.
(i) Photodecomposition: The hydrogen production is the same as the water photolysis when the ultraviolet radiation emitted by the discharge plasma breaks up the hydrogen bonds in the water molecule
[36][37].
(ii) Ion-impact decomposition: Ions contribute to the water-vapor decomposition. However, as was shown in
[20], the ion-impact decomposition is less significant for hydrogen production than that of the electron-impact decomposition. However, when colliding with a metal surface of the electrode in the cathodic regime of PDSE, positively charged ions are responsible for promoting the emission of the secondary electrons.
(iii) Electron-impact decomposition: High-energy electrons dissociate water-vapor molecules into hydrogen and hydroxyl radicals. Studying the influence of the discharge polarity on hydrogen production, Zonhcheng Yan et al.
[20] suggested that electrons are more essential species in initiating the water-vapor decomposition than ions.
(iv) Thermal decomposition: The process is similar to direct thermal water decomposition, which occurs at a high-temperature level, usually higher than 2500 K. For instance, at a temperature of 3000 K and a pressure of 1 bar, the degree of the water-vapor decomposition is around 65 vol%
[38][39]. Paulmier et al.
[35] suggested that the thermal dissociative process may play a significant role in PDSE. Thus, at a high temperature, the electrolytic solution near the electrode surface is strongly heated and vaporized; then, the water-vapor is thermally dissociated into hydrogen and oxygen.
4.1. Water-Vapor Decomposition in the Plasma Region
In the plasma around the discharge electrode, one of the mechanisms of the decomposition of water-vapor molecules into H
2 and O
2 molecules is a mechanism observed for the water-vapor decomposition in electrical discharges
[40]. Mededovic and Locke
[41] developed a model of plasma-in-liquid discharges. In this model, the plasma region consists of two subregions: inner and outer. Following up with the model developed by Mededovic and Locke
[41], we may also assume the same subregions surrounding the discharge electrode in PDSE (
Figure 6): an inner subregion, situated close to the discharge electrode with ionizing plasma, which dissociates water into OH
* and H
* radicals by the electron-impact and thermal processes, and an outer subregion, situated close to the plasma interface, in which radicals recombine, producing long-lived molecules such as H
2, O
2, and H
2O
2. The modeling results were confirmed experimentally in
[41]. The set of the corresponding reactions occurring in those two subregions is presented below.
The water-vapor decomposition in the inner plasma subregion follows the reactions
[41][42]:
In the outer plasma subregion, recombination reactions take place, producing hydrogen peroxide H
2O
2, as well as hydrogen H
2 and oxygen O
2 [41]:
4.2. Plasma–Liquid Interaction in the Interfacial Region
Plasma–Liquid Interaction in the Cathodic Regime of PDSE
In the interfacial region (Figure 6), in the liquid-phase reaction zone near the plasma interface, one of the mechanisms responsible for the breakup of liquid H2O molecules into H2, H2O2, and O2 is the radiolysis-based reactions.
As shown by Mota-Lima et al.
[43], in the cathodic regime of PDSE, the ballistic electrons are released from the plasma region into the liquid interfacial region at a rate which can be estimated by the following equation
[43]:
After injection, the ballistic electrons become the hydrated electrons. The penetration depth into the interfacial region constitutes a few nanometers only
[44]. Then, depending on the pH value of the electrolytic solution, the following mechanisms of the hydrogen-producing reactions were proposed
[43]:
In the alkaline electrolytic solution, the water reduction via the self-recombination of the hydrated electrons occurs
[43]:
Plasma–Liquid Interaction in the Anodic Regime of PDSE
In the anodic regime of PDSE, one of the mechanisms of the plasma–liquid interaction follows Hickling’s radiolytic mechanism
[26]. According to this mechanism, each
H2O+gas ion, after acceleration in the steep anode, falls near the interfacial region and is driven into the aqueous electrolytic solution with energies sufficient to break-up liquid water molecules into H* and OH* radicals. Then, the formed radicals diffuse into the bulk of the electrolytic solution, where they undergo several reactions which are known to occur in pulse radiolysis.
The relative importance of the two mechanisms occurring in the plasma region (i.e., bombardment of the interfacial region by
H2O+gas ions) and the interfacial region (i.e., diffusion of
H2O+gas ions into the interfacial region with the subsequent break-up of the liquid water molecules) depends on the magnitude of the applied voltage. At the discharge onset voltage of 420 V, the occurring mechanism is the liquid-phase Hickling’s radiolytic mechanism, accounting for 90% of the non-Faradaic yield. However, with a further rise in voltage, the gas-phase mechanism, described in
[5], becomes increasingly important and, at 500 V, accounts for 75% of the non-Faradaic yield.
For more details on the charge-transfer mechanisms in the anodic regime of PDSE, refer to the recent comprehensive study from Yerokhin et al.
[45].
The Faradaic efficiency of hydrogen production in the plasma-driven solution electrolysis (PDSE), which exceeds 100%, is explained by different, in terms of their nature, reactions occurring in the vicinity of the discharge electrode. The first reaction type is based on the charge transfer. According to Faraday’s first law of electrolysis, hydrogen generation is directly proportional to the electric current passed through the electrolytic solution. In contrast to conventional electrolysis, a second mechanism consists of the gas-phase reactions in the plasma region. A solvent (water) and the organic additives, if any, are evaporated by the intense heating effect of the discharge plasma into the plasma region, where they serve as an additional source of hydrogen. The electron-impact decomposition of molecules in the plasma region is not based on the charge transfer and is non-Faradaic.
The two reaction mechanisms, one in the liquid interfacial region and another in the plasma region, produce hydrogen simultaneously. Therefore, the electron-impact decomposition occurring in the plasma region contributes to the Faradaic efficiency of more than 100%.
Moreover, three additional processes are also responsible for decomposing the water molecules and molecules of organic additives, if any, in the interfacial and plasma regions. They are photodecomposition, ion-impact decomposition, and thermal decomposition. These reaction pathways are not based on the charge transfer and they are non-Faradaic as well.
The actual reactions occurring within the plasma and interfacial regions in the anodic and cathodic regimes of PDSE are much more sophisticated than those shown above. Potential mechanisms of these interactions will be discussed in a future research paper dedicated to the fundamentals of PDSE.
 +1 credit