1. Introduction
Rare earth metals and alloys are increasingly used in the field of new materials, and there is a strong market demand. Rare earth elements have unique physical and chemical properties due to their special electronic structures, such as excellent optical and electrical properties, magnetic properties, and active chemical properties. With the development of modern science and technology, REEs have become indispensable key materials for high-tech and novel functional materials [1][2].
In the process of producing rare earth metals through oxide–fluoride melt system electrolysis, REF3 and LiF form an electrolyte with a low melting point, low density, and high electrical conductivity. Under the action of electrical current, the dissolved RE2O3 is converted to rare earth metals and oxygen at the cathode and anode, respectively. As the electrolysis process progresses, the dissolved RE2O3 in the molten salt is continuously consumed, requiring continuous addition of RE2O3 to maintain a high concentration in the electrolyte [3][4][5]. When the amount of RE2O3 added to the molten salt is lower than its solubility, the electrolysis efficiency and productivity are low. Conversely, if the amount of RE2O3 added to the molten salt exceeds its solubility, the excess RE2O3, being denser than the REF3-LiF melt, tends to form deposits at the bottom of the electrolytic cell, increasing the cell resistance, affecting the metal purity, and even seriously impeding the smooth progress of production [6][7]. Therefore, the solubility of RE2O3 in the REF3-LiF-RE2O3 system provides the essential data for establishing a suitable feeding system in electrolytic production, playing an important role in improving electrolysis efficiency and maintaining the effective volume of the electrolytic cell. However, there have been significant differences in the solubility data of RE2O3 in the fluoride system, and the semi-empirical models developed based on these data have difficulty in accurately predicting the solubility of rare earth oxides [8][9].
2. Nd2O3-NdF-LiF System
Due to the importance of neodymium–iron–boron magnetic materials, there has been an increasing amount of research on the phase equilibrium of the Nd
2O
3-NdF-LiF system, which is relevant to the production of neodymium through molten salt electrolysis
[10][11]. Solubility data of Nd
2O
3 in the NdF
3-LiF system reported in the literature are summarized in
Table 1.
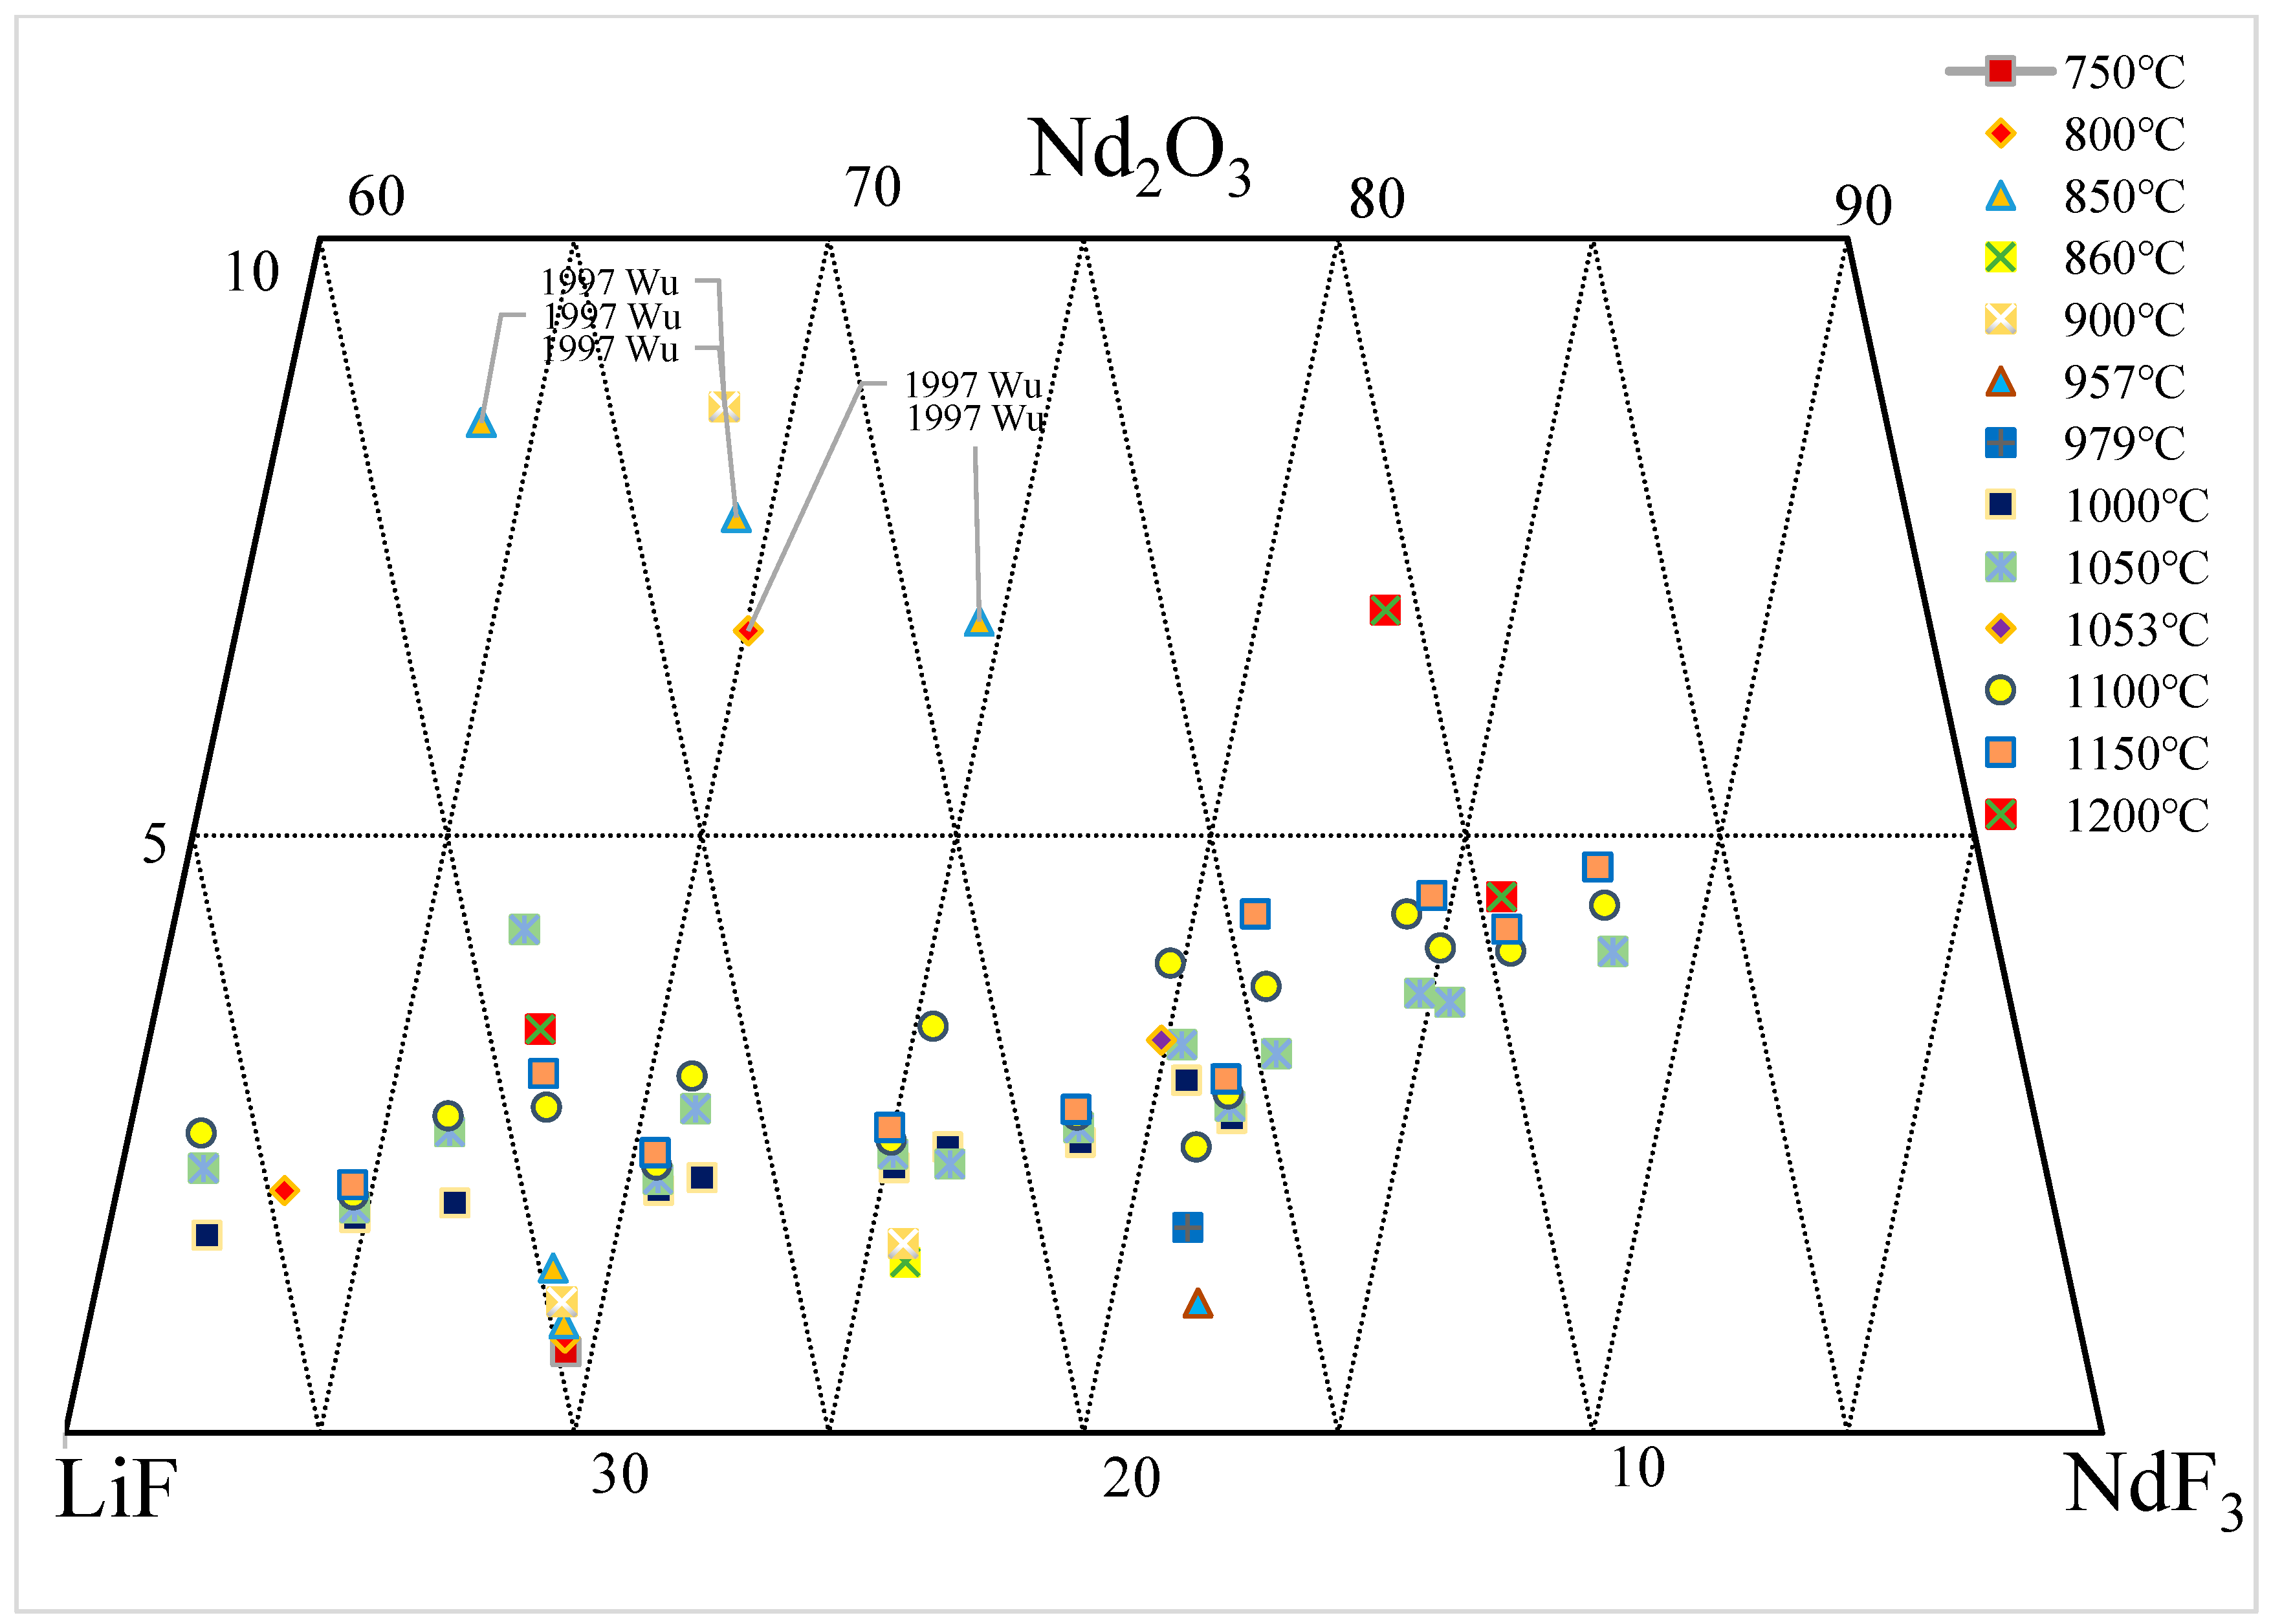
Figure 1 summarizes the solubility data of Nd
2O
3 in the NdF
3-LiF system and annotates these data in the Nd
2O
3-NdF-LiF ternary phase diagram. It can be observed that large amounts of experimental data have been published in the range of 750–1200 °C and 60–90 wt.% NdF
3. In the liquid phase, the concentration of Nd
2O
3 mostly remains below 5 wt.% and increases with the temperature and percentage of NdF
3. However, the solubility data published by Wu et al.
[12] significantly deviate from other data, with a decrease in Nd
2O
3 concentration as NdF
3 increases, indicating the unreliability of these data. The abundance of experimental data shown in
Figure 1 indicates the importance of phase equilibrium research in the Nd
2O
3-NdF-LiF system, both in terms of theoretical significance and practical applications, which has attracted numerous researchers to invest substantial efforts into studying this area. However, there are significant differences and even contradictions among these experimental data
[12][13][14][15][16][17][18][19][20][21][22][23], as detailed in the following two figures.
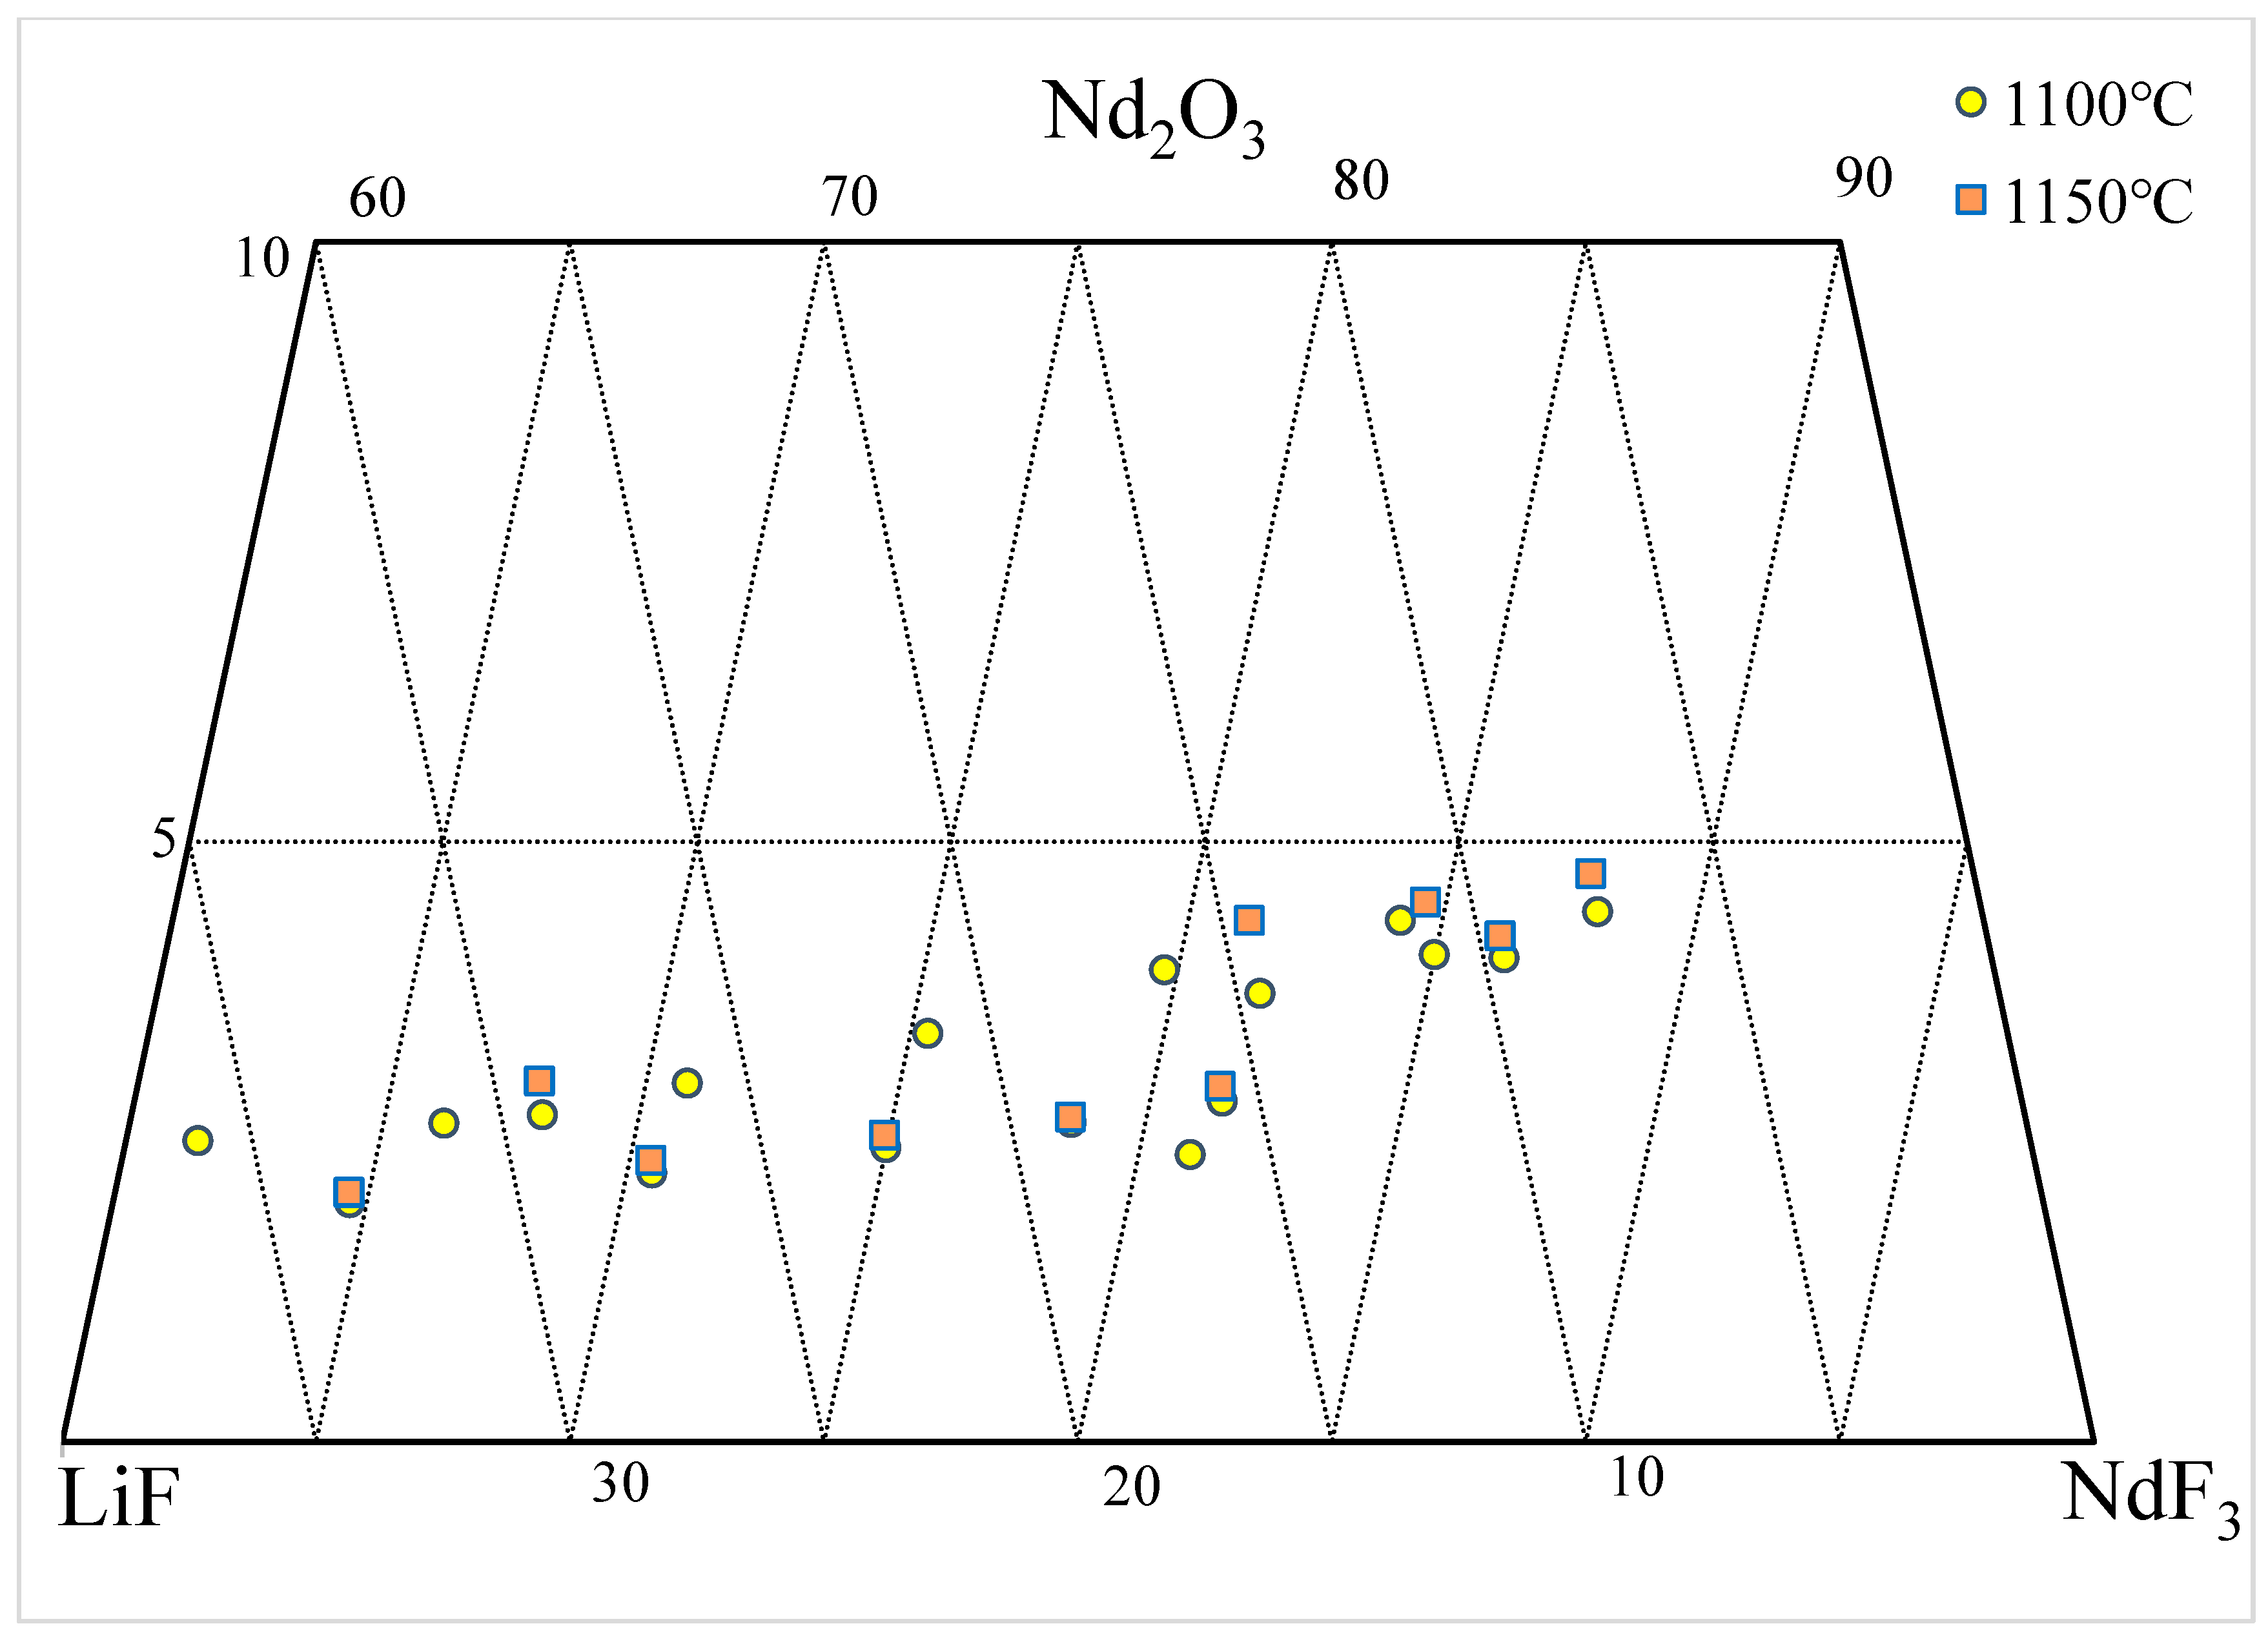
Figure 2 represents the solubility data of Nd2O3 in the NdF3-LiF molten salt at 1100 and 1150 °C, plotted on the ternary phase diagram. According to all the available literature, at the same NdF3/LiF ratio, the solubility of Nd2O3 increases with increasing temperatures, and connecting the solubility data at the same temperature should obtain a smooth liquidus line (isotherm). However, it is difficult to determine a consistent liquidus line at 1100 and 1150 °C, based on the data shown in the figure. Some data points indicate a higher solubility of Nd2O3 at 1100 °C compared with 1150 °C. The estimated 1100 and 1150 °C isotherms are shown in the figure. These contradictory data not only pose challenges for production technicians but also cannot be used for developing thermodynamic databases.
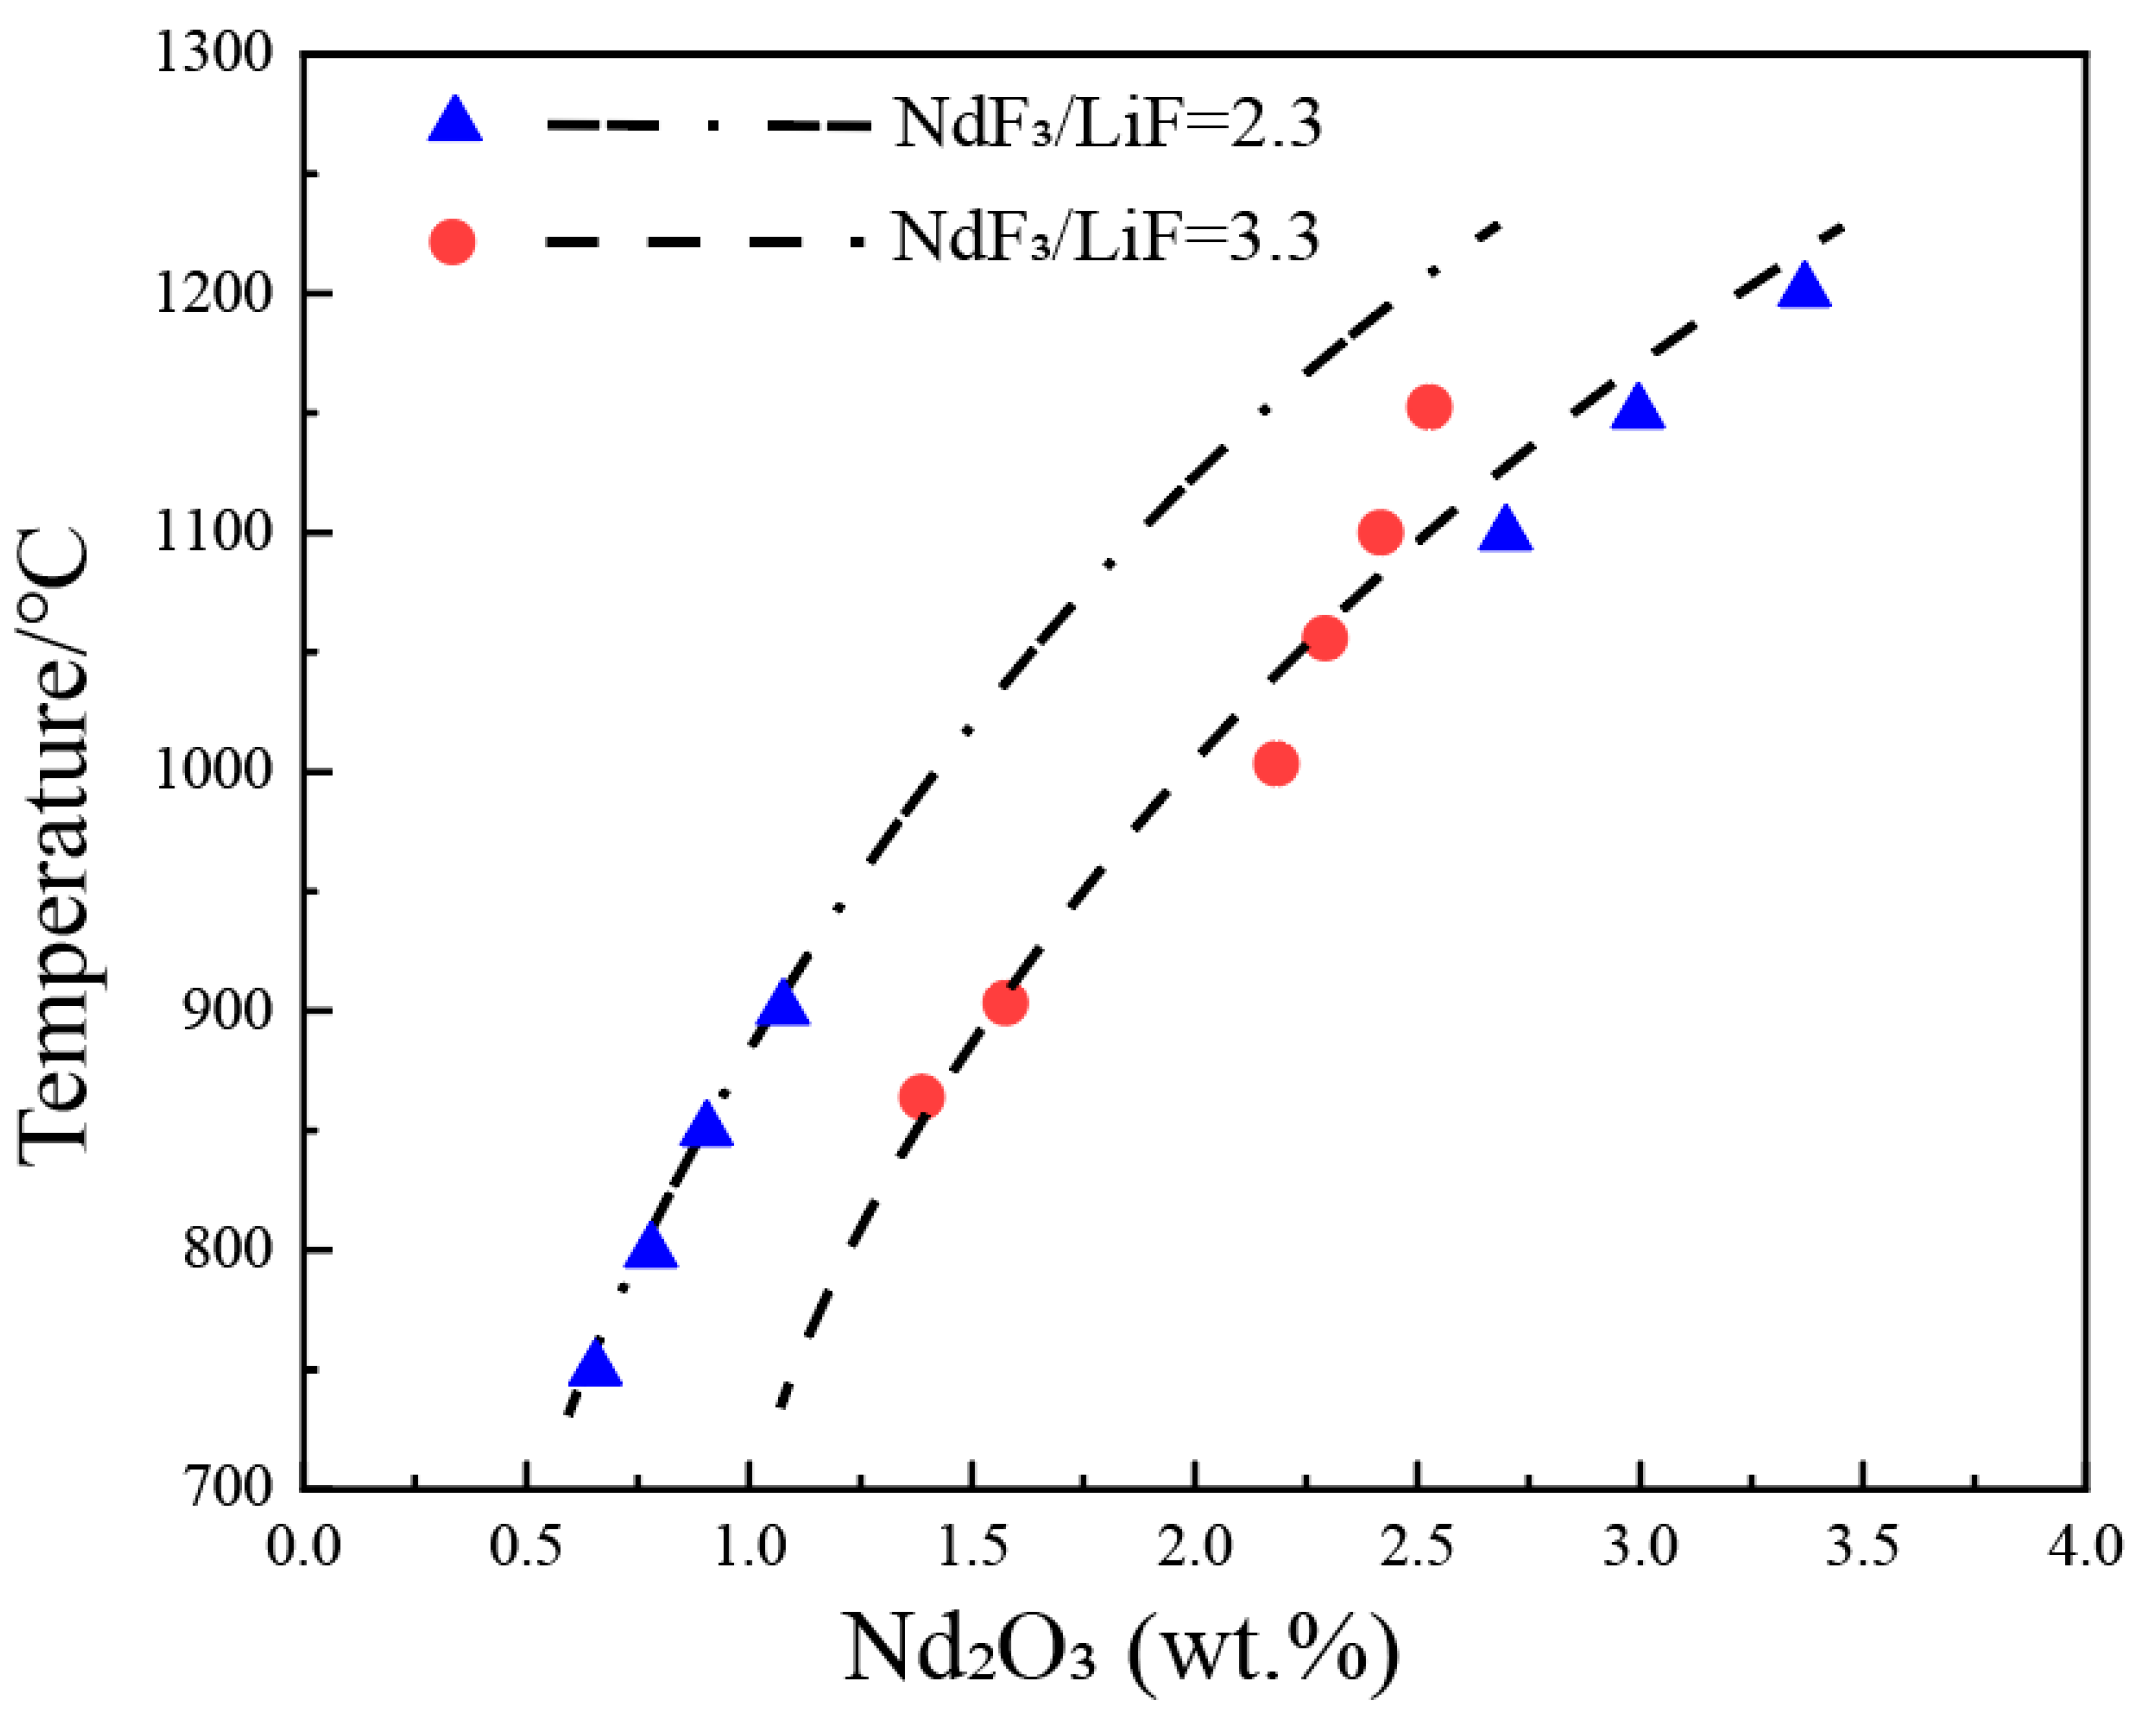
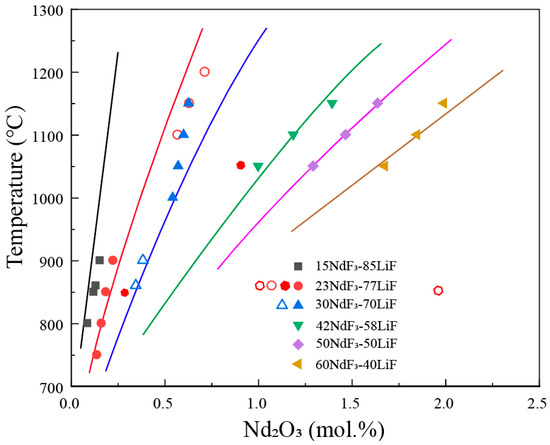
Figure 3 shows the solubility data of Nd2O3 in the NdF3-LiF system on a pseudo-binary phase diagram of Nd2O3-(NdF3 + LiF), with NdF3/LiF ratios of 2.3 and 3.3. It can be observed that the liquidus temperatures increase sharply with an increase in the concentration of Nd2O3. For every 1 wt.% increase in Nd2O3, the liquidus temperature rises by approximately 150 °C. In other words, the solubility of Nd2O3 is not sensitive to temperature, as increasing the temperature by 150 °C only results in a 1 wt.% increment in Nd2O3 solubility. The current consensus in the research is that, at the same temperature, a higher NdF3/LiF ratio leads to a greater solubility of Nd2O3. From the figure, it can be observed that at lower temperatures (800–900 °C), the solubility of Nd2O3 in NdF3/LiF = 3.3 is higher than that in NdF3/LiF = 2.3. However, at higher temperatures (1100–1150 °C), the solubility of Nd2O3 in NdF3/LiF = 3.3 is lower than that in NdF3/LiF = 2.3, indicating a significant discrepancy in the experimental data among different researchers. The dashed lines in the figure represent the estimated liquidus lines corresponding to NdF3/LiF ratios of 2.3 and 3.3, based on the experimental data.
3. La2O3-LaF-LiF System
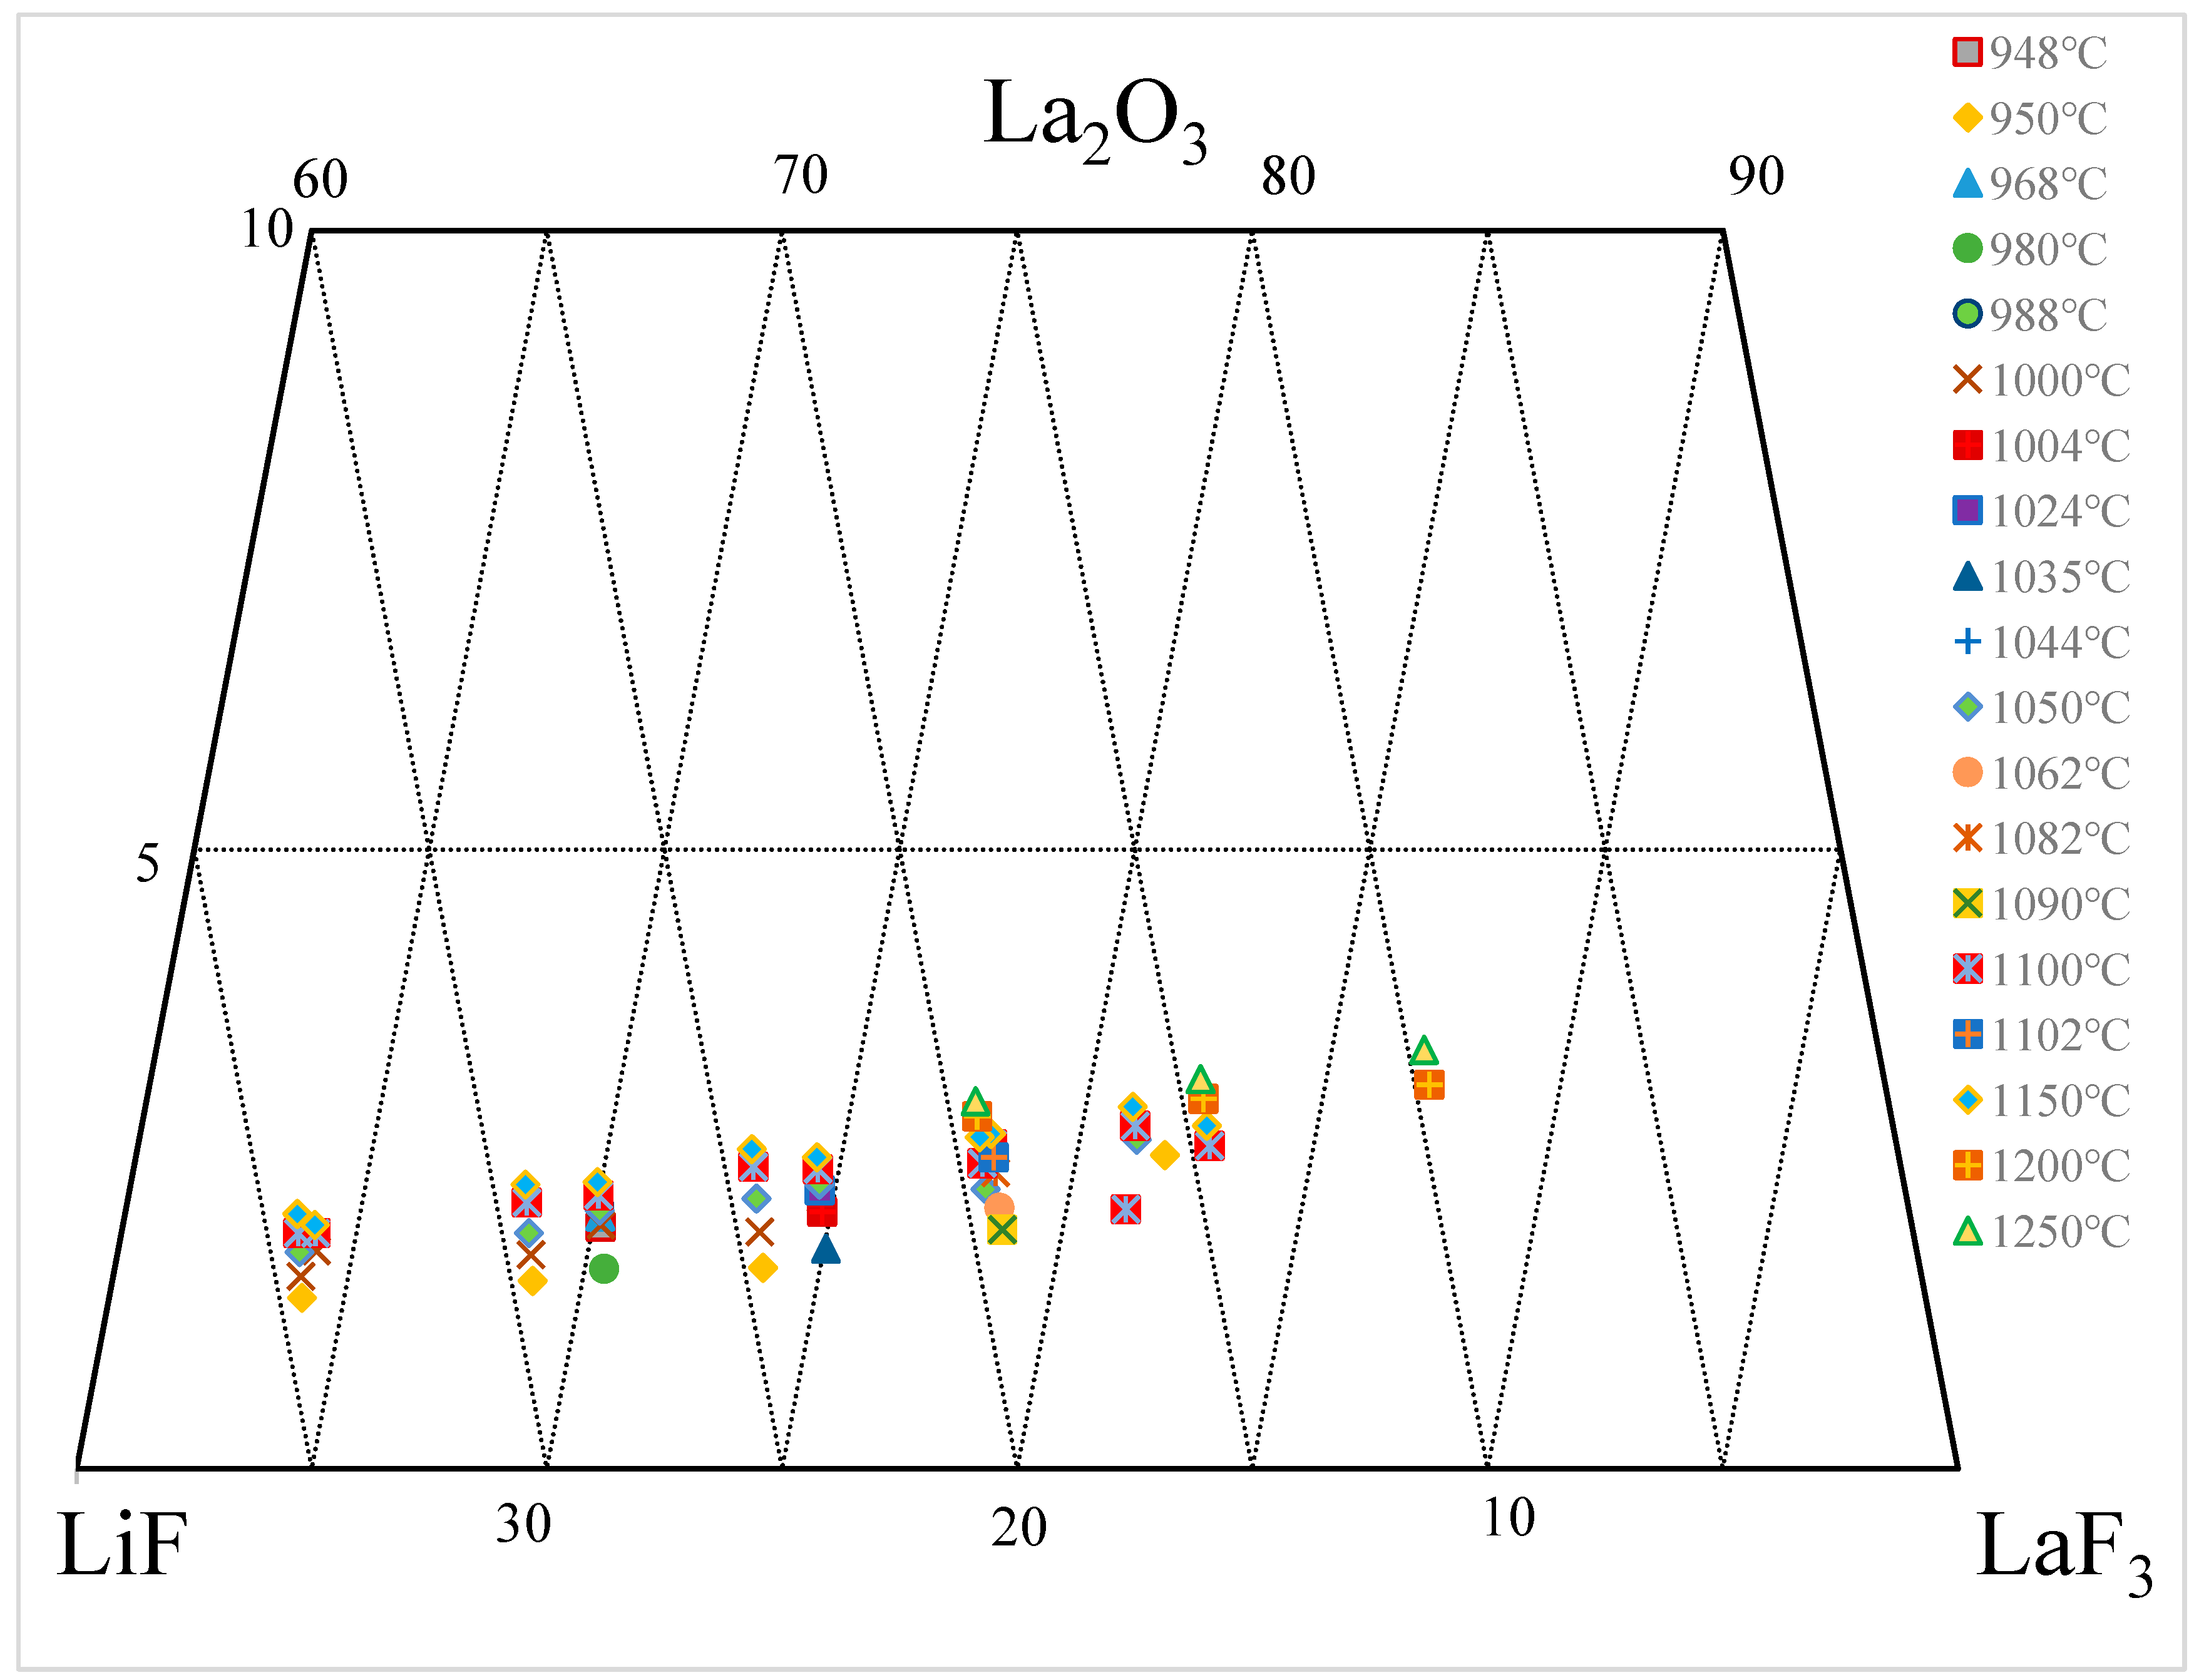
Figure 4 presents the solubility data of La
2O
3 in the LaF
3-LiF system annotated on a ternary phase diagram based on the summary of the literature data shown in
Table 2. Within the range of 948–1250 °C and 60–90 wt.% LaF
3, the solubility of La
2O
3 in the LaF
3-LiF system ranges from 1.3 to 3.4 wt.%. With an increase in temperature and LaF
3, there is a tendency for the solubility of La
2O
3 to increase, but the change is not significant
[14][24][25][26].
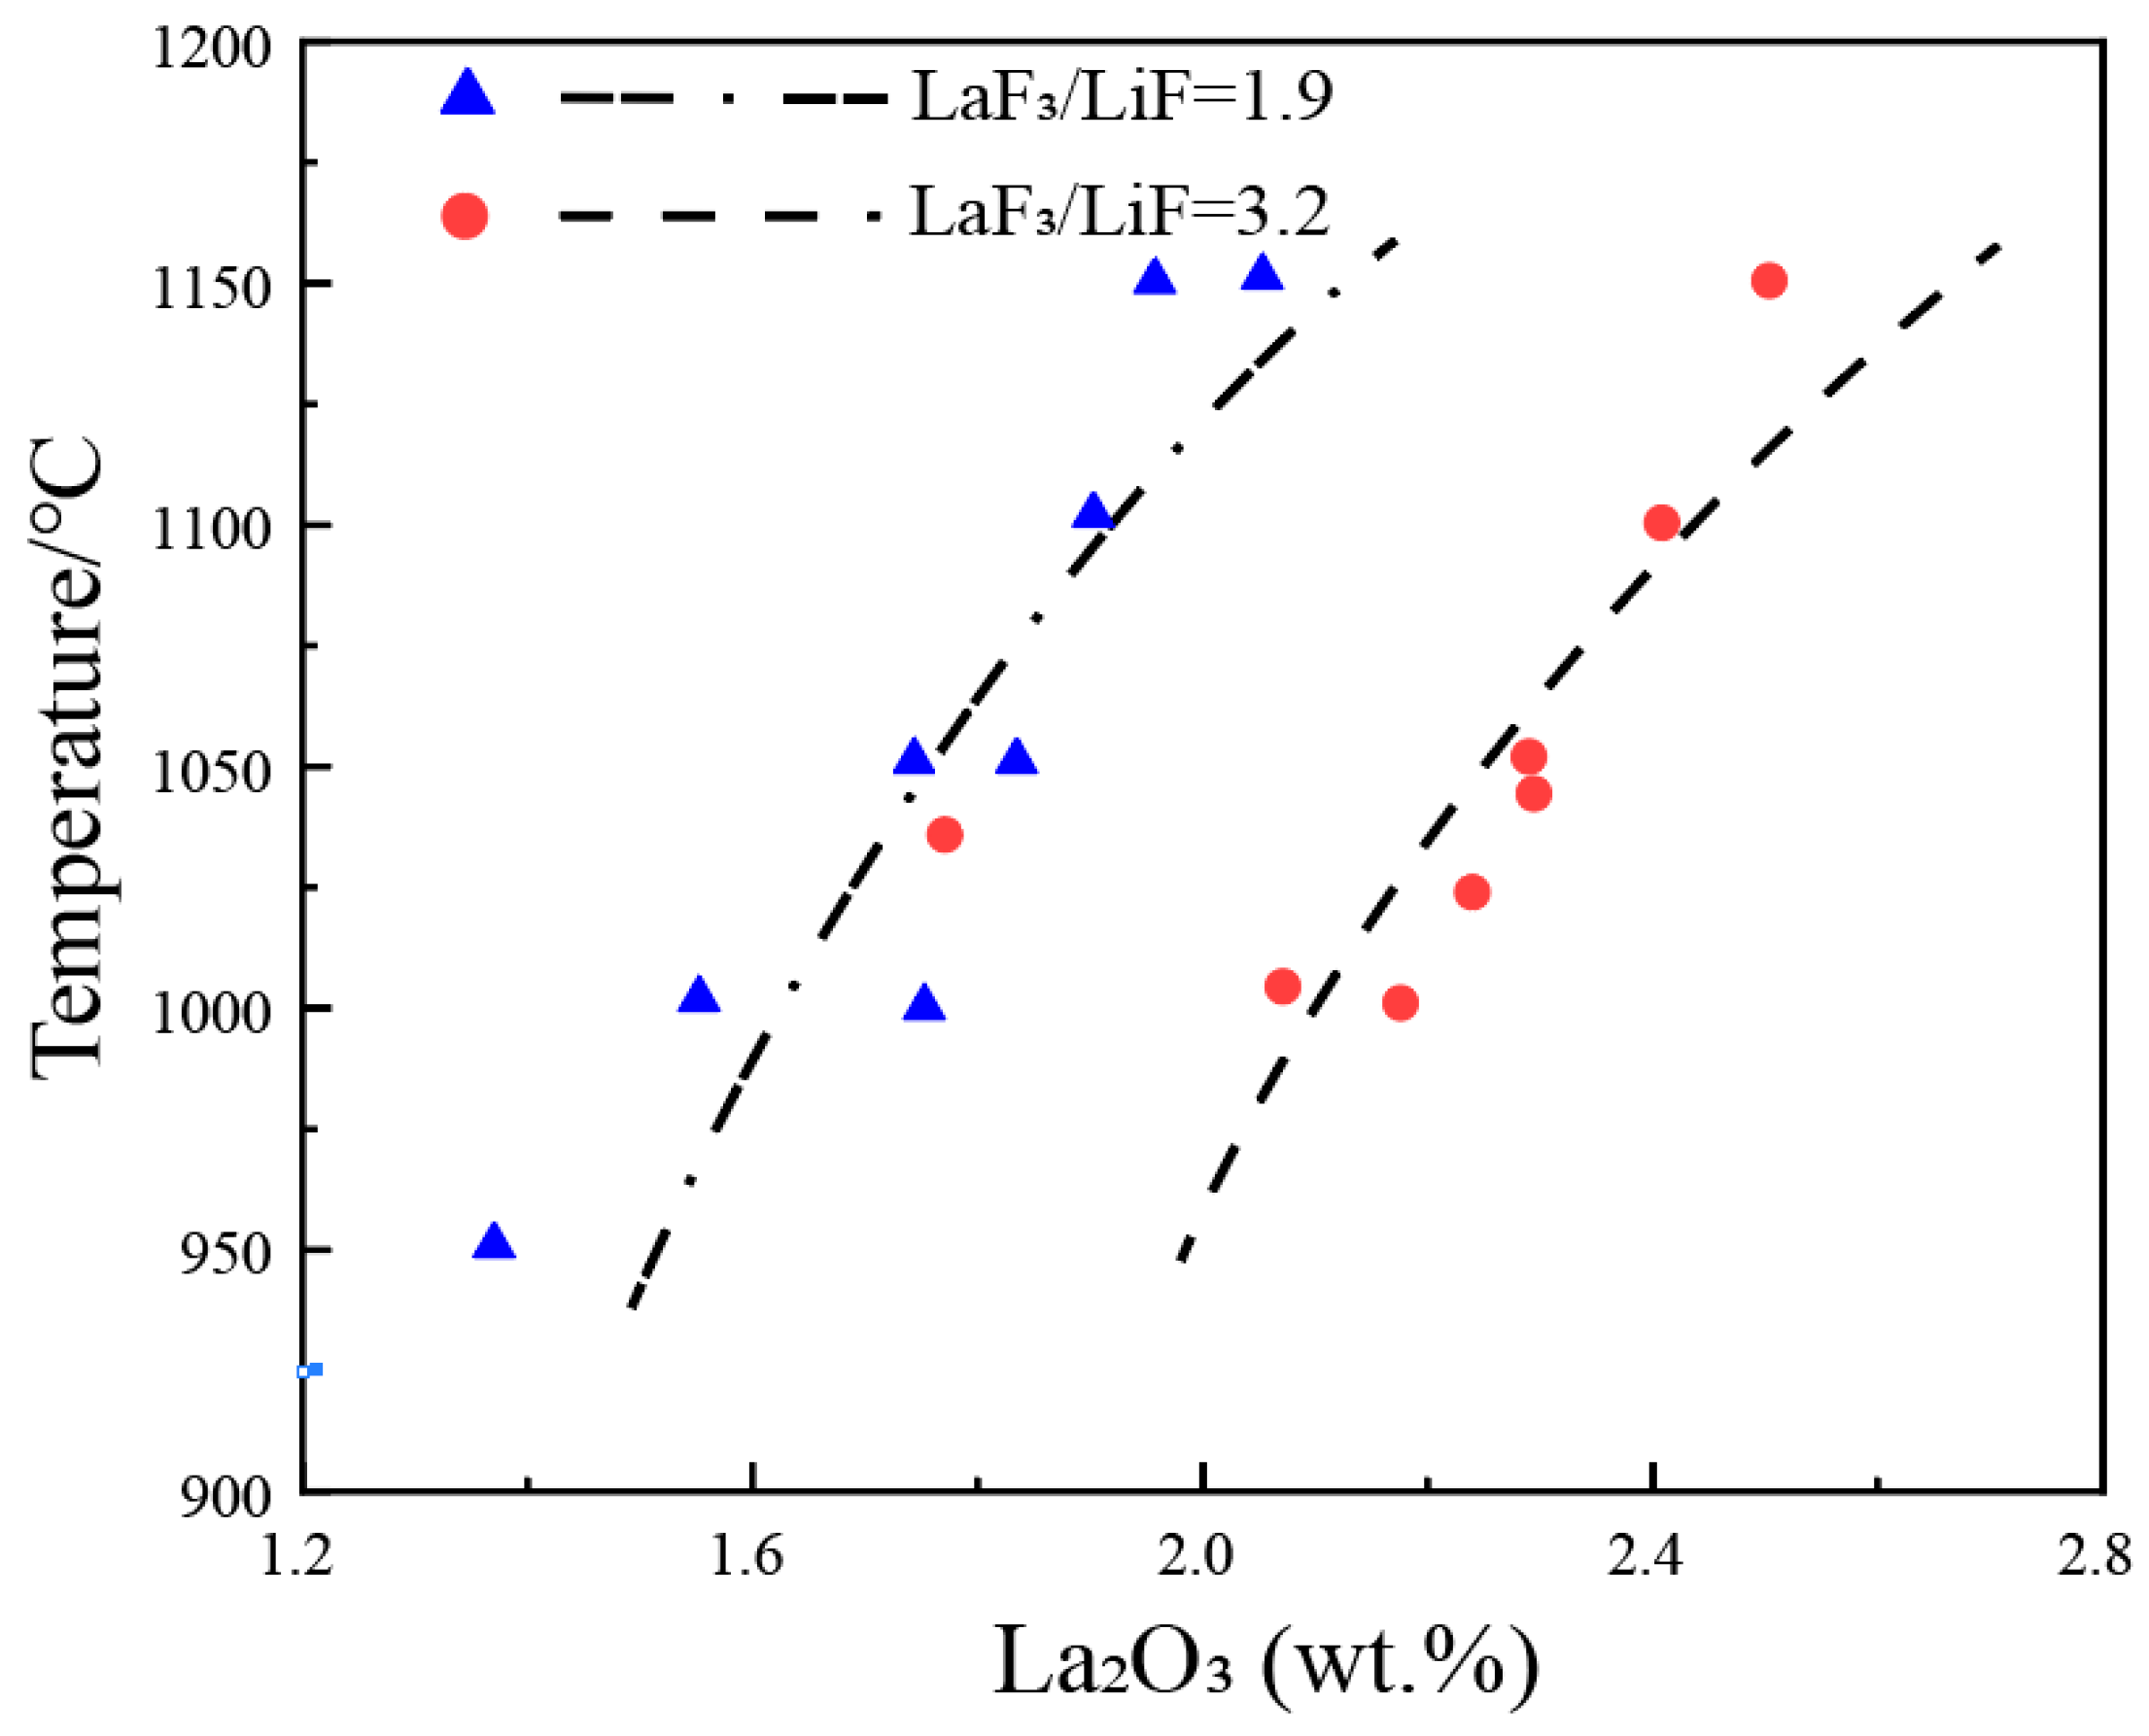
Figure 5 annotates the solubility data of La2O3 on a pseudo-binary phase diagram of La2O3-(LaF3 + LiF), with the LaF3/LiF weight ratios of 1.9 and 3.2. It can be observed that the liquidus temperature increases sharply with an increase in the concentration of La2O3. For every 1 wt.% increase in La2O3 in the melt, the liquidus temperature rises by approximately 300 °C. In other words, the solubility of La2O3 is not sensitive to temperature, as increasing the temperature by 300 °C only results in a 1 wt.% increment in La2O3 solubility. At the same temperature, a higher LaF3/LiF weight ratio leads to a greater solubility of La2O3, but scattered data make it difficult to obtain precise liquidus lines. The dashed lines in the figure represent the estimated liquidus lines corresponding to LaF3/LiF weight ratios of 1.9 and 3.2, based on the experimental data.
4. Y2O3-YF3-LiF System
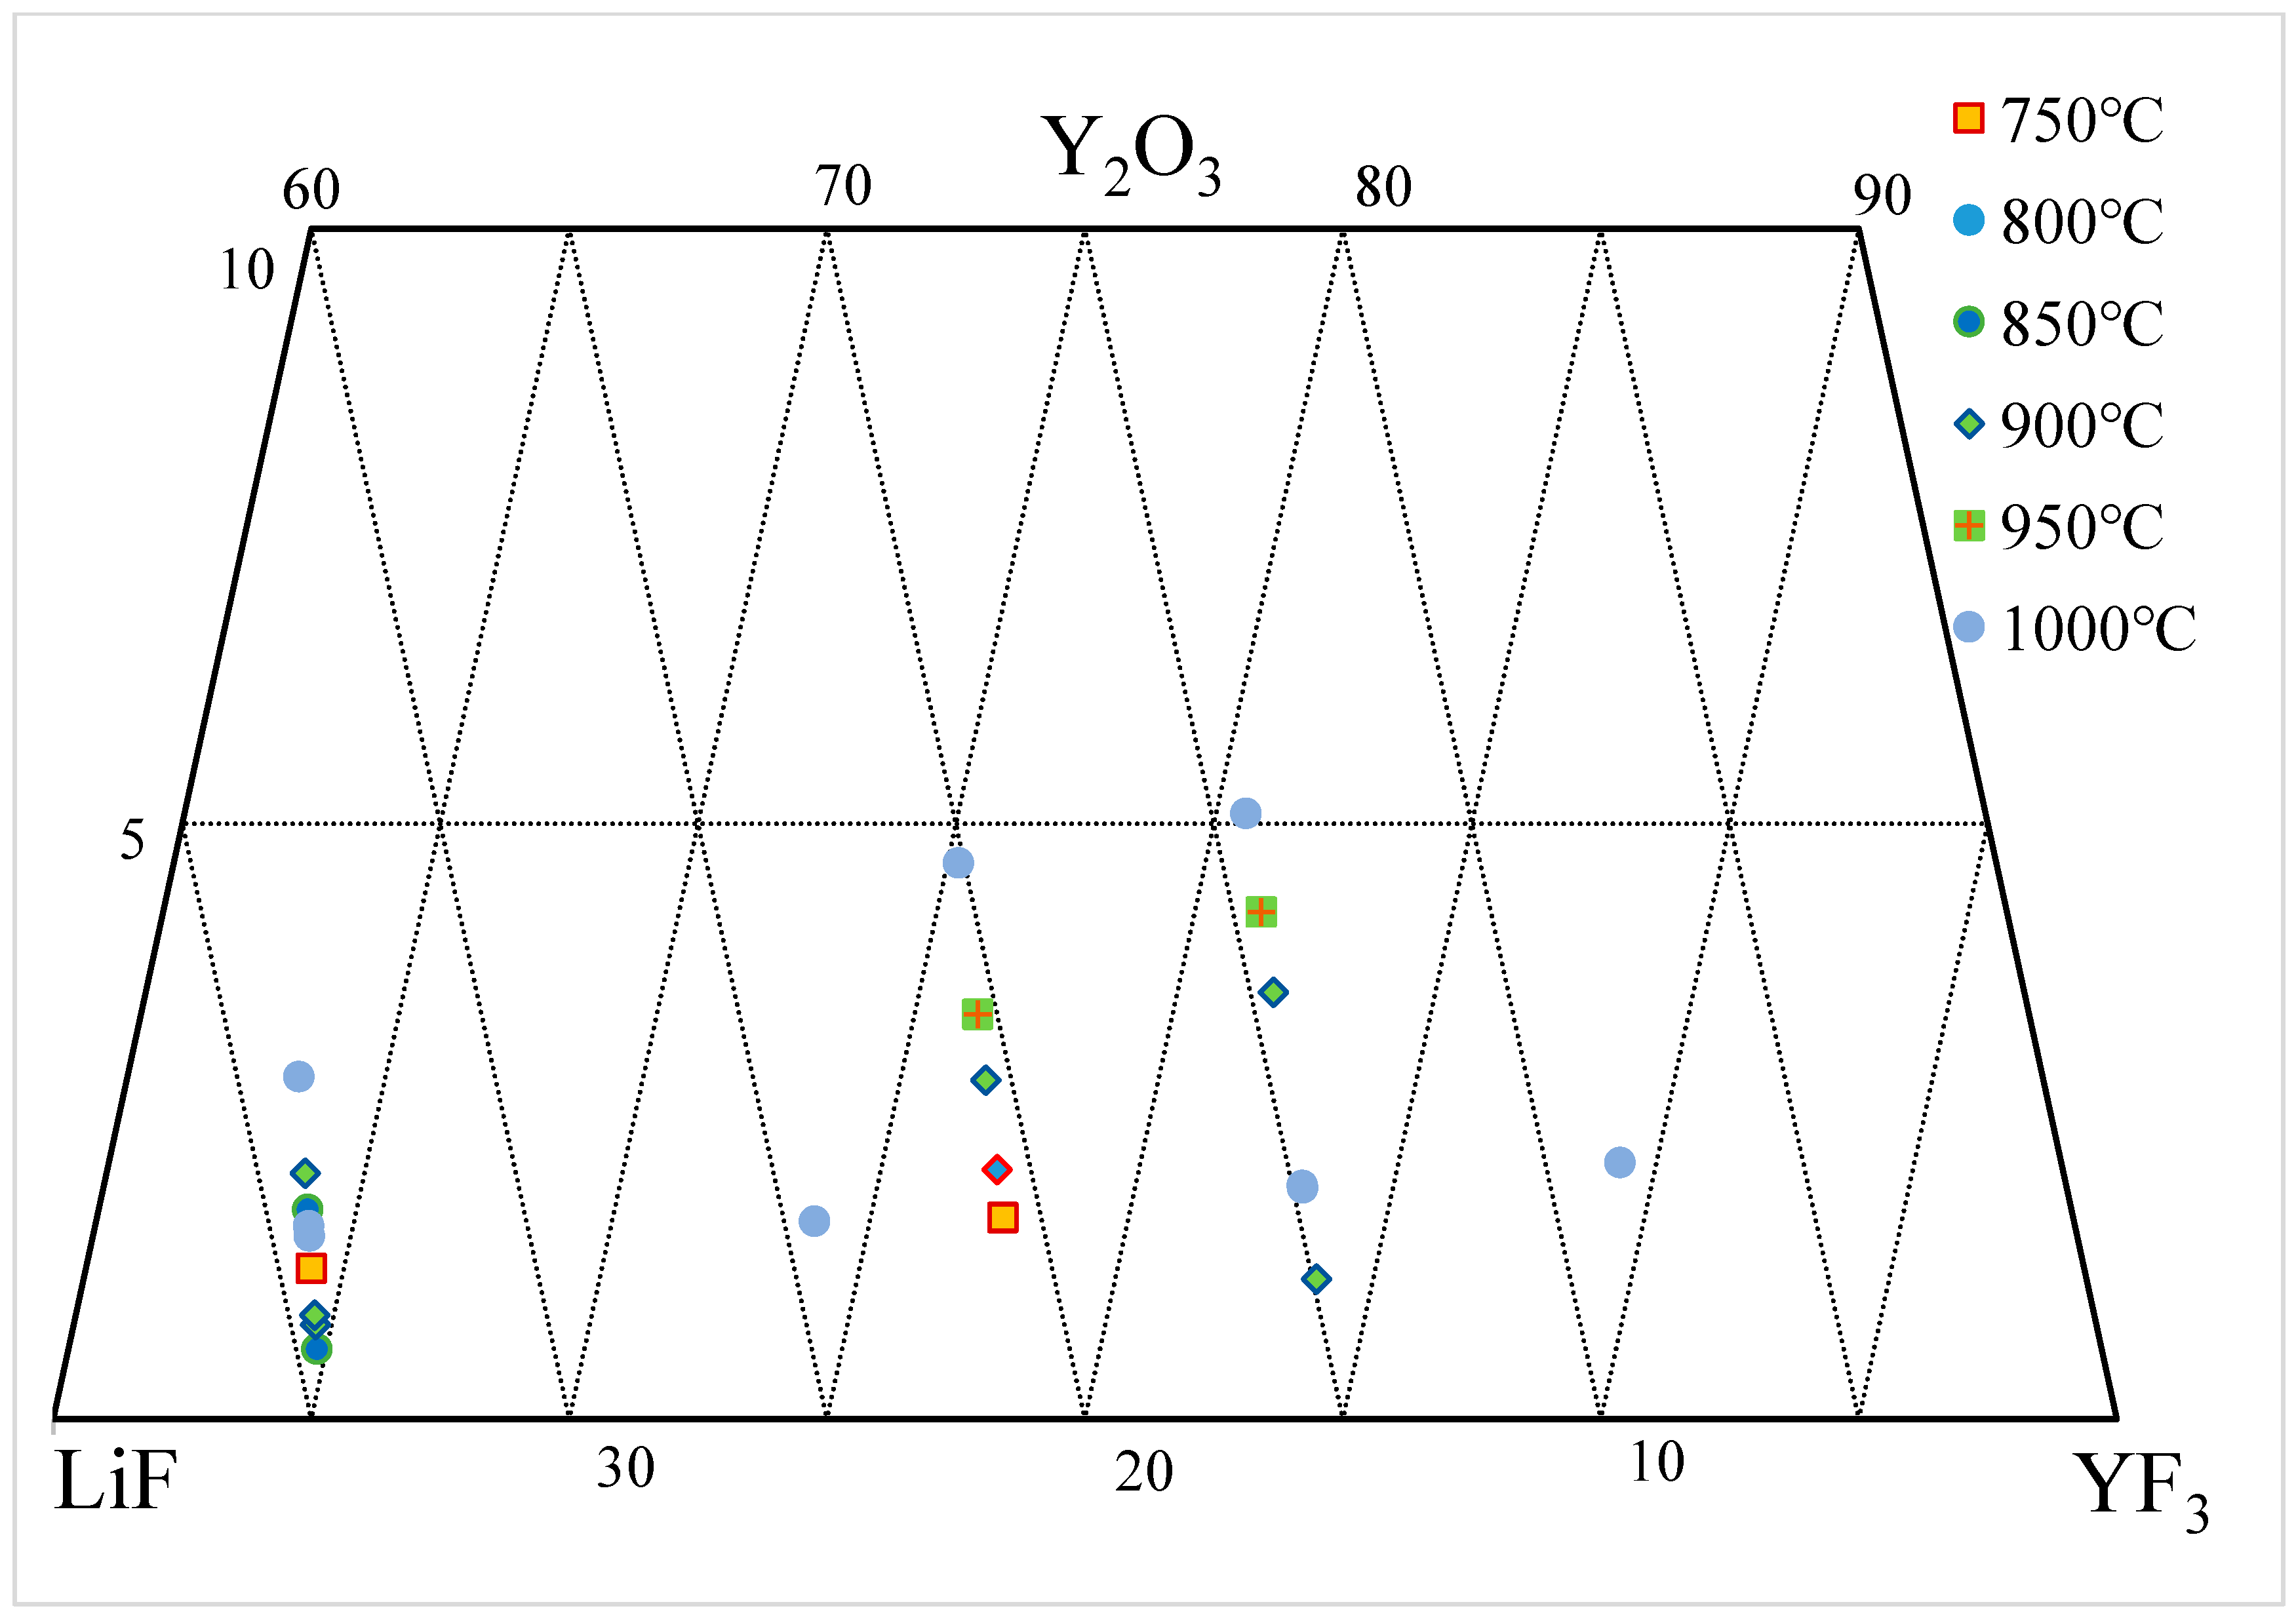
Figure 6 presents the solubility data of Y
2O
3 in the YF
3-LiF system annotated on a ternary phase diagram, and the data from the literature are summarized in
Table 3 [27][28]. Within the range of 725–1009 °C and 60–90 wt.% YF
3, the solubility of Y
2O
3 in the YF
3-LiF system ranges from 0.45 to 5.09 wt.%. Data published by the same group of researchers indicate that the solubility of Y
2O
3 in YF
3-LiF increases with temperature and YF
3. However, as can be seen from the figure, there are significant differences in the data from different researchers.
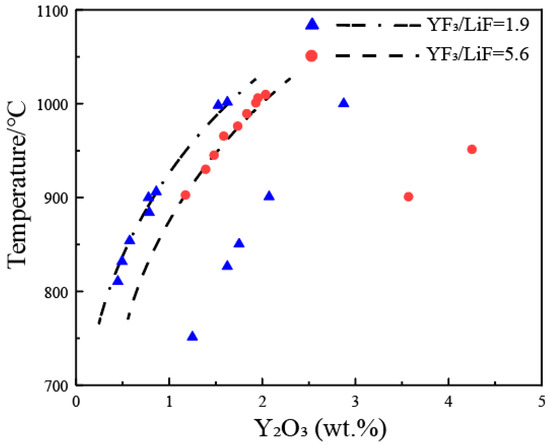
Figure 7 annotates partial solubility data of Y
2O
3 on a pseudo-binary phase diagram of Y
2O
3-(YF
3 + LiF), with YF
3/LiF weight ratios of 1.9 and 5.6. From the figure, it can be observed that the liquidus temperature increases with an increase in the concentration of Y
2O
3, but the extent of increase is not as significant as in the La
2O
3-LaF
3-LiF and Nd
2O
3-NdF
3-LiF systems. Therefore, the solubility of Y
2O
3 in the YF
3-LiF system increases rapidly with increasing temperature. In principle, at the same temperature, a higher YF
3/LiF ratio leads to a greater solubility of Y
2O
3, but there are significant differences in the data from the two groups of researchers in the figure. The dashed lines in the figure represent the estimated liquidus lines corresponding to the YF
3/LiF weight ratios of 1.9 and 5.6, based on the experimental data.
5. Solubility Model of RE2O3-REF3-LiF System
High-temperature phase equilibrium experiments not only consume a significant amount of time and funding, as mentioned above, they also yield substantial variations in the data among different researchers and experimental methods, which brings confusion to the applications of these data. Various thermodynamic models, such as FactSage
[30][31], MTDATA
[32], and Thermo-Calc
[33], have been developed to predict the thermodynamic properties of slags, molten salts, and alloys. The solubility of rare earth oxides in molten salts can theoretically be predicted using thermodynamic models. However, the construction of the core database for these thermodynamic models relies heavily on a large amount of experimental data. The lack of accurate thermodynamic data for rare earth oxide–molten salt systems currently hinders the ability of existing thermodynamic models to predict their properties, including solubility. Researchers have attempted to establish semi-empirical models
[8][9] to predict the solubility of rare earth oxides in molten salts based on available experimental data.
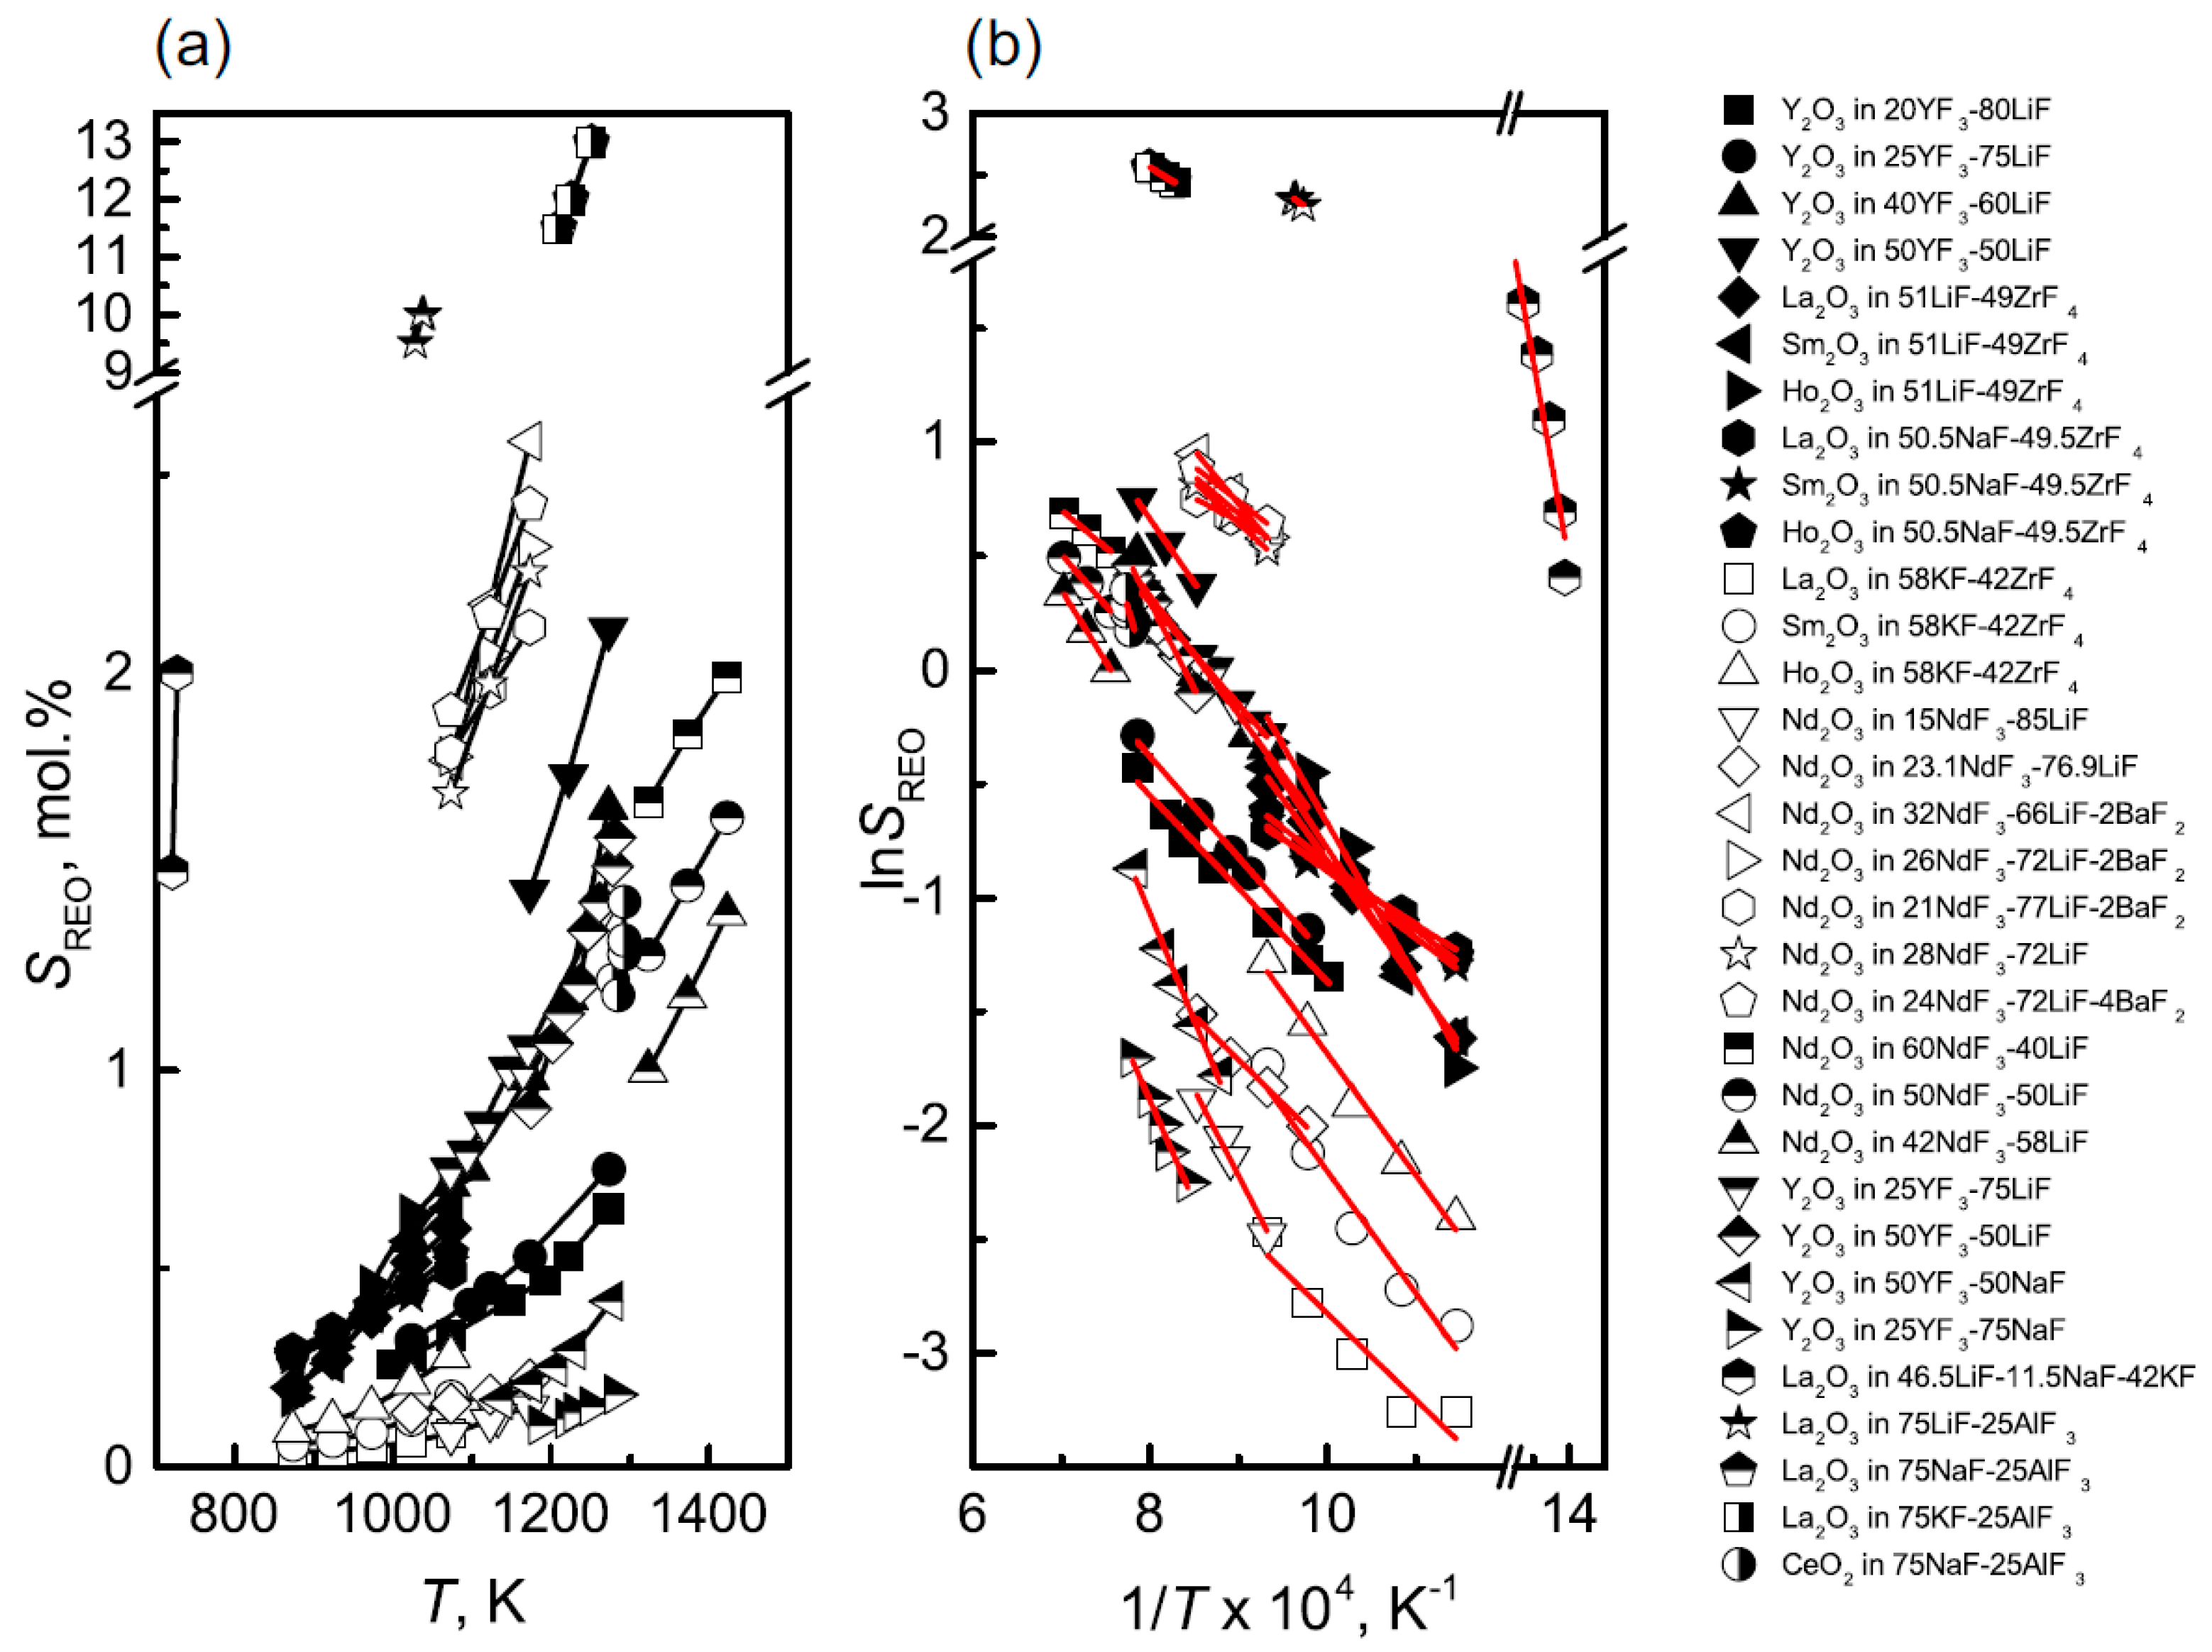
Figure 8 summarizes the solubility of various rare earth oxides in fluoride salts, where
Figure 8a shows the relationship between solubility and temperature, and
Figure 8b demonstrates the relationship between the logarithm of solubility and the reciprocal of temperature
[9]. It can be observed that the solubility of rare earth oxides in molten salts generally increases with temperature but with significant variations among different systems. For most systems, the logarithm of solubility exhibits a linear relationship with the reciprocal of temperature.
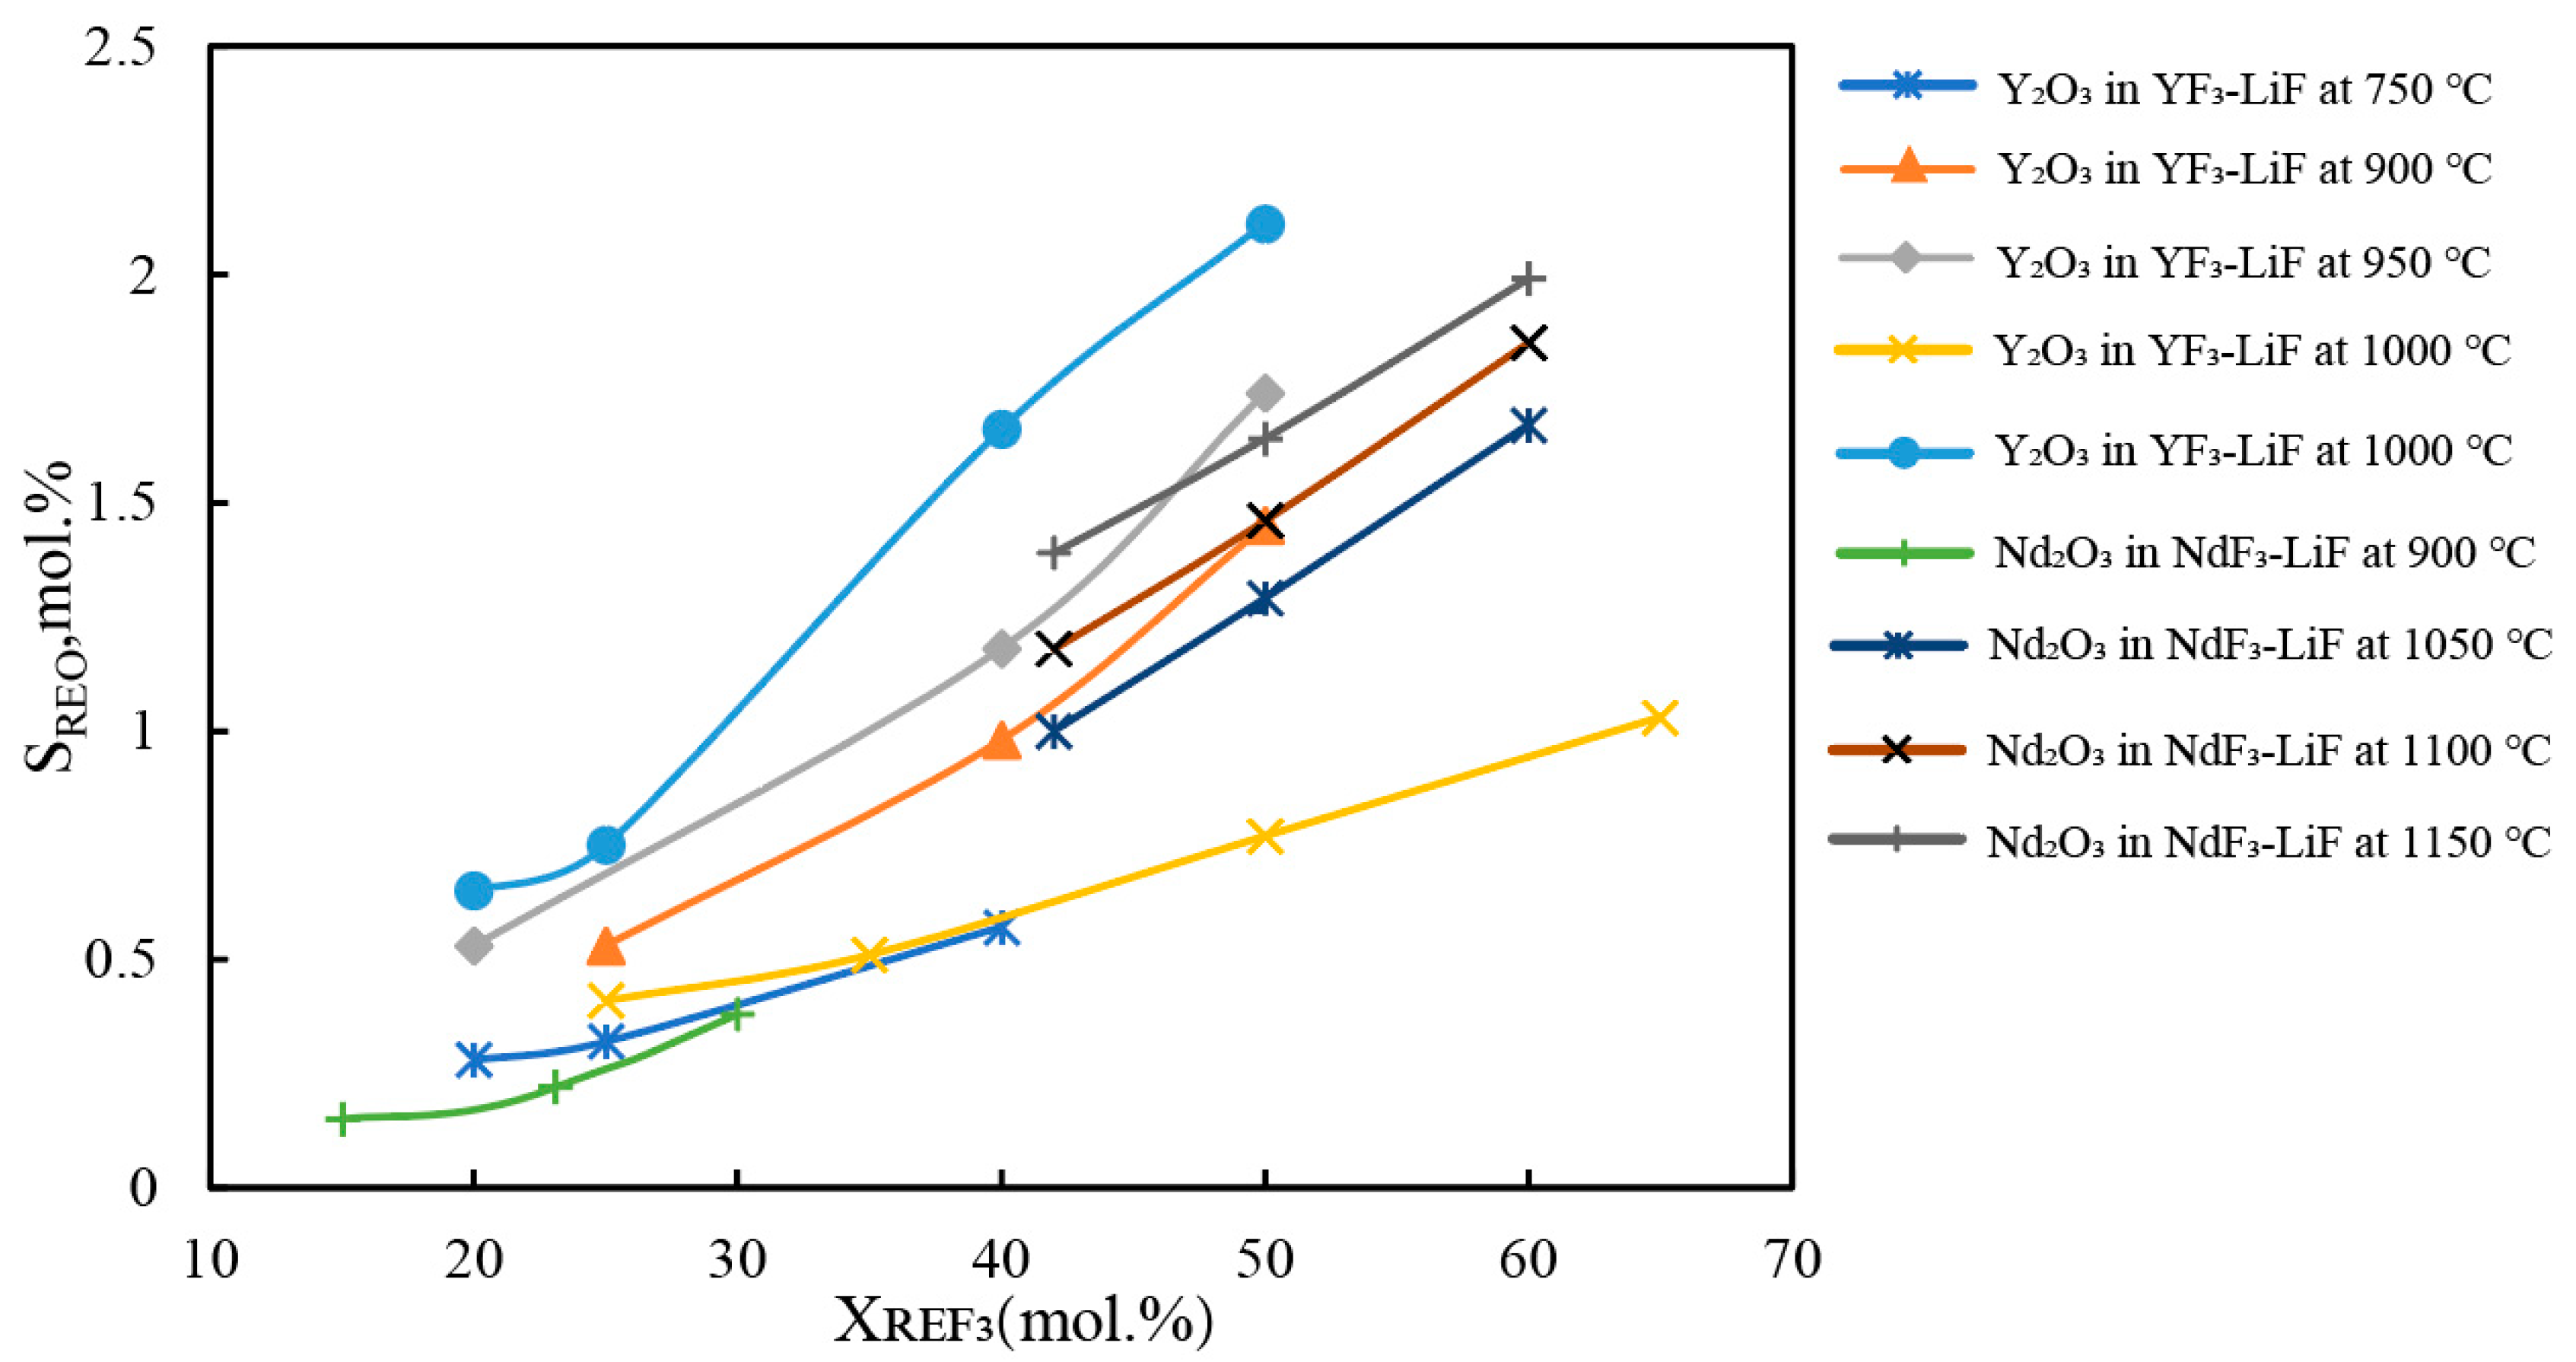
Figure 9 illustrates the relationship between the solubility of Nd
2O
3 and Y
2O
3 and the concentration of rare earth fluoride (REF
3). Within the studied concentration and temperature ranges, the solubility of the oxides increases with an increase in the concentration of REF
3 in the molten salt. At higher temperatures, the solubility of rare earth oxides is more sensitive to the concentration of REF
3 in the molten salt. As shown in
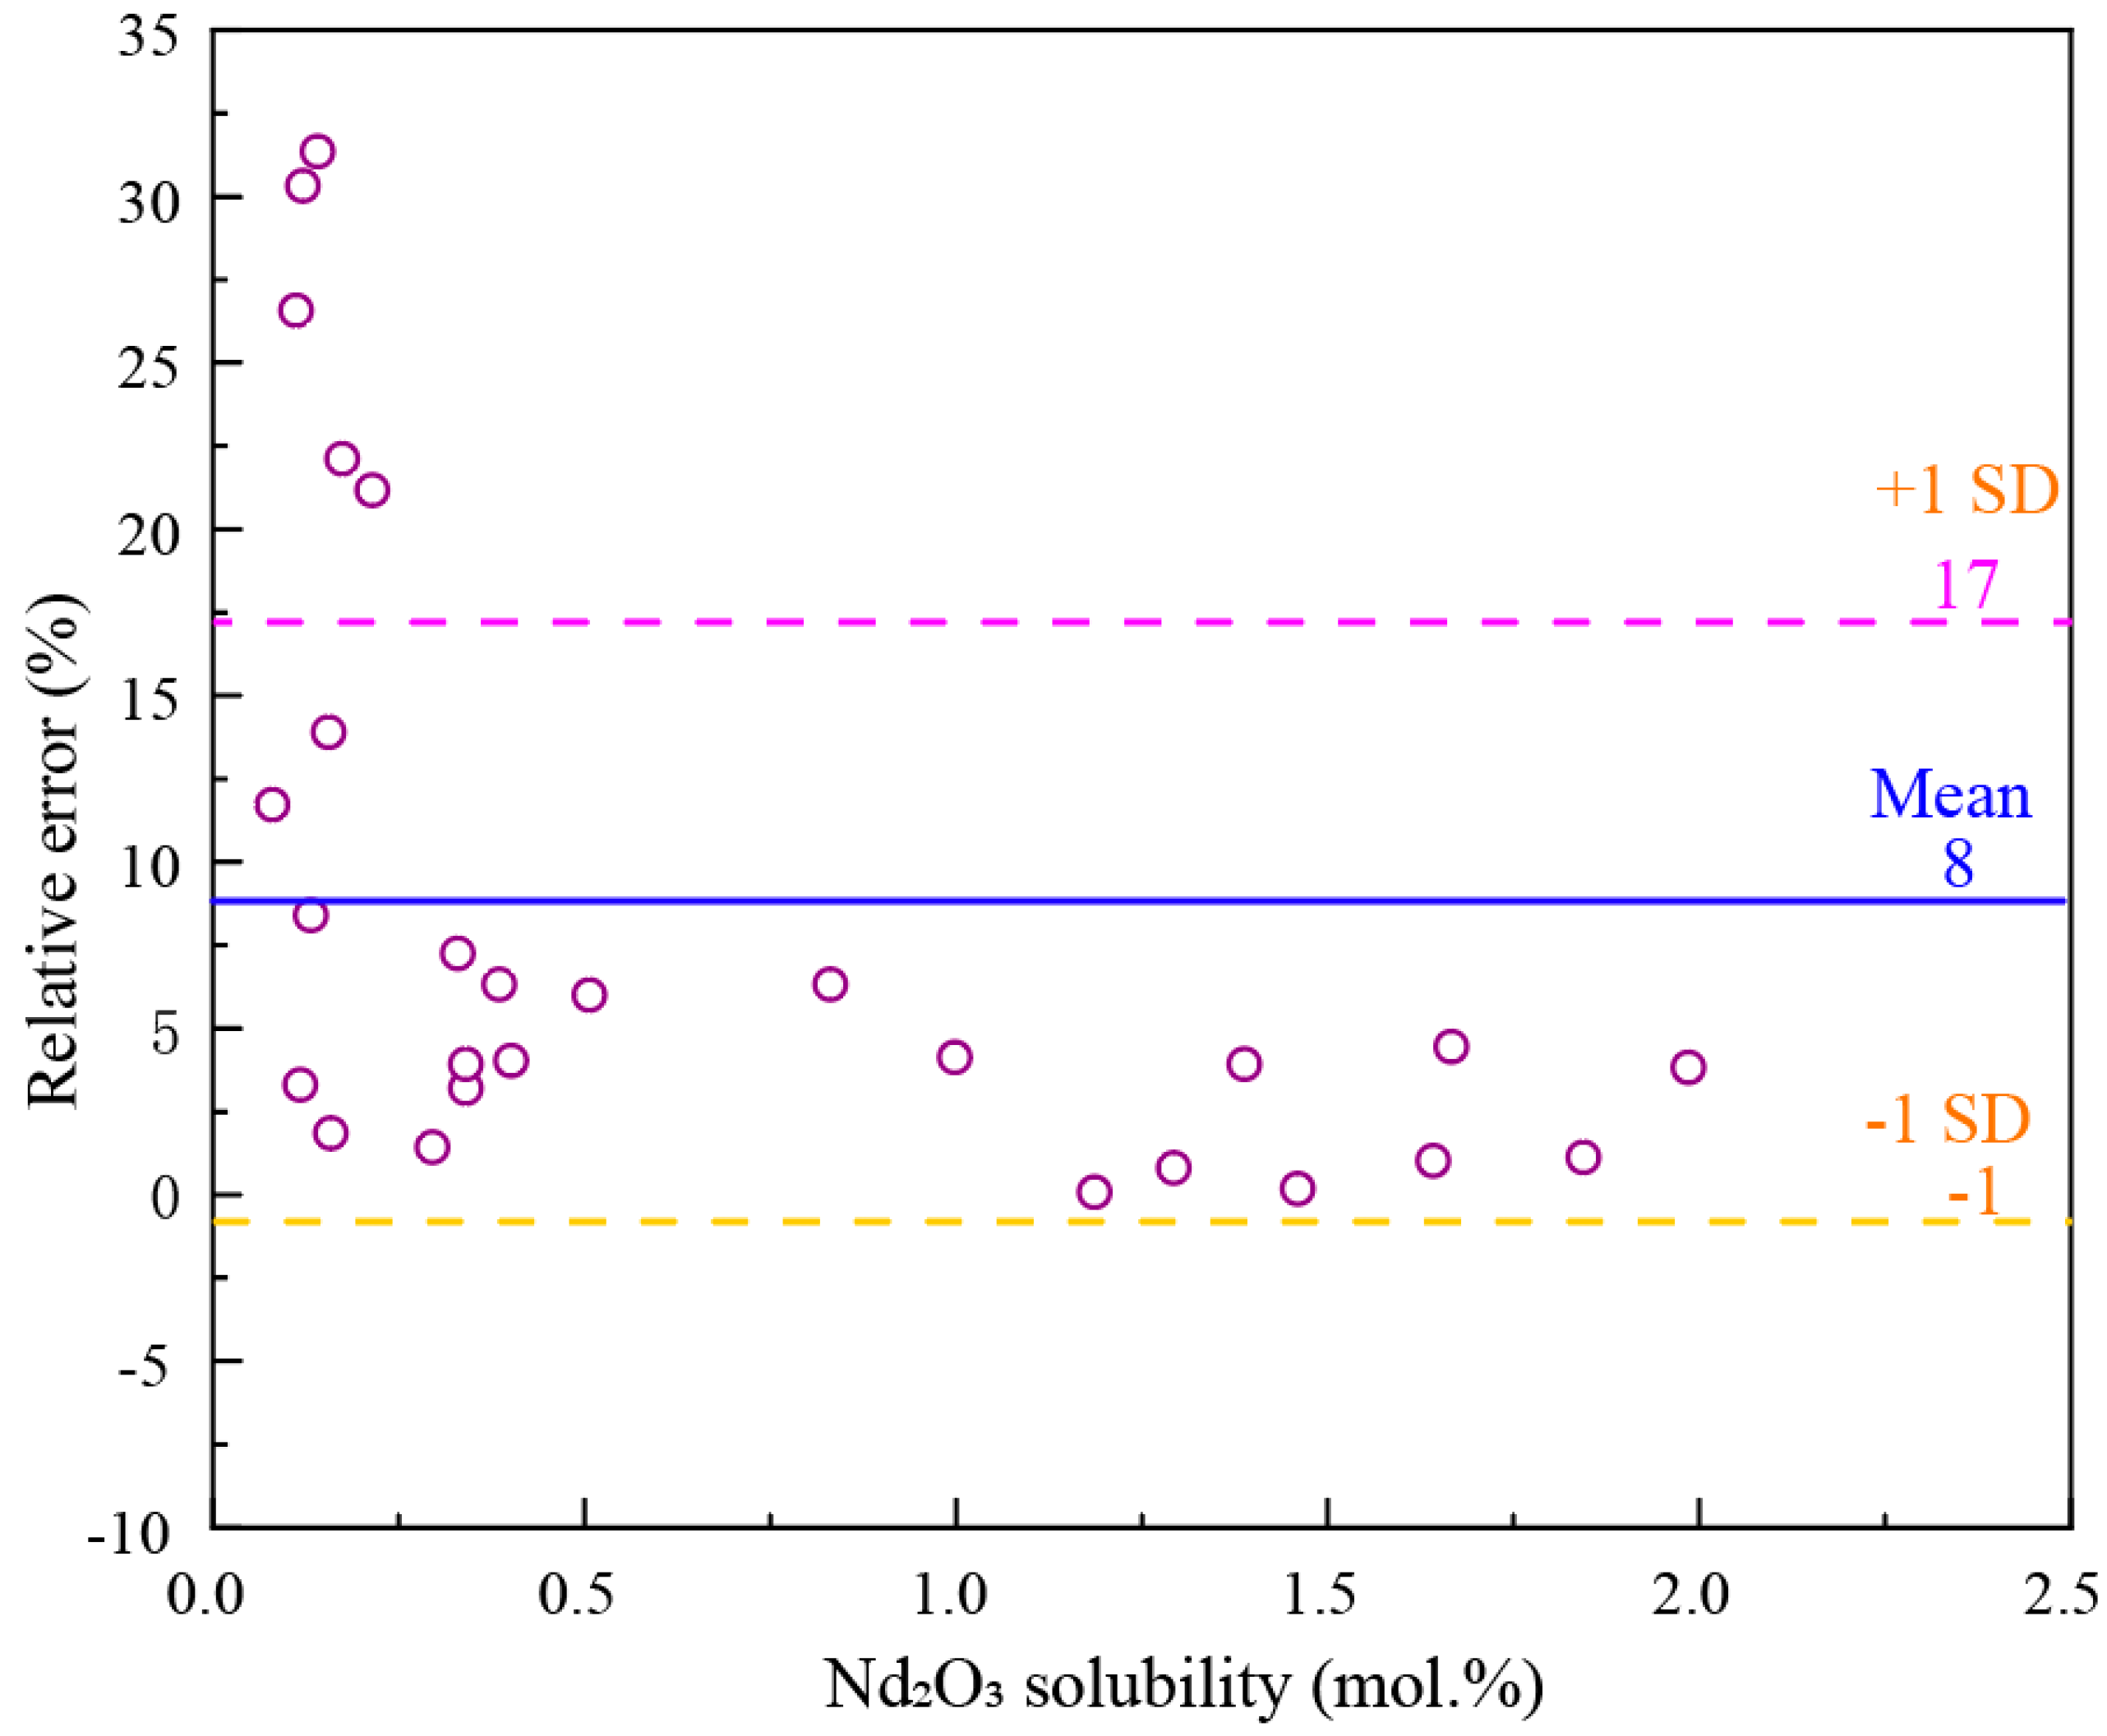
Figure 9, the solubility data for different rare earth oxides in fluoride salts exhibit considerable variability, making it difficult to be expressed by a unified model. Guo et al.
[9] proposed semi-empirical prediction models for each rare earth oxide with available solubility experimental data. For example, they developed a solubility prediction model for Nd
2O
3 in the NdF
3-LiF-(MgF
2/CaF
2) system using the data from three articles
[12][13][17]. The comparison between the predicted and experimental results is shown in
Figure 10, with an average error of 8%. However, the error can reach 30% for low solubility cases.
As shown in
Figure 1, the solubility data of Nd
2O
3 in the NdF
3-LiF system reported in the literature are much more extensive than those used by Guo et al.
[9].
Figure 11 compares the solubility calculated by Guo et al.’s model
[9] with all the experimental solubility data of Nd
2O
3 in the NdF
3-LiF system. It can be seen that the solubilities calculated by Guo et al.’s model show a big difference compared with the experimental data in low NdF
3 fluoride salt.
 +1 credit