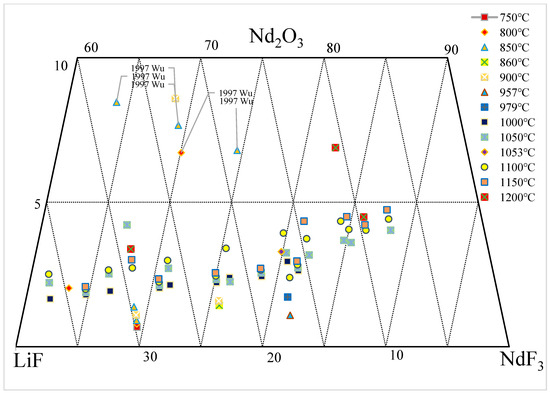
The solubility of rare earth oxides in molten salt directly affects the selection of operational parameters in the electrolysis process. When the added amount of RE2O3 is less than its solubility, it leads to a decreased electrolytic efficiency. Conversely, an excessive amount of oxide is prone to settle at the bottom of the electrolytic cell, impeding smooth production. The RE2O3 solubility in the fluoride salt can be represented by the phase equilibrium of the RE2O3-REF3-LiF system. The isothermal lines in the primary phase field of rare earth oxide represent the solubility of the oxide in the fluoride salt at the corresponding temperature.
- rare earth
- molten salt electrolysis
- phase equilibrium
- solubility
1. Introduction
Rare earth metals and alloys are increasingly used in the field of new materials, and there is a strong market demand. Rare earth elements have unique physical and chemical properties due to their special electronic structures, such as excellent optical and electrical properties, magnetic properties, and active chemical properties. With the development of modern science and technology, REEs have become indispensable key materials for high-tech and novel functional materials [1][2][1,2].
In the process of producing rare earth metals through oxide–fluoride melt system electrolysis, REF3 and LiF form an electrolyte with a low melting point, low density, and high electrical conductivity. Under the action of electrical current, the dissolved RE2O3 is converted to rare earth metals and oxygen at the cathode and anode, respectively. As the electrolysis process progresses, the dissolved RE2O3 in the molten salt is continuously consumed, requiring continuous addition of RE2O3 to maintain a high concentration in the electrolyte [3][4][5][19,20,21]. When the amount of RE2O3 added to the molten salt is lower than its solubility, the electrolysis efficiency and productivity are low. Conversely, if the amount of RE2O3 added to the molten salt exceeds its solubility, the excess RE2O3, being denser than the REF3-LiF melt, tends to form deposits at the bottom of the electrolytic cell, increasing the cell resistance, affecting the metal purity, and even seriously impeding the smooth progress of production [6][7][22,23]. Therefore, the solubility of RE2O3 in the REF3-LiF-RE2O3 system provides the essential data for establishing a suitable feeding system in electrolytic production, playing an important role in improving electrolysis efficiency and maintaining the effective volume of the electrolytic cell. However, there have been significant differences in the solubility data of RE2O3 in the fluoride system, and the semi-empirical models developed based on these data have difficulty in accurately predicting the solubility of rare earth oxides [8][9][24,25].
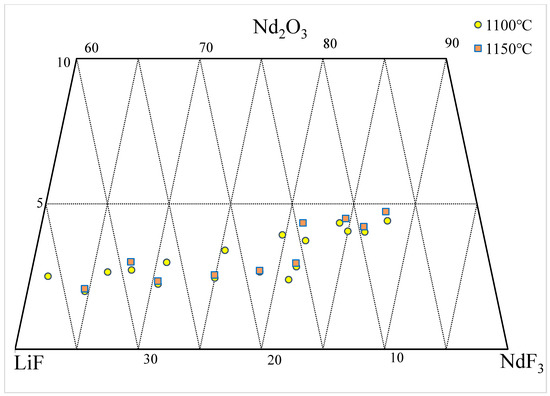
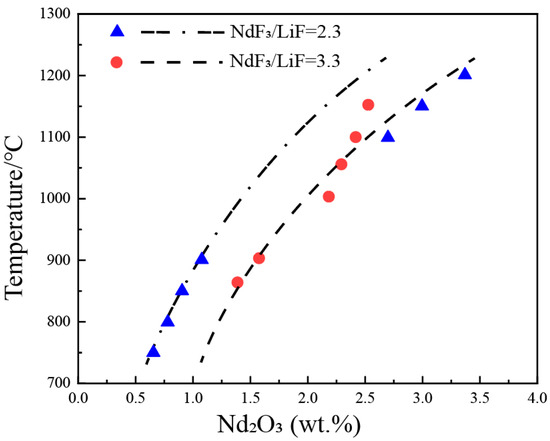
2. Nd2O3-NdF-LiF System
| wt.% | mol% | Normalization (wt.%) | T. | |||||||
|---|---|---|---|---|---|---|---|---|---|---|
| NdF3 | LiF | Nd2O3 | NdF3 | LiF | Nd2O3 | NdF3 | LiF | Nd2O3 | (°C) | Ref. |
| 58 | 42 | 0.54 | 15 | 85 | 0.08 | 57 | 42 | 0.54 | 800 | [13][35] |
| 58 | 42 | 0.75 | 15 | 85 | 0.12 | 57 | 42 | 0.74 | 850 | [13][35] |
| 58 | 42 | 0.82 | 15 | 85 | 0.13 | 57 | 42 | 0.81 | 860 | [13][35] |
| 58 | 42 | 0.96 | 15 | 85 | 0.15 | 57 | 42 | 0.95 | 900 | [13][35] |
| 63 | 37 | 1.68 | 18 | 82 | 0.29 | 62 | 36 | 1.65 | 1000 | [16][38] |
| 63 | 37 | 2.27 | 18 | 82 | 0.40 | 62 | 36 | 2.21 | 1050 | [16][38] |
| 63 | 37 | 2.57 | 18 | 82 | 0.45 | 61 | 36 | 2.51 | 1100 | [16][38] |
| 65 | 35 | 2.07 | 19 | 81 | 0.37 | 63 | 35 | 2.03 | 800 | [21][58] |
| 66 | 34 | 1.83 | 20 | 80 | 0.34 | 65 | 33 | 1.8 | 1000 | [14] |
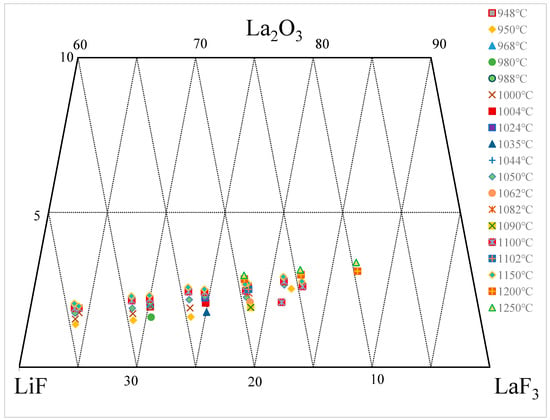
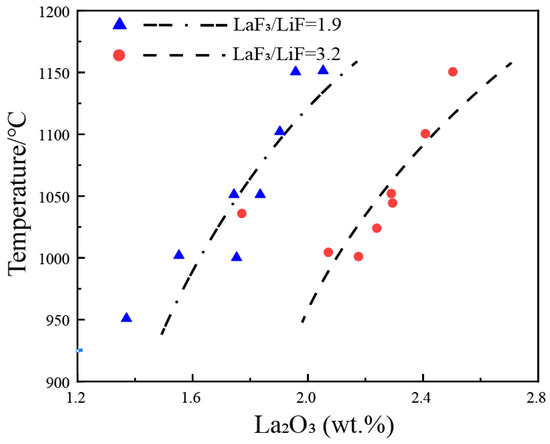
3. La2O3-LaF-LiF System
| wt.% | mol% | Normalization (wt.%) | T. | |||||||||||||||
|---|---|---|---|---|---|---|---|---|---|---|---|---|---|---|---|---|---|---|
| LaF3 | LiF | La2O3 | LaF3 | LiF | La2O3 | LaF3 | LiF | La2O3 | (°C) | Ref. | ||||||||
| 65 | 35 | 1.4 | 20 | 80 | 0.26 | 64 | 35 | 1.38 | 950 | [24][40] | ||||||||
| 65 | 35 | 1.58 | 20 | 80 | 0.29 | 64 | 34 | S | 1000 | [24][40] | ||||||||
| 65 | 35 | 1.78 | 20 | 80 | ||||||||||||||
| [ | ||||||||||||||||||
| 36 | ||||||||||||||||||
| ] | ||||||||||||||||||
| 0.33 | 64 | 34 | 1.75 | 1050 | [ | 24 | ] | [ | 40 | ] | ||||||||
| 65 | 35 | 1.94 | 20 | 80 | 0.36 | 64 | 34 | 1.9 | 1100 | [24][40] | ||||||||
| 65 | 35 | 2.1 | 20 | 80 | 0.39 | 64 | 34 | 2.06 | 1150 | [24][40] | 66 | 34 | ||||||
| 65 | 35 | 1.79 | 20 | 80 | 0.33 | 64 | 34 | 1.76 | 1000 | [14][36] | ||||||||
| 65 | 35 | 1.87 | 20 | 80 | 0.35 | 64 | 34 | 1.84 | 1050 | [14][36] | ||||||||
| 65 | 35 | 1.94 | 20 | 80 | 0.36 | 64 | 34 | 1.9 | 1100 | [14][36] | ||||||||
| 65 | 35 | 2.01 | 20 | 80 | 0.37 | 64 | 34 | 1.97 | 1150 | [14][36] | 1.92 | 20 | 80 | 0.35 | 65 | 33 | 1.88 | 1050 |
| 70 | 30 | 1.54 | 24 | [ | 76 | 0.32 | 14 | 69 | ] | [ | 3036] | |||||||
| 1.52 | 950 | [ | 24 | ] | [ | 40 | ] | |||||||||||
| 48 | ] | 70 | 30 | 1.76 | 24 | 76 | 0.36 | 69 | 29 | |||||||||
| 65 | 35 | 0.5 | 25 | 75 | 0.12 | 65 | 35 | 1.73 | 1000 | [24 | 0.5 | 831 | [28][63] | |||||
| 65 | 35 | 1.79 | 25 | 75 | 0.45 | 64 | 34 | 1.76 | 850 | [29][48] | ||||||||
| 65 | 35 | 0.59 | 25 | 75 | 0.15 | 65 | 35 | 0.59 | 850 | [28][63] | ||||||||
| 65 | 35 | 0.8 | 25 | 75 | 0.20 | 65 | 35 | 0.79 | 882 | [28][63] | ||||||||
| 65 | 35 | 0.8 | 25 | 75 | 0.20 | 65 | 35 | 0.79 | 900 | [28][63] | ||||||||
| 65 | 35 | 2.11 | 25 | 75 | 0.53 | 64 | 34 | 2.07 | 900 | [29][48] | ||||||||
| 65 | 35 | 0.88 | 25 | 75 | 0.22 | 65 | 34 | 0.87 | 900 | [28][63] | ||||||||
| 65 | 35 | 1.65 | 25 | 75 | 0.41 | 64 | 34 | 1.62 | 1000 | [28][63] | ||||||||
| 65 | 35 | 2.96 | 25 | 75 | 0.75 | 63 | 34 | 2.87 | 1000 | [29][ | ||||||||
| 90 | ||||||||||||||||||
| 10 | ||||||||||||||||||
| 3.2 | ||||||||||||||||||
| 54 | ||||||||||||||||||
| 46 | ||||||||||||||||||
| 1.19 | ||||||||||||||||||
| 87 | ||||||||||||||||||
| 10 | ||||||||||||||||||
| 3.1 | ||||||||||||||||||
| 1200 | ||||||||||||||||||
| [ | ||||||||||||||||||
| 24 | ||||||||||||||||||
| ] | ||||||||||||||||||
| [ | ||||||||||||||||||
| 40 | ||||||||||||||||||
| ] | ||||||||||||||||||
| 90 | 10 | 3.5 | 54 | 46 | 1.30 | 87 | 10 | 3.38 | 1250 | [24][40] | ||||||||
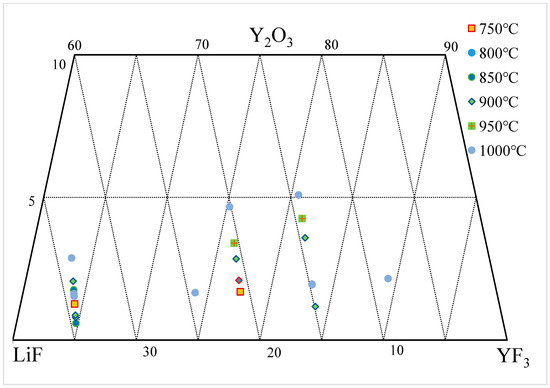
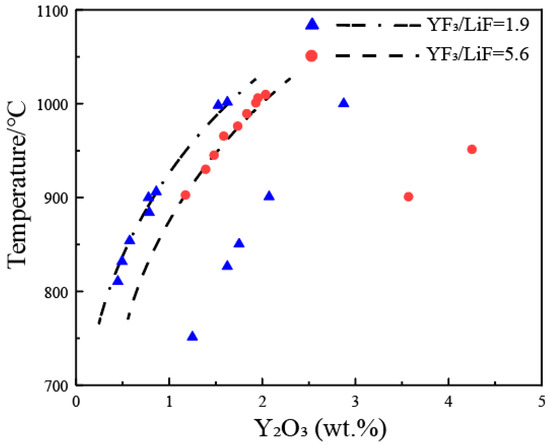
4. Y2O3-YF3-LiF System
| wt.% | mol% | Normalization (wt.%) | T. | |||||||||||||||||||||||||||
|---|---|---|---|---|---|---|---|---|---|---|---|---|---|---|---|---|---|---|---|---|---|---|---|---|---|---|---|---|---|---|
| YF3 | LiF | Y2O3 | YF3 | LiF | Y2O3 | YF3 | LiF | Y2O3 | (°C) | Ref. | ||||||||||||||||||||
| 58 | 42 | 1.17 | 20 | 80 | 0.26 | 58 | 41 | 1.16 | 725 | [29][48] | ||||||||||||||||||||
| 58 | 42 | 1.25 | 20 | 80 | 0.28 | 58 | 41 | 1.23 | 750 | [29][48] | ||||||||||||||||||||
| 58 | 42 | 1.48 | 20 | 80 | 0.33 | 58 | 41 | 1.46 | 800 | [29][48] | ||||||||||||||||||||
| 58 | 42 | 1.87 | 20 | 80 | 0.42 | 57 | 41 | 1.84 | 875 | [29][48] | ||||||||||||||||||||
| 58 | 42 | 2.09 | 20 | 80 | 0.47 | 57 | 41 | 2.05 | 920 | [29][48] | ||||||||||||||||||||
| 58 | 42 | 2.35 | 20 | 80 | 0.53 | 57 | 41 | 2.3 | 950 | [29][48] | ||||||||||||||||||||
| 58 | 42 | 2.87 | 20 | 80 | 0.65 | 57 | 40 | 2.79 | 1000 | [29][48] | ||||||||||||||||||||
| 65 | 35 | 1.28 | 25 | 75 | 0.32 | 64 | 34 | 1.26 | 750 | [29][48] | ||||||||||||||||||||
| 65 | 35 | 0.45 | 25 | 75 | 0.11 | 65 | 35 | 0.45 | 810 | [28][63] | ||||||||||||||||||||
| 65 | 35 | 1.63 | 25 | 75 | 0.41 | 64 | 34 | 1.6 | 825 | [29][ | ||||||||||||||||||||
| 66 | 34 | 2.03 | 20 | 80 | 0.37 | 65 | 33 | 1.99 | 1100 | [14][36] | ||||||||||||||||||||
| ] | [ | 40 | ] | 66 | 34 | 2.12 | 20 | 80 | 0.39 | 65 | ||||||||||||||||||||
| 70 | 30 | 1.94 | 33 | 2.08 | 1150 | [ | 24 | 14 | ] | [ | 7636] | |||||||||||||||||||
| 0.40 | 69 | 29 | 1.9 | 1050 | [ | 24 | ] | [ | 40 | ] | 68 | 32 | 1.96 | 22 | 78 | |||||||||||||||
| 70 | 0.38 | 67 | 31 | 1.92 | 1000 | [ | 13 | ] | [ | 35] | ||||||||||||||||||||
| 30 | 2.2 | 24 | 76 | 0.45 | 68 | 29 | 2.15 | 1100 | [ | 24][40] | 68 | 32 | 2.59 | 22 | 78 | 0.50 | 66 | 31 | 2.52 | 1050 | [13][35] | |||||||||
| 70 | 30 | 2.35 | 24 | 76 | 0.49 | 68 | 29 | 2.3 | 1150 | [24][40] | 68 | 32 | 2.73 | 22 | 78 | 0.53 | 66 | 31 | 2.65 | 1100 | ||||||||||
| 72 | 28 | 1.99 | [ | 13 | ] | [ | 35 | ] | ||||||||||||||||||||||
| 25 | 75 | 0.43 | 70 | 28 | 1.95 | 948 | [ | 25 | ] | [41] | 70 | 30 | 9.24 | 23 | 77 | 1.96 | 64 | 28 | 8.46 | 850 | [ | |||||||||
| 72 | 12 | ] | 28 | [ | 2.08 | 25 | 75 | 0.45 | 70 | 34] | ||||||||||||||||||||
| 28 | 2.04 | 968 | [ | 25 | ] | [ | 41 | ] | 70 | 30 | 1.4 | 23 | 77 | 0.28 | 69 | |||||||||||||||
| 72 | 28 | 1.64 | 30 | 1.38 | 850 | [ | 22 | ] | [ | 61] | ||||||||||||||||||||
| 25 | 75 | 0.35 | 70 | 28 | 1.61 | 980 | [ | 26 | ] | [42] | 70 | 30 | 4.4 | 23 | 77 | |||||||||||||||
| 72 | 0.90 | 28 | 2.17 | 25 | 75 | 67 | 29 | 4.21 | 1050 | 0.47[22][61] | ||||||||||||||||||||
| 70 | 28 | 2.12 | 988 | [ | 25 | ] | [ | 41 | ] | 70 | 30 | 0.68 | 23 | |||||||||||||||||
| 72 | 28 | 2.01 | 77 | 0.14 | 25 | 75 | 0.4369 | 30 | 0.68 | 70 | 28750 | 1.97[16] | 1000[38] | |||||||||||||||||
| [ | 14 | ] | [ | 36 | ] | 48 | 70 | 30 | ||||||||||||||||||||||
| 72 | 0.8 | 23 | 77 | 0.16 | 28 | 69 | 2.13 | 25 | 75 | 0.4630 | 0.79 | 800 | [16][38] | |||||||||||||||||
| ] | 70 | 28 | ||||||||||||||||||||||||||||
| 65 | 35 | 1.65 | 25 | 75 | 0.41 | 64 | 34 | 2.09 | 1050 | 1.62[14] | 1000[36] | [28] | 70 | 30 | ||||||||||||||||
| [ | 63 | ] | 72 | 280.92 | 23 | 77 | 0.18 | 2.2669 | 25 | 75 | 0.49 | 7030 | 0.91 | 850 | [16][38] | |||||||||||||||
| 28 | 2.21 | 1100 | [ | 14 | ] | [ | 36 | |||||||||||||||||||||||
| 75 | 25 | 1.69 | 35 | 65 | 0.51 | 74 | 24 | 1.66 | ] | 1000 | [28][63] | 70 | 30 | 1.11 | 23 | 77 | 0.22 | 69 | 30 | |||||||||||
| 72 | 28 | 2.37 | 25 | 75 | 0.51 | 70 | 1.1 | 900 | 28 | 2.32 | 1150[16][38 | |||||||||||||||||||
| 79 | ] | |||||||||||||||||||||||||||||
| [ | 14 | ] | [ | 36 | ] | 21 | 1.72 | 40 | 60 | 0.57 | 78 | 21 | 1.69 | 750 | [29][48] | 70 | 30 | 2.8 | 23 | 77 | 0.57 | 68 | ||||||||
| 75 | 25 | 1.65 | 28 | 29 | 72 | 0.38 | 74 | 252.72 | 1100 | [ | 1.6220 | 950][57] | ||||||||||||||||||
| [ | ||||||||||||||||||||||||||||||
| 79 | 24 | ] | [ | 21 | 40 | ] | 2.14 | 40 | 60 | 0.71 | 77 | 21 | 2.1 | 800 | [29][48] | 70 | 30 | 3.1 | 23 | 77 | 0.63 | 68 | 29 | 3.01 | 1150 | |||||
| 75 | 25 | 1.95 | 28 | 72 | 0.45 | 74 | [ | 20 | 25 | ] | 1.91[ | |||||||||||||||||||
| 79 | 1000 | 57 | ] | |||||||||||||||||||||||||||
| [ | 24 | ] | [ | 40 | 21 | ] | 2.26 | 40 | 60 | 0.75 | 77 | 21 | 2.21 | 825 | [29][48] | 70 | 30 | 3.5 | 23 | 77 | 0.71 | |||||||||
| 75 | 25 | 68 | 29 | 3.38 | 2.23 | 28 | 72 | 0.52 | 73 | 24 | 2.18 | |||||||||||||||||||
| 79 | 1200 | [ | 20 | ] | 21 | [ | 57 | ] | ||||||||||||||||||||||
| 1050 | [ | 2.93 | 24 | 40 | ] | 60 | [ | 0.98 | 40 | ] | 77 | 20 | 2.85 | 900 | [29] | 72 | 28 | 2.07 | 25 | 75 | 0.44 | |||||||||
| [ | 48 | ] | 75 | 25 | 2.5 | 71 | 28 | 72 | 0.58 | 7327 | 2.03 | 1000 | 24 | 2.44[14][36] | ||||||||||||||||
| 79 | 1100 | [ | 21 | 3.52 | 24 | ] | [ | 40 | ] | 40 | 60 | 1.18 | 76 | 20 | 3.4 | 950 | [29][48] | 72 | 28 | 2.17 | 25 | |||||||||
| 75 | 75 | 0.46 | 71 | |||||||||||||||||||||||||||
| 79 | 27 | 25 | 2.12 | 2.65 | 28 | 72 | 0.62 | 1050 | 73 | 24 | 2.58 | 1150[14][36] | ||||||||||||||||||
| 21 | [ | 24 | ] | [ | 40 | ] | 4.9 | 40 | 60 | 1.66 | 75 | 20 | 4.67 | 1000 | [29][48] | 72 | 28 | 2.29 | 25 | 75 | 0.48 | 70 | 27 | 2.24 | 1100 | [14][36 | ||||
| 76 | ] | |||||||||||||||||||||||||||||
| 24 | 2.23 | |||||||||||||||||||||||||||||
| 85 | 15 | 3.72 | 30 | 70 | 0.53 | 50 | 50 | 1.4575 | 23 | 2.18 | 82 | 15 | 3.591000 | [14][ | 900 | [29][48] | 72 | 28 | 2.4 | 25 | 75 | 0.51 | 70 | 27 | 2.34 | 1150 | [14][36] | |||
| 36 | ] | |||||||||||||||||||||||||||||
| 76 | 24 | 2.12 | ||||||||||||||||||||||||||||
| 85 | 15 | 1.19 | 30 | 70 | 0.50 | 75 | 23 | 502.08 | 1004 | [25][41] | 50 | 0.46 | 84 | 15 | 1.18 | 900 | [28][63] | 73 | 27 | 2.18 | 26 | 74 | 0.47 | 71 | 26 | 2.14 | 1000 | |||
| 76 | 24 | 2.3 | 30 | [ | 70 | 0.55 | 16 | 75 | ] | [ | 2338] | |||||||||||||||||||
| 2.25 | 1024 | [ | 25 | ] | [ | |||||||||||||||||||||||||
| 85 | 15 | 41 | 1.41 | 50 | 50 | ] | 0.54 | 84 | 15 | 1.39 | 929 | [28][63] | 73 | 27 | 2.79 | 26 | 74 | 0.60 | 71 | 26 | 2.71 | 1050 | [16][38] | |||||||
| 76 | 24 | 1.81 | 30 | 70 | 0.43 | 75 | 23 | 1.78 | 1035 | [26][42] | ||||||||||||||||||||
| 85 | 15 | 1.51 | 50 | 50 | 0.58 | 84 | 15 | 1.49 | 943 | [28][63] | 73 | 27 | 3.08 | 26 | 74 | 0.67 | 71 | |||||||||||||
| 76 | ||||||||||||||||||||||||||||||
| 85 | 24 | 2.36 | 15 | 4.45 | 26 | 2.99 | 1100 | [ | 30 | 16][ | 7038] | |||||||||||||||||||
| 0.56 | 75 | 23 | 2.31 | 1044 | [ | 50 | 50 | 1.75 | 25 | ][41] | 81 | 14 | 4.26 | 950 | [29][48] | 75 | 25 | 7.2 | 28 | 72 | ||||||||||
| 76 | 1.69 | 70 | 23 | 6.72 | 800 | |||||||||||||||||||||||||
| 85 | [ | 12 | ] | [ | 34 | ] | ||||||||||||||||||||||||
| 24 | 15 | 2.35 | 30 | 70 | 0.56 | 75 | 23 | 2.3 | 1050 | [14 | 1.61 | 50 | 50] | 0.62[ | 8436] | 15 | 1.58 | 964 | [28][63] | 75 | 25 | 8.3 | 28 | 72 | 1.96 | 69 | 23 | 7.66 | 850 | [12] |
| 85 | [ | 34 | ] | |||||||||||||||||||||||||||
| 76 | 24 | 2.48 | 30 | 70 | 15 | 1.78 | 50 | 500.59 | 75 | 23 | 0.69 | 83 | 152.42 | 1100 | [14][36] | 1.75 | 974 | [28][63] | 75 | 25 | 9.4 | |||||||||
| 85 | 15 | 1.88 | 28 | 72 | 2.24 | |||||||||||||||||||||||||
| 76 | 24 | 69 | 2.58 | 30 | 70 | 0.62 | 23 | 8.59 | 900 | 74 | 23[12][34] | |||||||||||||||||||
| 2.52 | 1150 | [ | 14 | ] | 50 | 50 | [ | 0.73 | 36 | 83 | 15 | 1.85] | 988 | [28][63] | 77 | 23 | ||||||||||||||
| 80 | 20 | 1.45 | 30 | 70 | 2.31 | 350.34 | 76 | 23 | 1.43 | 65860 | 0.61 | 78 | ||||||||||||||||||
| 85 | 15 | 5.36 | 50 | 50 | 2.11 | 20 | 2.26 | [ | 13 | ][35] | ||||||||||||||||||||
| 1050 | [ | 81 | 24 | ] | [ | 40 | ] | 14 | 5.09 | 1000 | [29] | 77 | 23 | 1.61 | 30 | 70 | 0.38 | 76 | ||||||||||||
| [ | 48 | ] | 80 | 20 | 2.53 | 23 | 1.58 | 900 | [ | 13][35] | ||||||||||||||||||||
| 35 | 65 | 0.67 | 78 | 20 | 2.47 | 1100 | [ | |||||||||||||||||||||||
| 85 | 24 | ] | [ | 15 | 40 | ] | 1.98 | 50 | 50 | 0.77 | 83 | 15 | 1.94 | 1000 | [28][63] | 77 | 23 | 2.27 | 30 | 70 | 0.54 | 75 | 23 | |||||||
| 80 | 20 | 2.75 | 2.22 | 1000 | 35 | 65 | ||||||||||||||||||||||||
| 85 | 15 | 0.73 | 2 | [ | 50 | 14 | ] | [ | 50 | 36] | ||||||||||||||||||||
| 78 | 19 | 2.68 | 1150 | [ | 24 | ] | [ | 40 | 0.77 | 83 | 15] | 1.96 | 1000 | [28][63] | 77 | |||||||||||||||
| 80 | 23 | 2.39 | 30 | 70 | 0.57 | 75 | 23 | 2.33 | 1050 | [14][ | 2036] | |||||||||||||||||||
| 2.93 | 35 | 65 | 0.78 | 78 | 19 | 2.85 | 1200 | [ | 24 | ][40] | 77 | |||||||||||||||||||
| 85 | 15 | 2.09 | 50 | 50 | 0.81 | 83 | 15 | 2.05 | 1009 | [28][63] | 23 | 2.51 | 30 | 70 | 0.60 | 75 | 23 | 2.45 | 1100 | [14 | ||||||||||
| 91 | 9 | ] | 2.2 | 64 | 36 | [ | 36 | ] | ||||||||||||||||||||||
| 1.02 | 89 | 9 | 2.15 | 1000 | [ | 28 | ] | [ | 63 | ] | 77 | 23 | 2.62 | 30 | 70 | 0.63 | 75 | 23 | 2.55 | 1150 | [14][36] | |||||||||
| 78 | 22 | 2.45 | 31 | 69 | ||||||||||||||||||||||||||
| 80 | 20 | 3.06 | 35 | 65 | 0.82 | 78 | 19 | 2.97 | 1250 | [24][40] | ||||||||||||||||||||
| 80 | 20 | 2.56 | 35 | 65 | 0.68 | 78 | 19 | 2.5 | 1050 | [14][36] | 0.60 | 76 | 21 | 2.39 | 1000 | [16][38] | ||||||||||||||
| 78 | ||||||||||||||||||||||||||||||
| 80 | 20 | 2.15 | 35 | 65 | 0.57 | 79 | 19 | 2.1 | 1062 | [25][41] | 22 | 2.3 | 31 | |||||||||||||||||
| 80 | 20 | 69 | 0.56 | 2.45 | 35 | 6576 | 22 | 0.65 | 78 | 192.25 | 1050 | [ | 2.3916 | 1082][38] | ||||||||||||||||
| [ | 25 | ] | [ | 41 | ] | 78 | 22 | 3.52 | 31 | |||||||||||||||||||||
| 80 | 20 | 1.97 | 69 | 0.87 | 75 | 21 | 35 | 3.4 | 65 | 0.52 | 79 | 191100 | [16][38] | |||||||||||||||||
| 1.93 | 1090 | [ | 14 | ] | [ | 36 | ] | 80 | 20 | 7.29 | 34 | 66 | 1.95 | |||||||||||||||||
| 80 | 20 | 75 | 19 | 6.79 | 2.69 | 35 | 65 | 0.71 | 78 | 19 | 2.62850 | [12][34] | ||||||||||||||||||
| 1100 | [ | 14 | ] | [ | 36 | ] | 81 | 19 | 2.49 | 35 | 65 | 0.66 | ||||||||||||||||||
| 80 | 20 | 2.58 | 79 | 35 | 65 | 0.69 | 7819 | 2.43 | 1000 | 19 | 2.52[14][36] | |||||||||||||||||||
| 1102 | [ | 25 | ] | [ | 41 | ] | 81 | 19 | 2.62 | 35 | 65 | 0.70 | 79 | |||||||||||||||||
| 80 | 20 | 2.78 | 19 | 2.55 | 1050 | [ | 14 | ] | [ | 36] | ||||||||||||||||||||
| 35 | 65 | 0.74 | 78 | 19 | 2.7 | 1150 | [ | 14 | ] | [36] | 81 | 19 | 2.73 | 35 | 65 | |||||||||||||||
| 83 | 0.73 | 17 | 2.14 | 39 | 61 | 79 | 19 | 2.66 | 1100 | 0.62 | 81[ | 17 | 2.114 | 1100][36] | ||||||||||||||||
| [ | 15 | ] | [ | 37 | ] | 81 | ||||||||||||||||||||||||
| 83 | 19 | 2.78 | 35 | 65 | 170.74 | 2.73 | 39 | 61 | 0.7979 | 19 | 2.7 | 81 | 161150 | 2.66[14] | 1050[36] | |||||||||||||||
| [ | 14 | ] | [ | 36 | ] | 83 | 17 | 1.1 | 39 | 61 | 0.31 | 82 | 17 | 1.09 | 957 | |||||||||||||||
| 83 | 17 | 2.85 | 39 | [ | 61 | 0.83 | 18 | 81 | ] | [ | 1655] | |||||||||||||||||||
| 2.77 | 1100 | [ | 14 | ] | [ | 36 | ] | 83 | 17 | |||||||||||||||||||||
| 83 | 17 | 1.75 | 39 | 61 | 0.49 | 81 | 17 | 1.72 | 979 | [ | 3.0118][ | 3955] | ||||||||||||||||||
| 61 | 0.88 | 81 | 16 | 2.92 | 1150 | [ | 14 | ] | [ | 36] | 83 | 17 | 3.4 | 39 | 61 | 0.97 | 80 | |||||||||||||
| 85 | 15 | 2.68 | 17 | 3.29 | 1053 | [ | 43 | 18 | ] | [ | 5755] | |||||||||||||||||||
| 0.83 | 83 | 15 | 2.61 | 1100 | [ | 24 | ] | [ | 40 | 83 | 17 | 3.04 | 39 | 61 | 0.86 | 81 | 16 | 2.95 | 1000 | [16][38] | ||||||||||
| 83 | 17 | 3.36 | 39 | 61 | 0.96 | 80 | 16 | 3.25 | 1050 | [16][38] | ||||||||||||||||||||
| 83 | 17 | 2.45 | 39 | 61 | 0.69 | 81 | 17 | 2.39 | 1100 | [15][37] | ||||||||||||||||||||
| 83 | 17 | 4.09 | 39 | 61 | 1.17 | 80 | 16 | 3.93 | 1100 | [16][38] | ||||||||||||||||||||
| ] | ||||||||||||||||||||||||||||||
| 85 | 15 | 2.85 | 43 | 57 | 0.88 | 83 | 15 | 2.77 | 1150 | [24][40] | ||||||||||||||||||||
| 85 | 15 | 3.08 | 43 | 57 | 0.96 | 82 | 15 | 2.99 | 1200 | [24][40] | ||||||||||||||||||||
| 85 | 15 | 3.25 | 43 | 57 | 1.01 | 82 | 15 | 3.15 | 1250 | [24][40] | 84 | 16 | 2.7 | 40 | 60 | 0.79 | 82 | 16 | 2.63 | 1000 | [14][36] | |||||||||
| 84 | 16 | 2.81 | 40 | 60 | 0.82 | 82 | 16 | 2.73 | 1050 | [14][36] | ||||||||||||||||||||
| 84 | 16 | 2.92 | 40 | 60 | 0.86 | 81 | 16 | 2.84 | 1100 | [14][36] | ||||||||||||||||||||
| 84 | 16 | 3.05 | 40 | 60 | 0.90 | 81 | 16 | 2.96 | 1150 | [14][36] | ||||||||||||||||||||
| 85 | 15 | 3.28 | 42 | 58 | 1.00 | 82 | 15 | 3.18 | 1050 | [17][39] | ||||||||||||||||||||
| 85 | 15 | 3.88 | 42 | 58 | 1.18 | 82 | 15 | 3.74 | 1100 | [17][39] | ||||||||||||||||||||
| 85 | 15 | 4.54 | 42 | 58 | 1.39 | 81 | 14 | 4.34 | 1150 | [17][39] | ||||||||||||||||||||
| 88 | 12 | 3.82 | 49 | 51 | 1.29 | 85 | 12 | 3.68 | 1050 | [16][38] | ||||||||||||||||||||
| 88 | 12 | 4.54 | 49 | 51 | 1.54 | 84 | 11 | 4.34 | 1100 | [16][38] | ||||||||||||||||||||
| 88.5 | 11.5 | 3.74 | 50 | 50 | 1.29 | 85 | 11 | 3.61 | 1050 | [17][39] | ||||||||||||||||||||
| 88.5 | 11.5 | 4.23 | 50 | 50 | 1.46 | 85 | 11 | 4.06 | 1100 | [17][39] | ||||||||||||||||||||
| 88.5 | 11.5 | 4.71 | 50 | 50 | 1.63 | 85 | 11 | 4.5 | 1150 | [17][39] | ||||||||||||||||||||
| 88.5 | 11.5 | 7.4 | 51 | 49 | 2.66 | 82 | 11 | 6.89 | 1200 | [23][62] | ||||||||||||||||||||
| 90 | 10 | 4.2 | 54 | 46 | 1.54 | 86 | 10 | 4.03 | 1100 | [20][57] | ||||||||||||||||||||
| 90 | 10 | 4.4 | 54 | 46 | 1.61 | 86 | 10 | 4.21 | 1150 | [20][57] | ||||||||||||||||||||
| 90 | 10 | 4.7 | 54 | 46 | 1.73 | 86 | 10 | 4.49 | 1200 | [20][57] | ||||||||||||||||||||
| 92 | 8 | 4.2 | 60 | 40 | 1.67 | 88 | 8 | 4.03 | 1050 | [17][39] | ||||||||||||||||||||
| 92 | 8 | 4.62 | 60 | 40 | 1.84 | 88 | 8 | 4.42 | 1100 | [17][39] | ||||||||||||||||||||
| 92 | 8 | 4.97 | 60 | 40 | 1.99 | 88 | 8 | 4.73 | 1150 | [17][39] | ||||||||||||||||||||
5. Solubility Model of RE2O3-REF3-LiF System