Your browser does not fully support modern features. Please upgrade for a smoother experience.
Submitted Successfully!
 +1 credit
Thank you for your contribution! You can also upload a video entry or images related to this topic.
For video creation, please contact our Academic Video Service.
| Version | Summary | Created by | Modification | Content Size | Created at | Operation |
|---|---|---|---|---|---|---|
| 1 | Jorge Antonio Custodio-Mendoza | -- | 3715 | 2023-10-23 10:04:09 | | | |
| 2 | Fanny Huang | Meta information modification | 3715 | 2023-10-26 07:34:15 | | |
Video Upload Options
We provide professional Academic Video Service to translate complex research into visually appealing presentations. Would you like to try it?
Cite
If you have any further questions, please contact Encyclopedia Editorial Office.
Custodio-Mendoza, J.A.; Ares-Fuentes, A.M.; Carro, A.M. Microextraction Techniques in Lipid Peroxidation Product Detection. Encyclopedia. Available online: https://encyclopedia.pub/entry/50666 (accessed on 23 July 2026).
Custodio-Mendoza JA, Ares-Fuentes AM, Carro AM. Microextraction Techniques in Lipid Peroxidation Product Detection. Encyclopedia. Available at: https://encyclopedia.pub/entry/50666. Accessed July 23, 2026.
Custodio-Mendoza, Jorge A., Ana M. Ares-Fuentes, Antonia M. Carro. "Microextraction Techniques in Lipid Peroxidation Product Detection" Encyclopedia, https://encyclopedia.pub/entry/50666 (accessed July 23, 2026).
Custodio-Mendoza, J.A., Ares-Fuentes, A.M., & Carro, A.M. (2023, October 23). Microextraction Techniques in Lipid Peroxidation Product Detection. In Encyclopedia. https://encyclopedia.pub/entry/50666
Custodio-Mendoza, Jorge A., et al. "Microextraction Techniques in Lipid Peroxidation Product Detection." Encyclopedia. Web. 23 October, 2023.
Copy Citation
Lipid peroxidation, the most aggressive reaction in food, results in the formation of reactive organic compounds that detrimentally impact food sensory qualities and consumers’ health. While controlled lipid peroxidation can enhance flavors and appearance in certain foods, secondary peroxidation products lead to sensory deterioration in a variety of products, such as oils, alcoholic beverages, and meat. Dispersive liquid-liquid microextraction (DLLME), solid-phase microextraction (SPME), and gas-diffusion microextraction (GDME). These techniques offer efficient and sensitive approaches to extracting and quantifying lipid oxidation products and contribute to the understanding of oxidative deterioration in various food products.
food analysis
gas-diffusion microextraction
lipid peroxidation
dispersive liquid-liquid microextraction
solid-phase microextraction
1. Introduction
Lipid peroxidation, autooxidation, or oxidative rancidity, is the most aggressive reaction in food that results in the formation of reactive organic compounds [1]. These compounds have an adverse effect on the sensory qualities of food and can potentially harm consumer health [1][2]. Lipid peroxidation is driven by the complex interaction of polyunsaturated fatty acids (PUFA) with reactive oxygen species (ROS) (Figure 1), resembling free radical reactions [3]. Exposure to factors like light, heat, or metallic ions initiates the process by releasing hydrogen atoms, forming radical carbonations. These radicals rearrange to create conjugated systems [1][2][4]. Atmospheric oxygen reacts with these conjugated dienes, generating peroxide radicals that sustain the chain reaction [3][4]. Although lipid peroxides are relatively stable, further degradation occurs through heat or metal ions, resulting in more stable secondary products [3][5]. The extent of autooxidation varies based on factors such as storage conditions, oxygen levels, and lipid composition, with the number of unsaturated bonds in the fatty acid influencing the susceptibility [5][6][7].
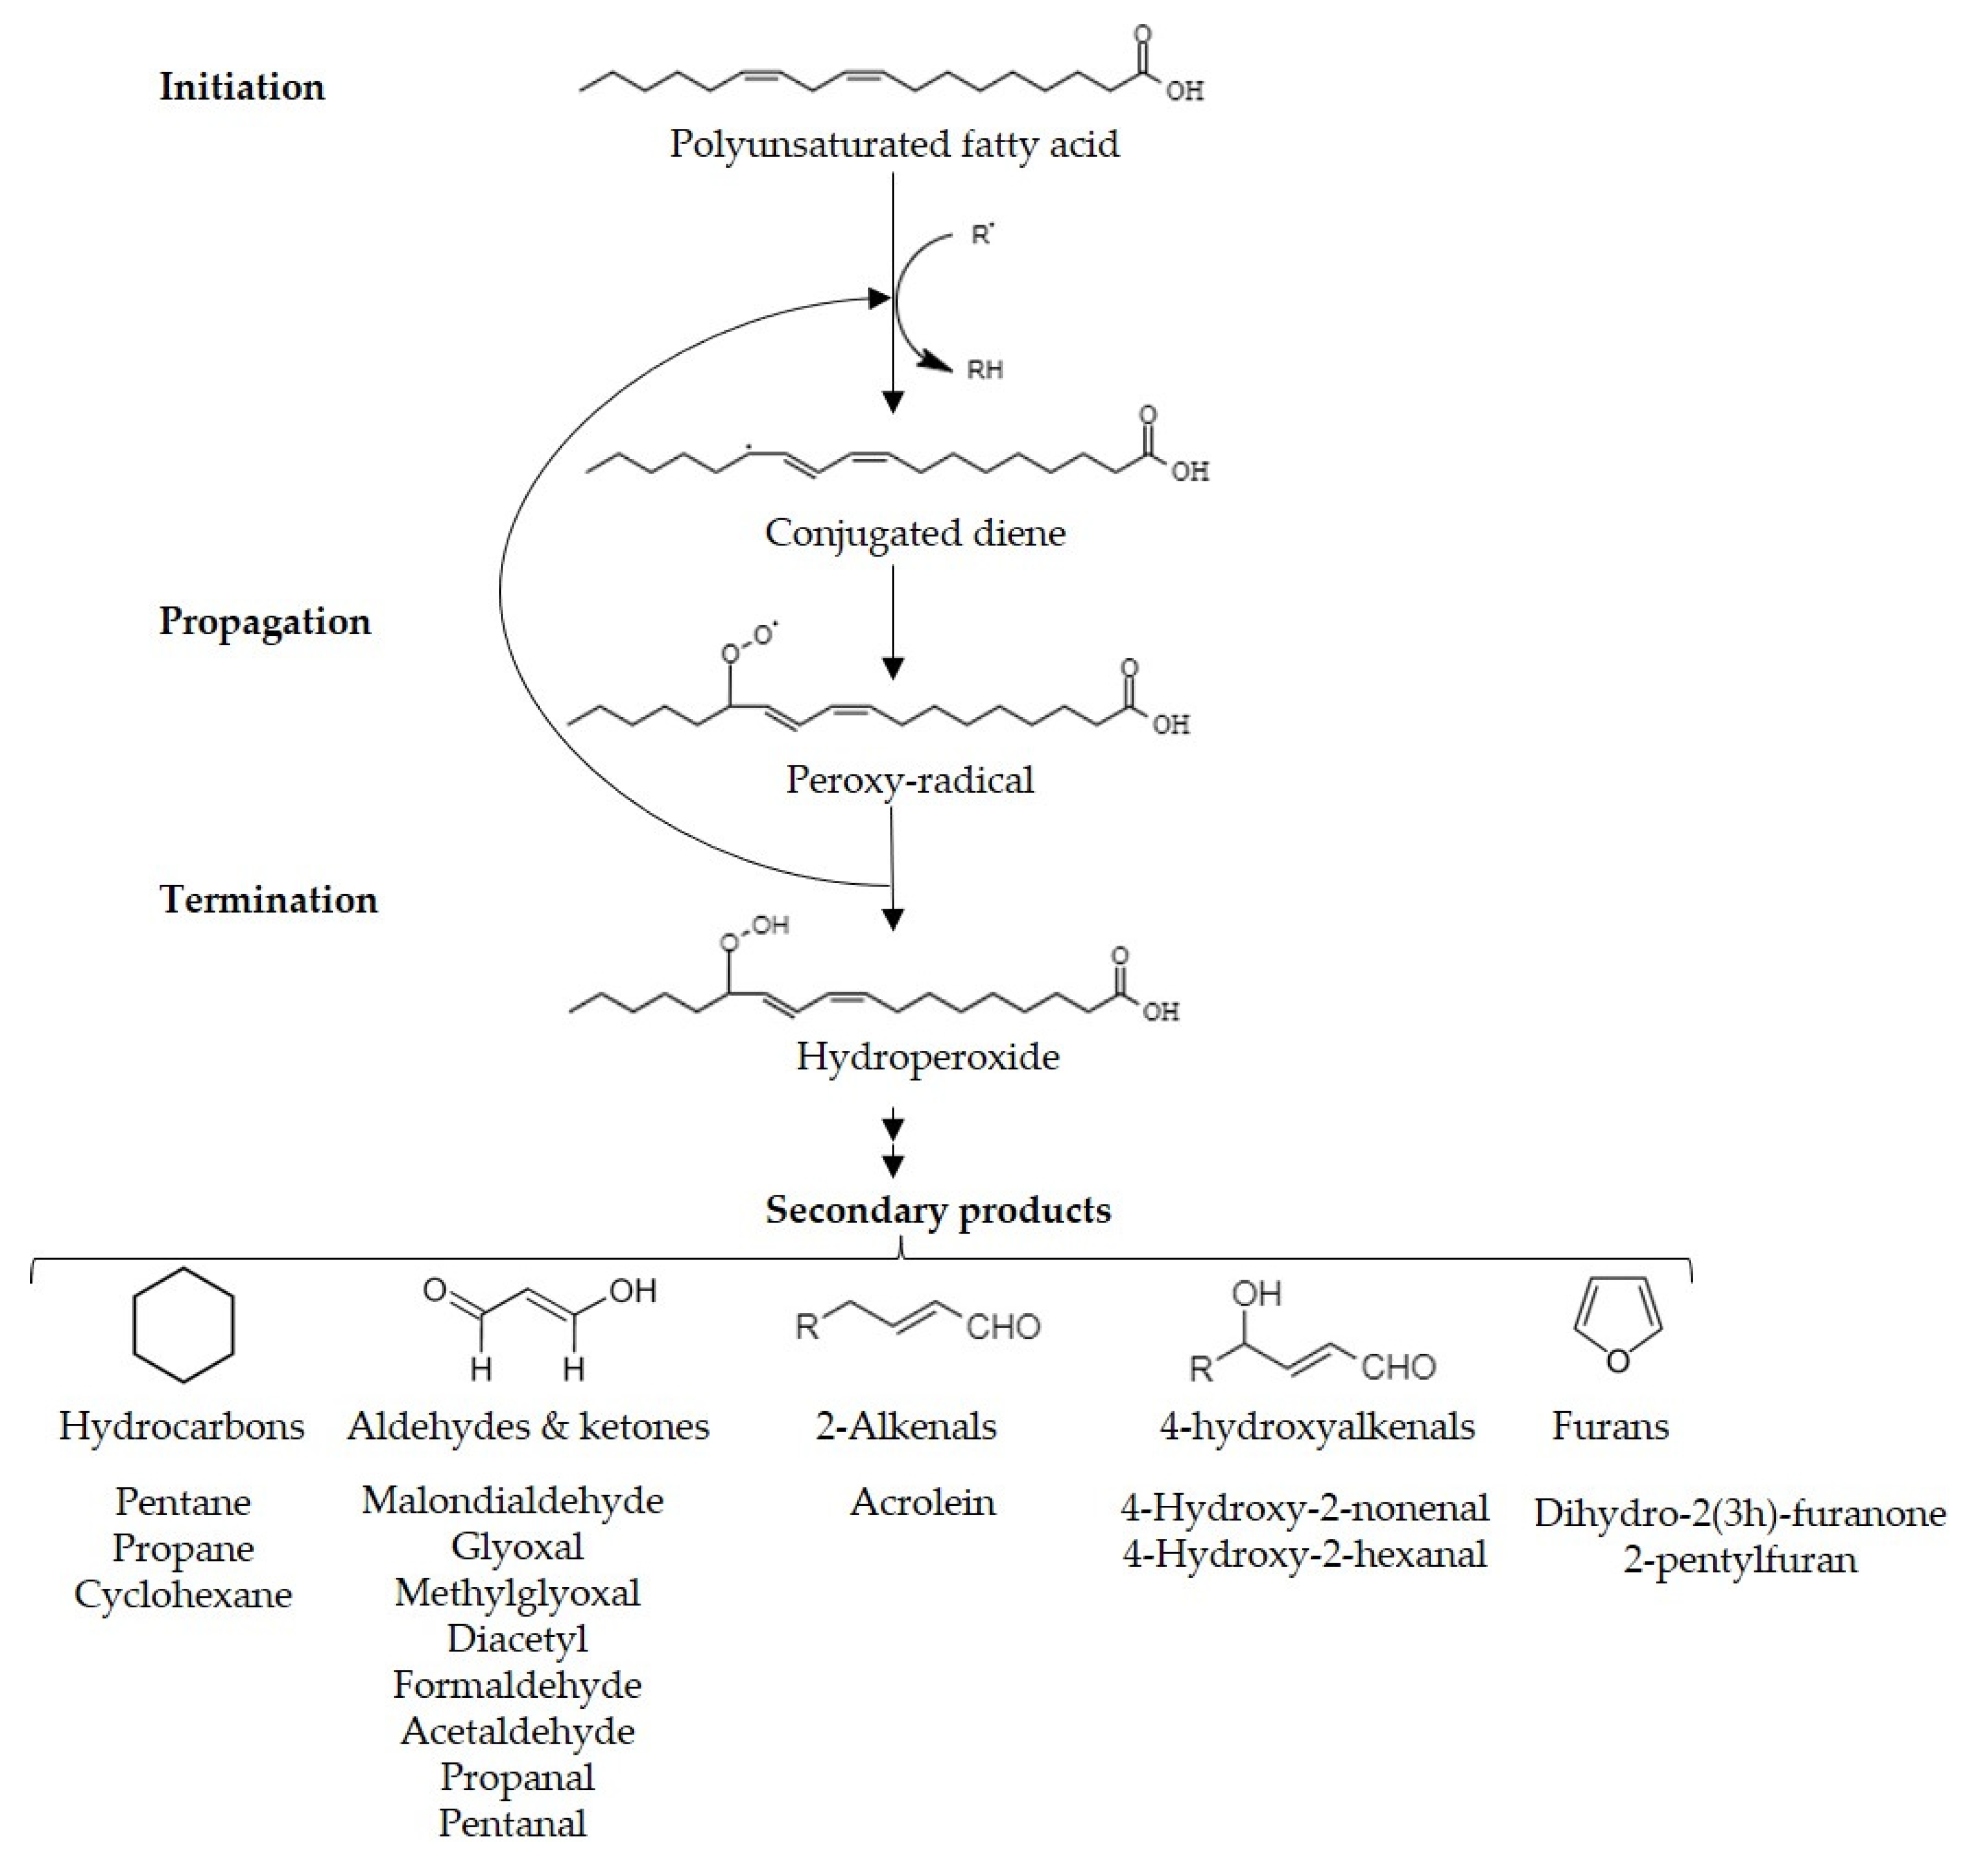
Figure 1. Pathway of lipid peroxidation.
Controlled lipid peroxidation possesses positive effects, enhancing the flavors in certain products like aged cheese, roasted coffee beans, and toasted nuts [8][9]. However, secondary lipid peroxidation products can lead to sensory deterioration and off flavors in various foods, including oils, alcoholic beverages, meat, milk, and dairy products [9][10][11][12][13]. The susceptibility to autooxidation varies among different edible oils, with olive oil’s resistance attributed to its high phenolic content [10][14]. Alcoholic beverages, such as wine and beer, can develop lipid peroxidation products due to the interaction of PUFA in the raw materials with lipid peroxidation factors during production and fermentation [15][16]. Yeast metabolism in alcohol fermentation can also contribute to generating ROS, accelerating oxidative rancidity [17]. Extended periods of aging and storage, common in wines, further expose them to oxidative conditions [18]. Meat products, processed through grinding, cutting, and packaging, expose more surface area to ROS, promoting lipid peroxidation, which is exacerbated by extended storage times, especially under improper conditions [12][19]. Additionally, food products made from meat or fish are high in protein, PUFA and monounsaturated fatty acids (MUFA), and salt can experience protein deterioration due to primary (hydroperoxides) and secondary (aldehydes, ketones) lipid oxidation products reacting with free proteins, peptides, and amino acids [12][19].
Excessive lipid peroxidation can have adverse health effects by producing secondary peroxidation products that interact with biomolecules (proteins, peptides, nucleic acids, and other lipids) within cells, potentially leading to toxic and mutagenic effects [1][2][3].
These secondary lipid peroxidation products can follow two pathways: they can break down into carbonyl compounds like aldehydes, ketones, and alcohols [1][2], or undergo cyclization to form malondialdehyde, which can then dehydrate into acrolein [20].
The International Agency for Research on Cancer (IARC) classifies certain secondary peroxidation products based on their potential carcinogenic hazards to humans [21]. This classification (Table 1) categorizes compounds according to their level of evidence as carcinogens into different groups: Category 1, indicating sufficient evidence of its carcinogenicity to humans, Category 2A, suggesting they are probably carcinogenic to humans based on limited evidence. Category 2B, indicating that they are possibly carcinogenic to humans, supported by limited evidence, and Category 3, indicating insufficient evidence for their carcinogenicity.
Table 1. Classification of secondary lipid peroxidation products based on their carcinogenetic and recommended exposure levels.
| Secondary Product | CAS Number | IARC Category | Tolerable Daily Intake µg/Kg bw/Day |
Reference | |
|---|---|---|---|---|---|
| Saturate Carbonyls | Formaldehyde | 50-00-0 | 1 | 150 | [22] |
| Acetaldehyde | 75-07-0 | 2B | 185 a | [23] | |
| Hexanal | 66-25-1 | - | 780 * | [24] | |
| α,β-Unsaturated Carbonyls | Acrolein | 107-02-8 | 2A | 7.5 | [25] |
| 4-hydroxy-2-nonenal | 75899-68-2 | 3 | 1.5 ** | [26] | |
| 4-hydroxy-2-hexenal | 17427-21-3 | 3 | 1.5 ** | [26] | |
| Acrylamide | 79-06-1 | 2A | NE | [27] | |
| Crotonaldehyde | 4170-30-3 | 2B | - | - | |
| Dicarbonyls | Malondialdehyde | 102-52-3 | 3 | 30 ** | [26] |
| Glyoxal | 107-22-2 | - | 200 | [28] | |
| Methylglyoxal | 78-98-8 | 3 | - | - | |
| Diacetyl | 431-03 | - | 900 * | [28] | |
| Furans | Dihydro-2(3H)-furanone | 96-48-0 | 3 | - | - |
| Furfural | 98-01-1 | 3 | 500 | [29] | |
IARC, International Agency for Research on Cancer; bw, body way; a Acceptable intake reported at µg/day; * Acceptable daily intake; ** Threshold of toxicological concern set by The International Programme on Chemical Safety (IPCS); NE, non-established.
Additionally, the European Food Safety Authority (EFSA) establishes tolerable daily intake values based on available toxicological information [26][27][28][29][30]. In cases where toxicological data are lacking for certain secondary peroxidation products, safety measures such as Acceptable Daily Intake (ADI) or Threshold of Toxicological Concern (TTC) can be applied [31].
Quantifying primary peroxidation products is challenging due to their reactivity and volatility [32]. Therefore, the measurement of secondary lipid peroxidation products is commonly used as biomarkers to monitor oxidative stress within cells [33]. Additionally, these products can serve as markers of food quality to assess the oxidative state of food products [34]. Various analytical techniques have emerged in recent years for analyzing and quantifying carbonyl compounds, with applications in food, biological, and environmental studies [33][35]. These methods primarily involve spectrometry and chromatography technologies [35]. A direct measurement of carbonyl compounds offers non-destructive and specific approaches, minimizing sample contamination risks due to their natural occurrence [35][36][37][38]. Direct methods for carbonyl compound analyses in food mainly employ flame ionization detectors (FID) and electron capture detectors (ECD). However, they may have increased detection limits due to potential analyte degradation within the detector [36][37][38]. In contrast, indirect methods offer a way to detect secondary peroxidation products by forming carbonyl adducts, which are determined using ultraviolet (UV), fluorescence (FLD), and mass spectrometry (MS) [10][39][40][41][42][43].
The traditional thiobarbituric acid (TBA) reactive substances (TBARS) assay has been employed to determine carbonyl compounds as lipid peroxidation products in biological and food samples [39]. This assay involves the reaction with TBA to form a chromophore detectable by spectrophotometric methods [39][43]. However, TBARS lack specificity due to interactions with various organic compounds [39]. Therefore, some applications incorporate a separation step, often via liquid chromatography (LC), before determination [43]. Other derivatization reagents, such as hydrazines, react with carbonyl compounds to form hydrazones, detectable spectroscopically after LC or gas chromatography-mass spectrometry (GC-MS) [40][41][42]. Phenyl hydrazine (PH) and derivatives such as 2,4-Dinitrophenylhydrazine (DNPH) and 2,3,4,5,6-pentafluorophenylhydrazine (PFPH) are commonly used for this purpose [40][41][42].
The choice of a sample preparation method depends on various factors, including the sample’s state (solid, liquid, gas), size, the analytical technique used, the type of analysis, properties of the analyte, and its initial concentration [44]. Traditional sample preparation methods often involve significant quantities of organic solvents, multiple steps, and result in substantial waste and time consumption [45]. An ideal sample preparation method should be simple, time efficient, cost effective, rugged, potentially automated, and align with the principles of green analytical chemistry, with a focus on minimizing sample, solvent, and waste usage [44][45]. Furthermore, simultaneous derivatization and extraction can reduce the overall analysis time while enhancing sensitivity and specificity [46]. In response to these needs, novel microextraction-based methods have emerged. Microextraction involves using a small volume of an extracting phase compared to the sample volume [47][48][49][50]. While it may not achieve exhaustive extraction, it significantly increases the concentration of the analyte in the extractive phase, reducing solvent usage [47][48][49][50]. The efficiency of microextraction depends on how the analyte partitions between the matrix and the extractive phase [51]. Since partitioning is not affected by analyte concentration, quantification is based on the absolute amount extracted [52]. The affinity of the analyte for the extraction phase determines the quantity extracted [51][52]. Moreover, microextraction operates on equilibrium, where extraction time determines the system’s equilibrium position [53]. Once equilibrium is reached, no further analyte extraction occurs [51][52][53]. Microextraction can also serve as a pre-concentration step before analysis [49][50][51].
Microextraction techniques, including dispersive liquid-liquid microextraction (DLLME), solid-phase microextraction (SPME), and gas-diffusion microextraction (GDME), have gained prominence in the analysis of lipid peroxidation in food. These techniques provide efficient and sensitive approaches to extracting and quantifying lipid oxidation products, thereby contributing to understanding the oxidative deterioration of food products.
2. Gas Diffusion Microextraction
GDME (Figure 2) was introduced to the scientific community through the Journal of Separation Science in 2010 [48].
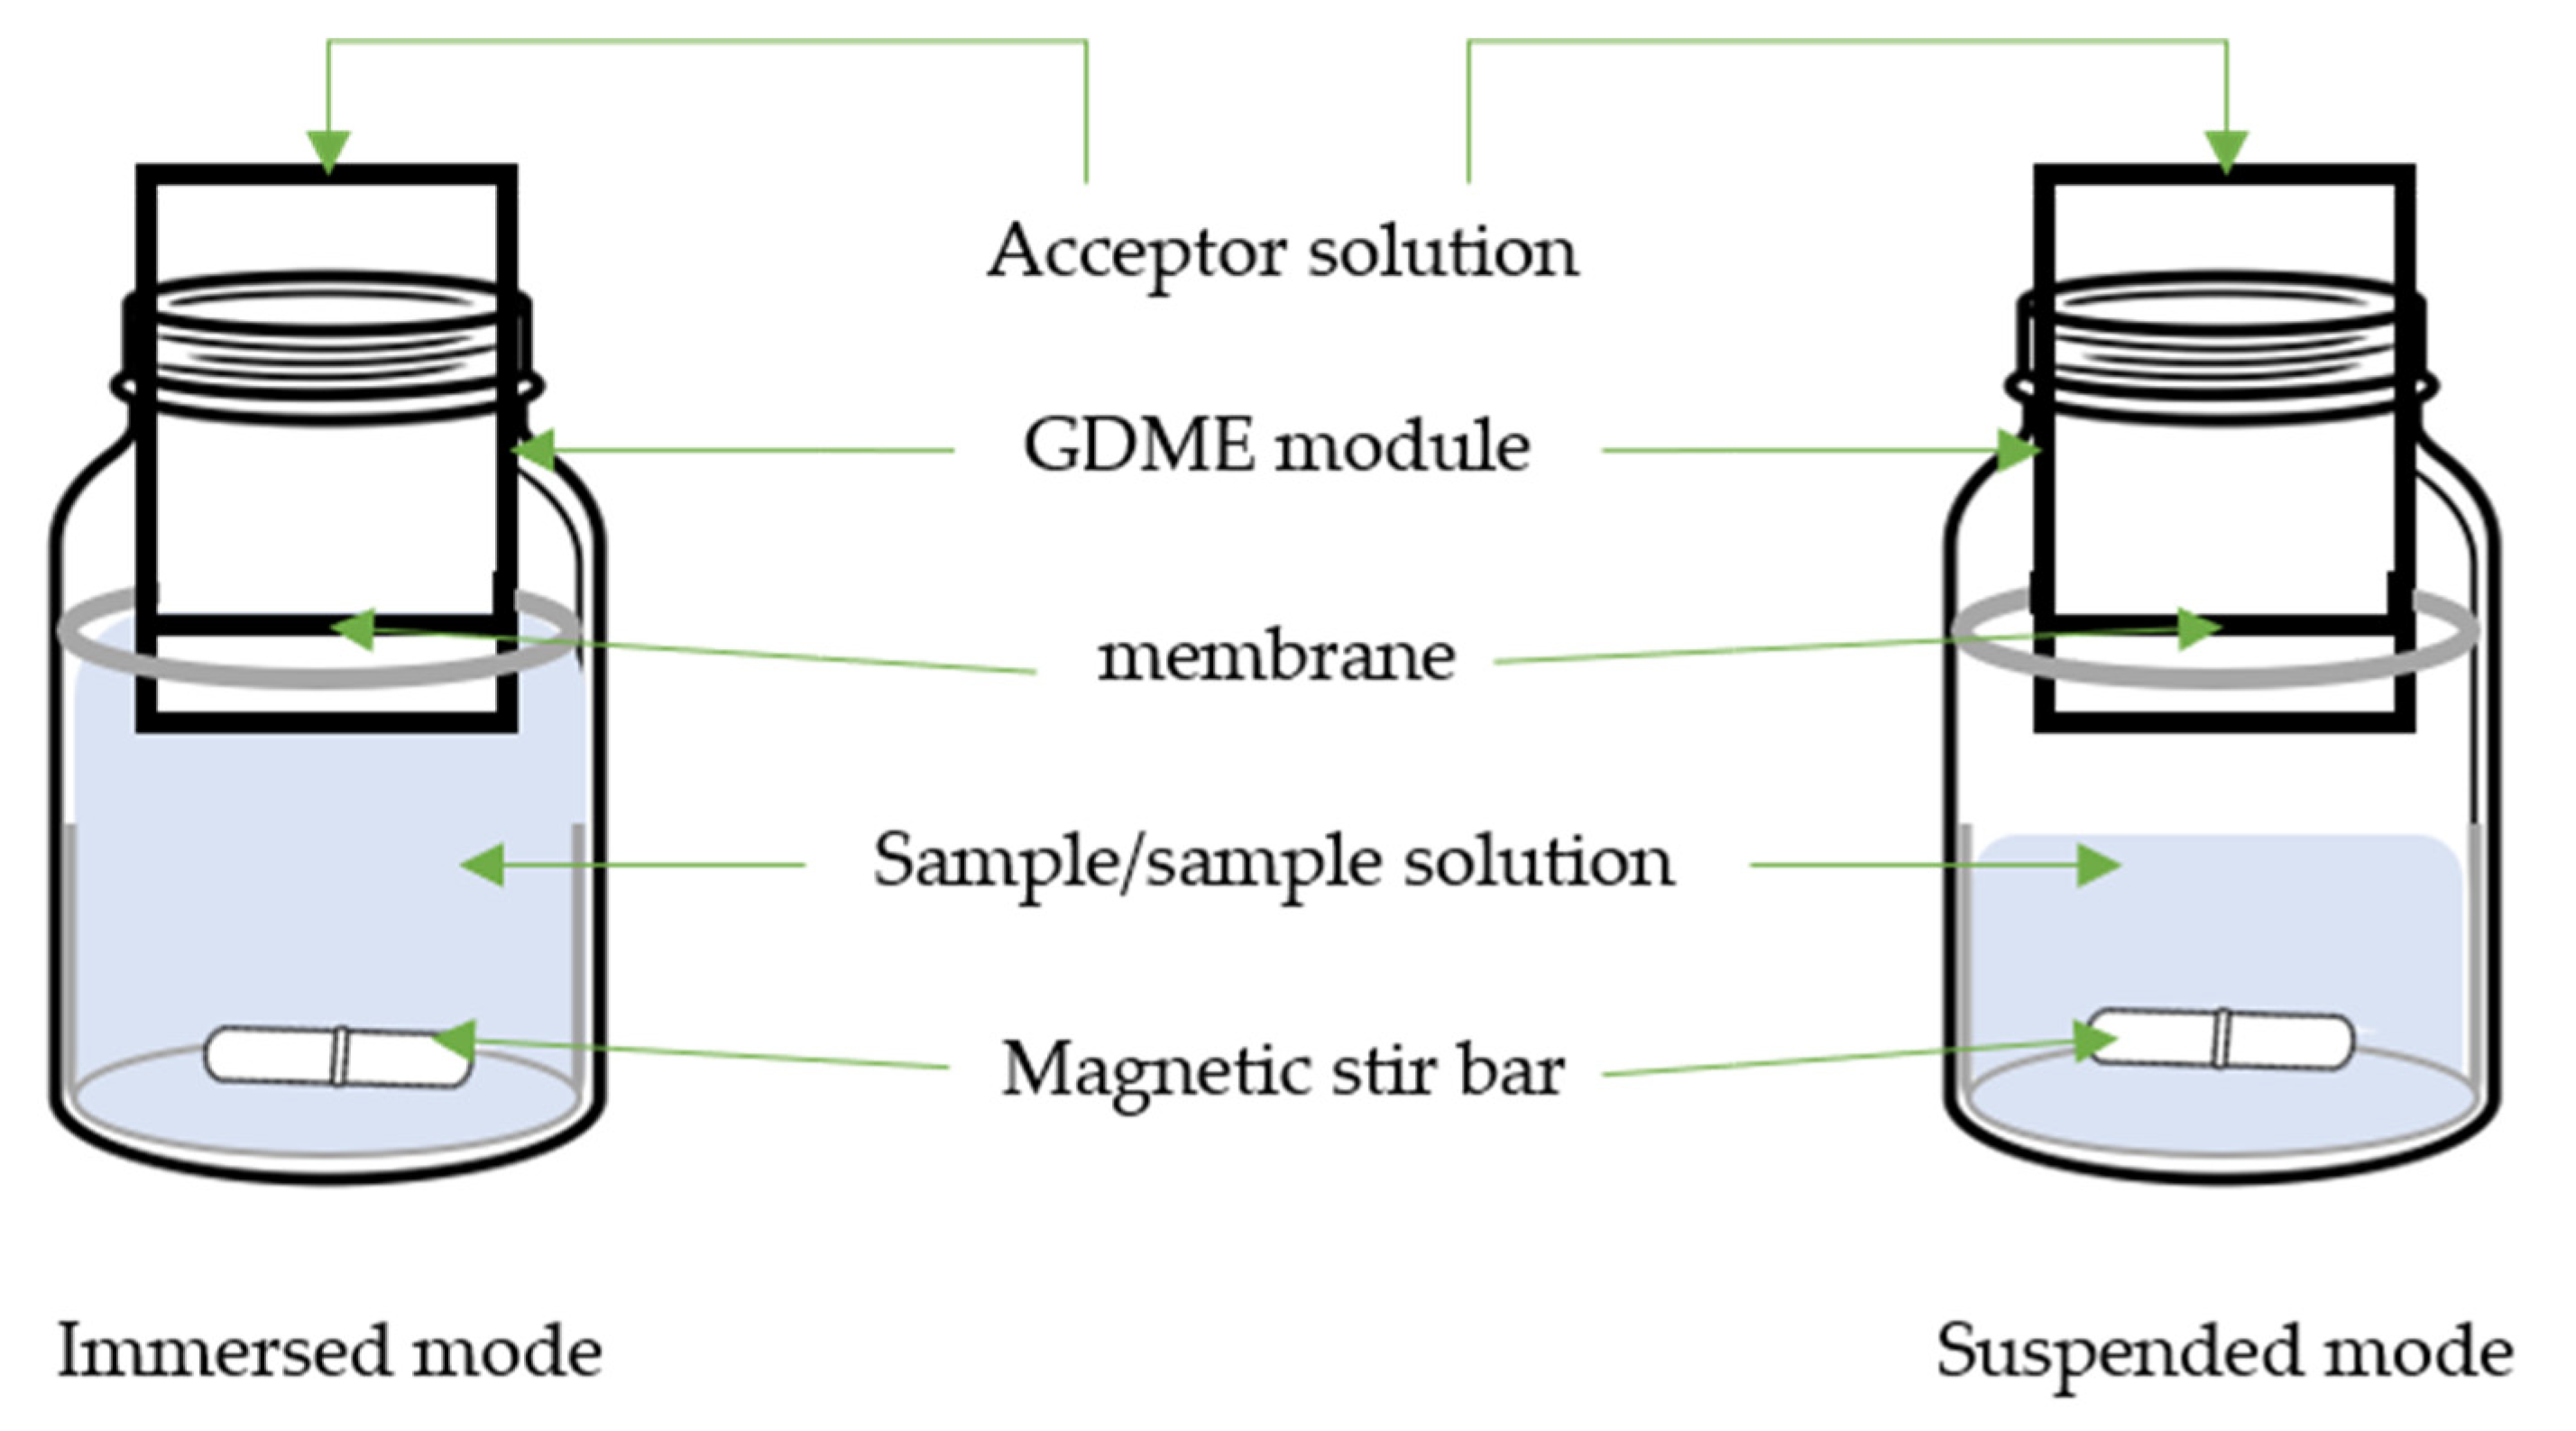
Figure 2. Scheme of gas-diffusion microextraction (GDME).
GDME is a versatile and efficient technique offering several advantages in addressing food matrices complexities. Its selective extraction capability allows the isolation of specific target compounds from complex mixtures, ensuring precise analysis even in interfering components. GDME operates through passive diffusion, with target compounds migrating from the sample matrix into an acceptor phase, usually a liquid solution containing a derivative reagent. This process involves placing the acceptor phase in the GDME module containing a microporous hydrophobic membrane, typically a 5.0 µm PTFE membrane, which supports the acceptor phase. Equilibrium is established between the sample and acceptor phases, and the acceptor phase is collected for analysis. GDME’s minimal sample requirements make it well suited for limited availability, while its reduced solvent usage aligns with the trend of green analytical chemistry [45]. GDME exhibits high sensitivity, when coupled with sensitive detection methods like GC-MS or high-performance liquid chromatography-ultraviolet (HPLC-UV). This empowers the quantification of trace-level compounds in food analyses [10][48][54][55][56][57][58][59][60][61][62].
From quality control to monitoring changes during storage and processing, GDME’s synergy with analytical techniques such as GC and HPLC unveils the intricacies of food composition and quality, setting its status as an indispensable tool in modern food analysis practices. Its selective enrichment capabilities enhance the detectability of compounds, making GDME valuable for trace analysis. In practice, GDME is employed for discerning volatile aroma compounds, evaluating off flavors, assessing lipid oxidation products, and analyzing a spectrum of other volatile constituents. Additionally, GDME’s non-destructive nature preserves the integrity of samples for further investigations, enhancing the versatility of its applications across various food products, including solid (bread and coffee beans), liquid (beer, wine, soy sauce), and semi-liquid (vegetable oils) foods. Table 2 presents a comparison of the methods developed for the analysis of carbonyl compounds using GDME.
Table 2. Analytical method for determination of secondary peroxidation products by gas-diffusion microextraction (GDME).
| Target Compound | Sample | GDME | Derivative Reagent | Determination | LOD µg/L or µg/Kg |
Recovery % |
Ref. | |||
|---|---|---|---|---|---|---|---|---|---|---|
| Mode | Vacceptor solution mL |
t min |
T °C |
|||||||
| 1,3-pentadione Diacetyl |
Beer | Immersed | 0.5 | 15 | 40 | O-PDA | HPLC-UV | 3.8–4.6 | - | [48] |
| 2 aldehydes & Furfural |
Beer | Immersed | 0.75 | 5 | 30 | DNPH | HPLC-UV | 1.5–12.3 | - | [54] |
| 5 aldehydes | Beer | Suspended | 0.5 | 20 | 40 | HBA | HPLC-DAD | 1.2–1857.7 | >96% | [55] |
| Diacetyl 1 | Wine | Immersed | 0.4 | 20 | 65 | O-PDA | HPLC-UV | 3.8 | - | [56] |
| Acetaldehyde 1 | Wine | Immersed | 1.0 | 15 | 50 | DNPH | HPLC-UV | 800–1100 | - | [57] |
| Diacetyl | Wine & beer | Suspended | 1.0 | 10 | 60 | O-PDA | DPV | 0.053 | - | [58] |
| α-DCC | Wine; black tea & soy sauce | Immersed 2 | 0.5 | 10 | 55 | O-PDA | HPLC-UV | 50–200 | - | [59] |
| MDA | Vegetable oil | Suspended | 0.5 | 30 | 65 | TBA | HPLC-UV/FLD | 250–350 | ≥82% | [60] |
| 4 aldehydes Acrolein & MDA | Vegetable oil | Suspended | 1.0 | 10 | 60 | DPNH | GC-MS | 50–100 | ≥95% | [10] |
| 2 ketones & diacetyl | Ground bread | Suspended | 0.5 | 15 | 65 | O-PDA | HPLC-UV | 6–12 | - | [61] |
| 27 carbonyl compounds 3 | Green & roast coffee beans | Suspended | 0.5 | 16 | 40 | O-PDA | HPLC-DAD | 50–200 | - | [62] |
1 free and total; 2 0.22 um PVDF membrane; 3 Qualitative analysis; LOD, limit of detection; Ref., reference; DNPH, 2,4-dinitrophenylhydrazine; HBA, 4-hydrazinobenzoic acid; O-PDA, O-phenylenediamine; α-DCC, α-dicarbonyl compounds; MDA, malondialdehyde; TBA, 2-thiobarbituric acid; DPV, differential pulse voltammetry.
3. Solid-Phase Microextraction
SPME (Figure 3) is a well-established sample preparation technique commonly used in analytical chemistry to extract and concentrate target compounds from various sample matrices before analysis [49][51][63].
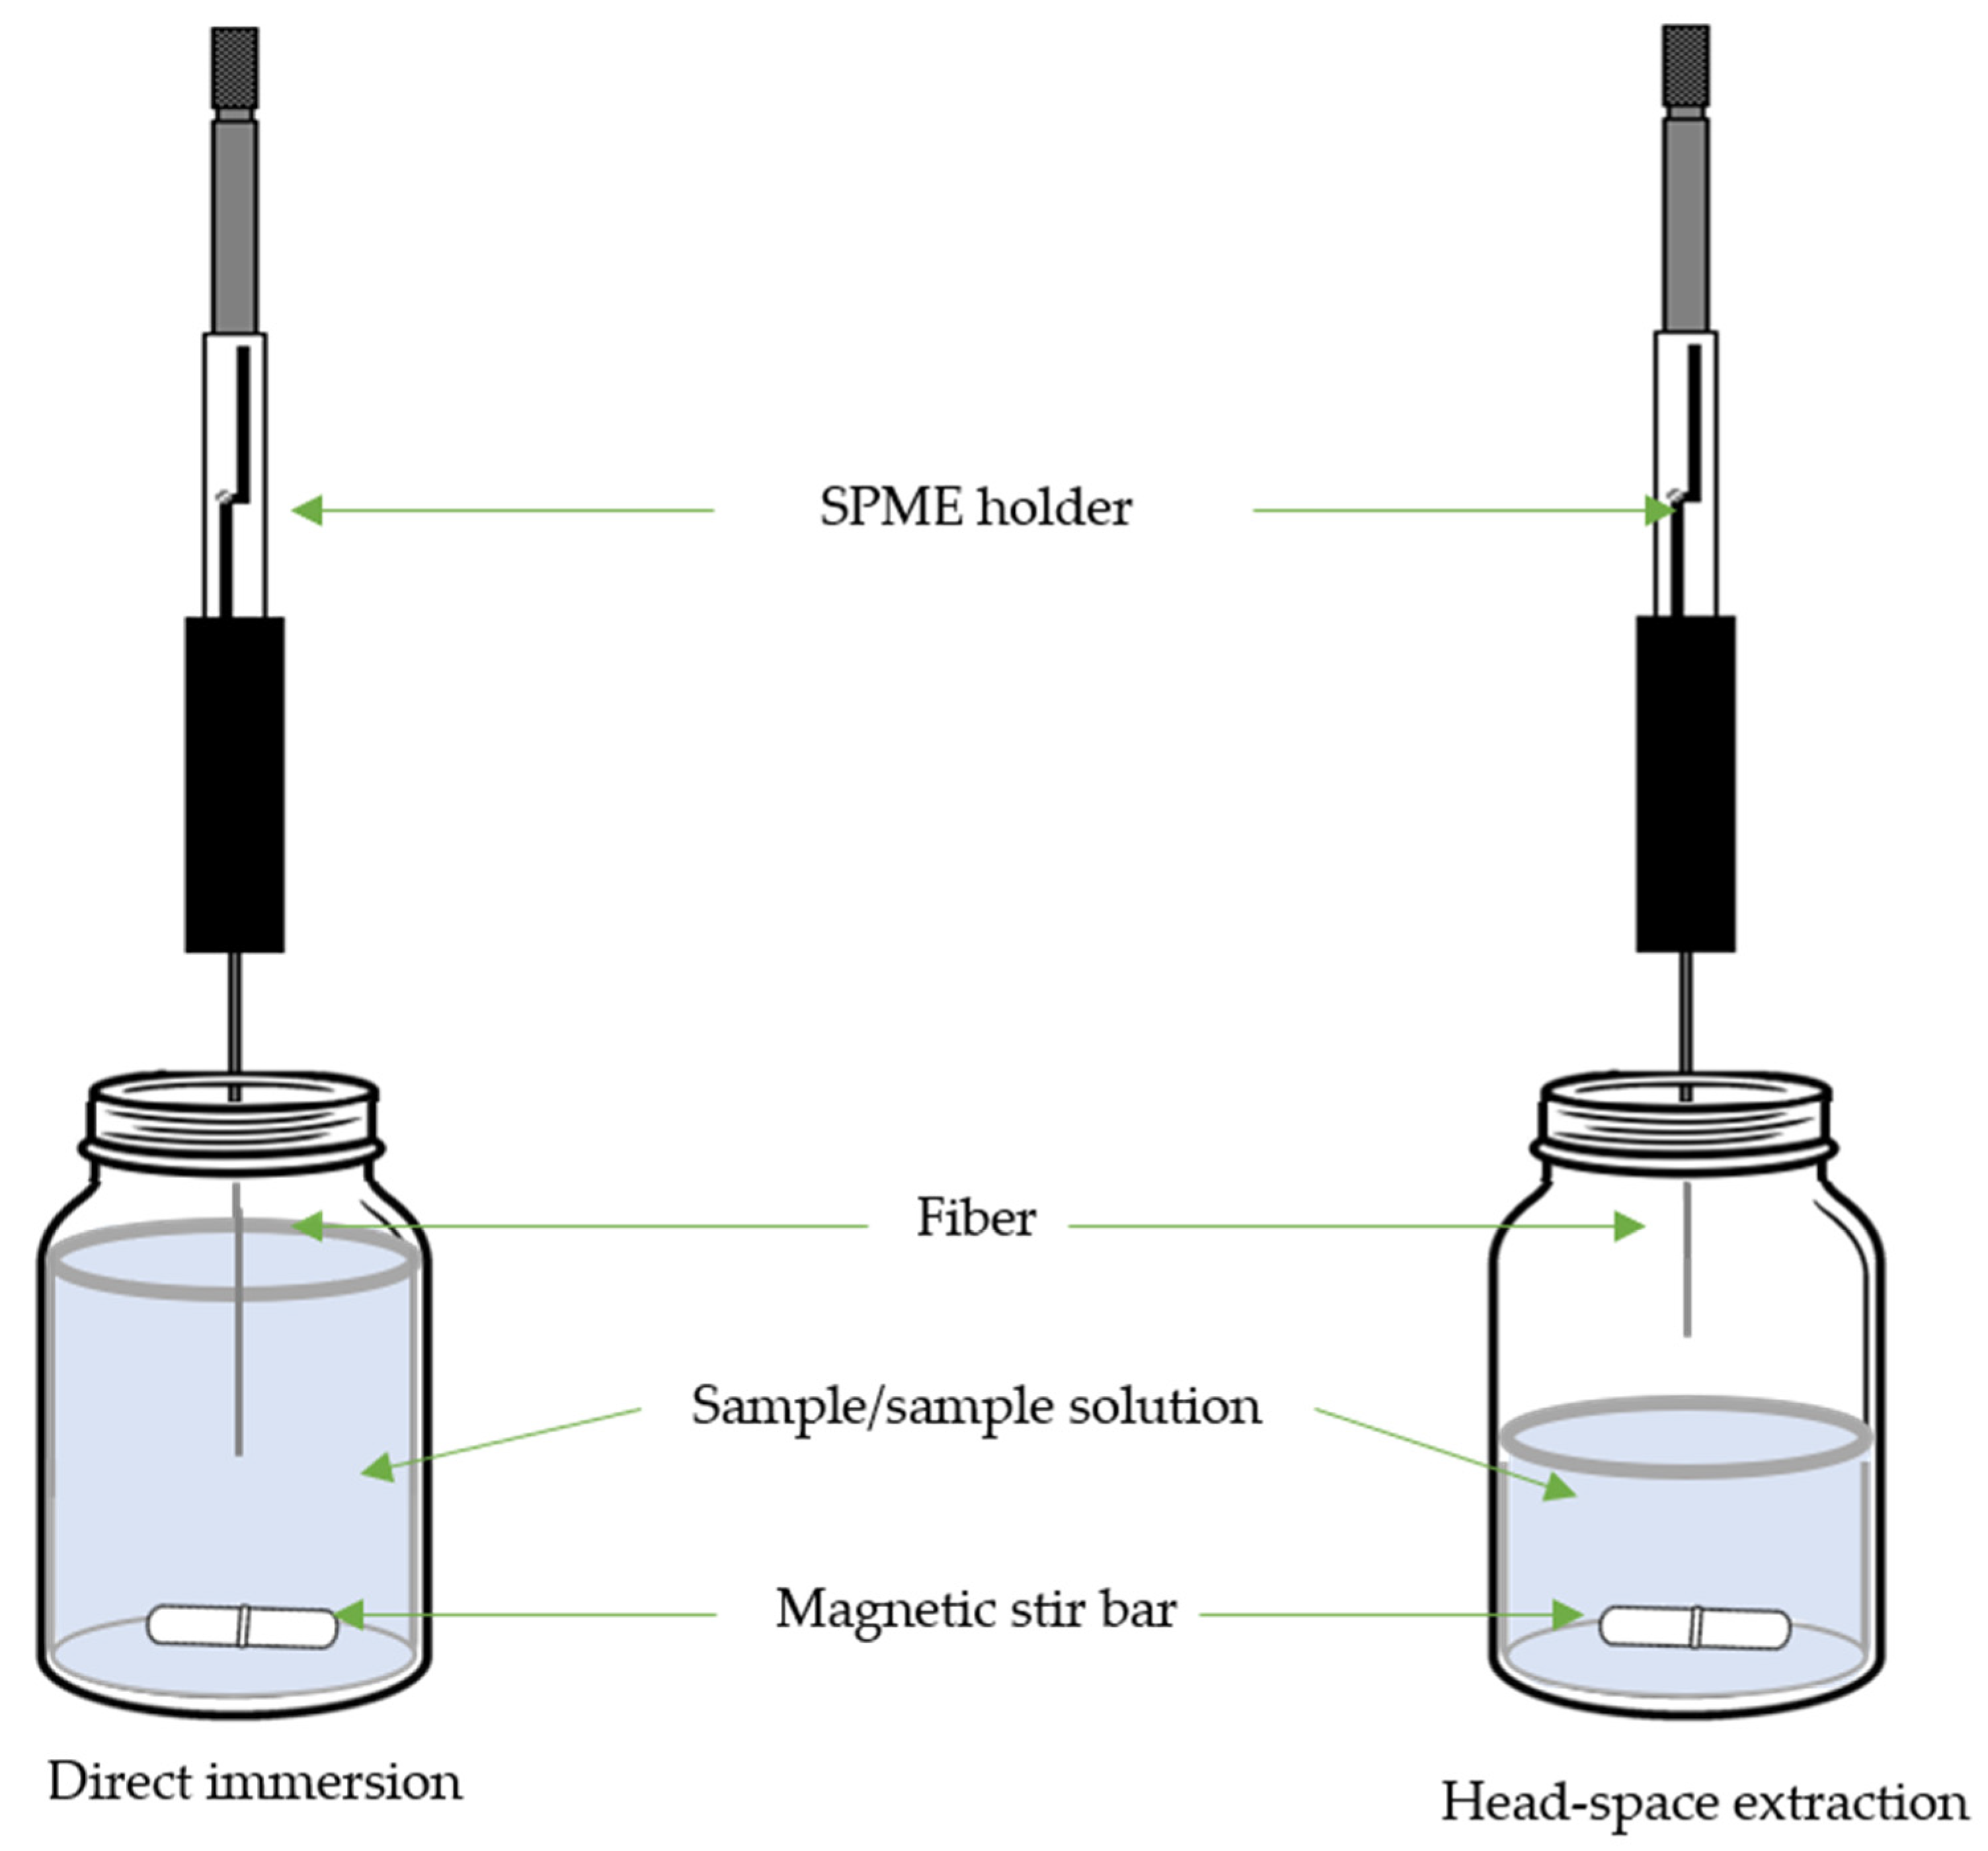
Figure 3. Scheme of solid-phase microextraction (SPME).
SPME finds particular utility in extracting volatile and semi-volatile compounds from complex matrices, especially in food analysis. SPME involves a fiber coated with a thin layer of an absorbent material, which is exposed to the sample to extract the analytes of interest [49][63]. The SPME process comprises several key steps: equilibration, when the SPME fiber is exposed to the sample (either in immersed mode or sample headspace) to allow analytes to partition between the sample matrix and the fiber coating, adsorption, when the analytes are absorbed onto the fiber coating, concentrating them from the sample matrix, and desorption of the analytes from the fiber coating to the analytical instrument for analysis [63].
The application of SPME for analyzing lipid peroxidation products is well justified due to its selective extraction capabilities, which minimize interference from complex matrices. SPME simplifies sample preparation by concentrating trace amounts of these compounds, enhancing sensitivity, and eliminating the need for extensive cleanup steps [49][63]. Furthermore, its reduced solvent usage aligns with environmental concerns [63]. SPME’s adaptability to various sample types enables real-time monitoring, making it versatile for studying lipid peroxidation in biological, food, and other samples [49][63]. Its compatibility with quantitative and qualitative analytical techniques, coupled with its ability to mitigate matrix effects, further underlines its value as a technique for accurate and comprehensive lipid peroxidation product analysis (Table 3).
Table 3. Analytical methods for determination of secondary peroxidation products by solid-phase microextraction (SPME).
| Target Compound | Sample | SPME | Derivative Reagent | Determination | LOD µg/L or µg/Kg |
Recovery % |
Ref. | ||||
|---|---|---|---|---|---|---|---|---|---|---|---|
| Mode | t min |
T °C |
Fiber | Tdesorption °C |
|||||||
| 14 aldehydes & ketones | Vegetable oil | HS | 30 | 20 | DVB/CAR/PDMS | 270 | - | GC-FID & GC-MS | 0.04–2.24 | - | [64] |
| 4-HNE | Oils & porcine liver | DI | 15 | 40 | PDMS/DVB | DNPH | HPLC-SP | 0.001–1.42 | 66–87% | [65] | |
| MDA | Cod liver oil | HS | 10 | RT | PDMS/DVB | 200 | N-MH | GC-NPD | 0.74 | 91% | [66] |
| Hexanal | Hazelnut | HS | 10 | 60 | CAR/PDMS | 300 | - | GC-FID | 8.01 | - | [67] |
| 7 aldehydes | Peanut, soybean and olive oils | HS | 15 | 50 | CAR/PDMS | 250 | - | GC-FID | 4.6–10.2 | 85–110 | [68] |
| 3 α,β-UC | Sunflower oil digestion phases | HS | 60 | 50 | DVB/CAR/PDMS | 250 | - | GC-MS | - | - | [69] |
| 100 carbonyl compounds | Cod liver oil | HS | 60 | 50 | DVB/CAR/PDMS | 220 | - | GC-MS | - | - | [70] |
| 18 VOC | Sunflower oil emulsions | HS | 30 | 50 | DVB/CAR/PDMS | 250 | - | GC-MS | - | - | [71] |
| Aldehydes & 2-pentylfuran | Soybean oils | HS | 55 | 50 | DVB/CAR/PDMS | 250 | - | GC-MS | - | - | [72] |
| VOC | Peanut oil | HS | 40 | 50 | PDMS/DVB | 250 | - | GC-MS | - | - | [73] |
| 4 aldehydes & 1 ketone | Roast & boiled duck | HS | 40 | 45 | CAR/PDMS | 280 | - | GC-MS | - | - | [74] |
| 3 aldehydes | Chicken patties | HS | 10 | 60 | DVB/CAR/PDMS | 250 | - | GC-FID | - | - | [75] |
| Hexanal | Pig sausages | HS | 30 | 50 | DVB/CAR/PDMS | 220 | - | GC-MS | - | - | [76] |
| 2 aldehydes & 2 dialdehydes | Cod | HS | 30 | 50 | CAR/PDMS | 260 | - | GC-FID | - | - | [77] |
| 8 aldehydes | Fish | HS | 15 | 60 | PDMS/DVB | 260 | PFBHA | GC-MS | 1.4–6.1 | 79–102 | [78] |
| 6 aldehydes | Caviar | HS | 30 | 60 | DVB/CAR/PDMS | 250 | - | GC-MS | - | - | [79] |
| 198 VOCs | Dry cured meat | HS | 30 | 37 | 260 | - | GC-MS | - | - | [80] | |
| Aldehydes | Infant formula | HS | 10 | 25 | PDMS/DVB | 250 | - | GC-MS | - | - | [81] |
| 3 aldehydes & pentane | Infant formula | HS | 45 | 37 | CAR/PDMS | 250 | - | GC-FID | 0.02–1.05 | - | [82] |
| 13 Carbonyl compounds | Milk powder | HS | 45 | 43 | 250 | - | GC-MS | 2–6 | - | [83] | |
| VOC | Smoked cheese | HS | 45 | 50 | CAR/PDMS | 260 | - | GC-MS | - | - | [84] |
| VOC | Mozzarella | HS | 15 | 37 | 220 | - | GC-MS | - | - | [85] | |
| VOC | Portuguese cheese | HS | 45 | 50 | DVB/PDMS | 250 | - | GC-MS | - | - | [86] |
| 9 aldehydes | Beer | HS | 60 | 50 | PDMS/DVB | 250 | PFBHA * | GC-MS | - | 89–114 | [87] |
| 41 carbonyl compounds | Beer | HS | 40 | 60 | PDMS/DVB | 250 | PFBHA *,** | GC-MS | 0.003–20,000 | - | [88] |
| 250 carbonyl compounds | Beer | HS | 20 | 45 | PDMS/DVB | 250 | PFBAH ** | GC-ITMS | 0.003–0.510 | 88–114 | [89] |
| 6 carbonyl compound | Beer | HS | 60 | 55 | DVB/CAR/PDMS | 250 | TFEH ** | GC-MS | 0.03–0.5 | 90–105 | [16] |
| 6 carbonyl compound | Craft beer | HS | 60 | 55 | DVB/CAR/PDMS | 250 | TFEH ** | GC-MS | 0.03–0.5 | 90–105 | [90] |
| 18 carbonyl compound | Wine | HS | 45 | 40 | DVB/CAR/PDMS | 250 | - | GC-ITMS | 0.62–129.2 | 19–190 | [91] |
| 80 VOC | Wine | HS | 30 | 40 | DVB/CAR/PDMS | 240 | - | GC-MS | - | - | [92] |
| 6 carbonyl compound | Syrah wines | HS | 45 | 55 | DVB/CAR/PDMS | 250 | TFEH | GCxGC-TOFMS | 0.5–5.2 | 90–106 | [93] |
| 3 aldehydes | Must & wine | HS | 45 | 55 | DVB/CAR/PDMS | 250 | TFEH | GC-qMS | 0.1–0.8 | 90–102 | [94] |
| 38 carbonyl compound | Port wine | HS | 20 | 32 | PDMS/DVB | 250 | PFBHA | GC-MS | 0.006–0.089 | 88–119 | [95] |
| 45 carbonyl compound | Wine | HS | 20 | 40 | PDMS/DVB | 250 | PFBHA | GC-MS/MS | - | 71–146 | [96] |
| 9 aldehydes | Spirits and alcoholic beverages | DI | 15 | 20 | PDMS | 250 | PFBHA | GC-ECD | 0.05–0.5 | - | [97] |
| VOC & SVOC | Beer, wine & whisky | HS | 60 | 30 | PDMS CAR/PDMS DVB/CAR/PDMS |
250 260 260 |
- | GC-MS | - | - | [11] |
| 20 aldehydes | Green pomace distillates | HS | 40 | 55 | PDMS/DVB | 250 | PFBHA | GC-MS | 0.0007–0.02 | 76–110 | [98] |
| 107 VOC | Cider | HS | 30 | 50 | DVB/CAR/PDMS | 250 | - | GC-MS | - | - | [99] |
| 53 carbonyl compounds | Huangjiu (alcoholic beverage) | HS | 35 | 45 | DVB/CAR/PDMS | 250 | PFBHA | GC-MS/MS | - | 71–146 | [100] |
| 2 α-DCC | Soybean paste, red pepper past, soy sauce, wine, beer, distilled liquor | HS | 20 | 85 | DVB/CAR/PDMS | 240 | TFEH | GC-MS | 0.7–1.1 | 92–104 | [101] |
LOD, limit of detection; HS, headspace; 4-HNE, 4-hydroxy-2-nonenal; DI, direct immersion; DVB, divinylbenzene; CAR, carboxen®; PDMS, polydimethylsiloxane; DNPH, 2,4-dinitrophenylhydrazine; MDA, malondialdehyde; N-MH, N-methylhydrazine; α-β-UC, α-β-unsaturated carbonyl compound; VOC, volatile organic compounds; SVOC, semi volatile organic compounds; α-DCC, α-dicarbonyl compound, * on fiber derivatization, ** in-solution derivatization.
However, information on the applications of SPME in the determination of volatile compounds from lipids decomposition in foods are limited. Additionally, a notable limitation of the SPME technique is the lack of reproducibility when using different fibers, especially from different batches. Consequently, most comparative studies are carried out with a single fiber to address this limitation.
4. Dispersive Liquid-Liquid Microextraction
DLLME (Figure 4) is a miniaturized LLE technique introduced by Rezaee et al. [102]. Since its introduction in 2006, this technique garnered the interest of analysts and has been widely used for the extraction of various types of analytes from different matrices, such as water, tissues, biological fluids, and food matrices [103][104][105]. The DLLME system consists of a ternary solvent system comprising an aqueous phase containing the analytes of interest, a dispersive solvent that is miscible with both the aqueous phase and the third component of the system, which is the extracting solvent. The mixture formed by the dispersant and the extractant is rapidly injected into the aqueous solution, forming a cloudy solution. This microemulsion is composed of tiny droplets of extractant solvent dispersed in the aqueous phase, thereby increasing the contact surface between them and facilitating quick equilibrium.
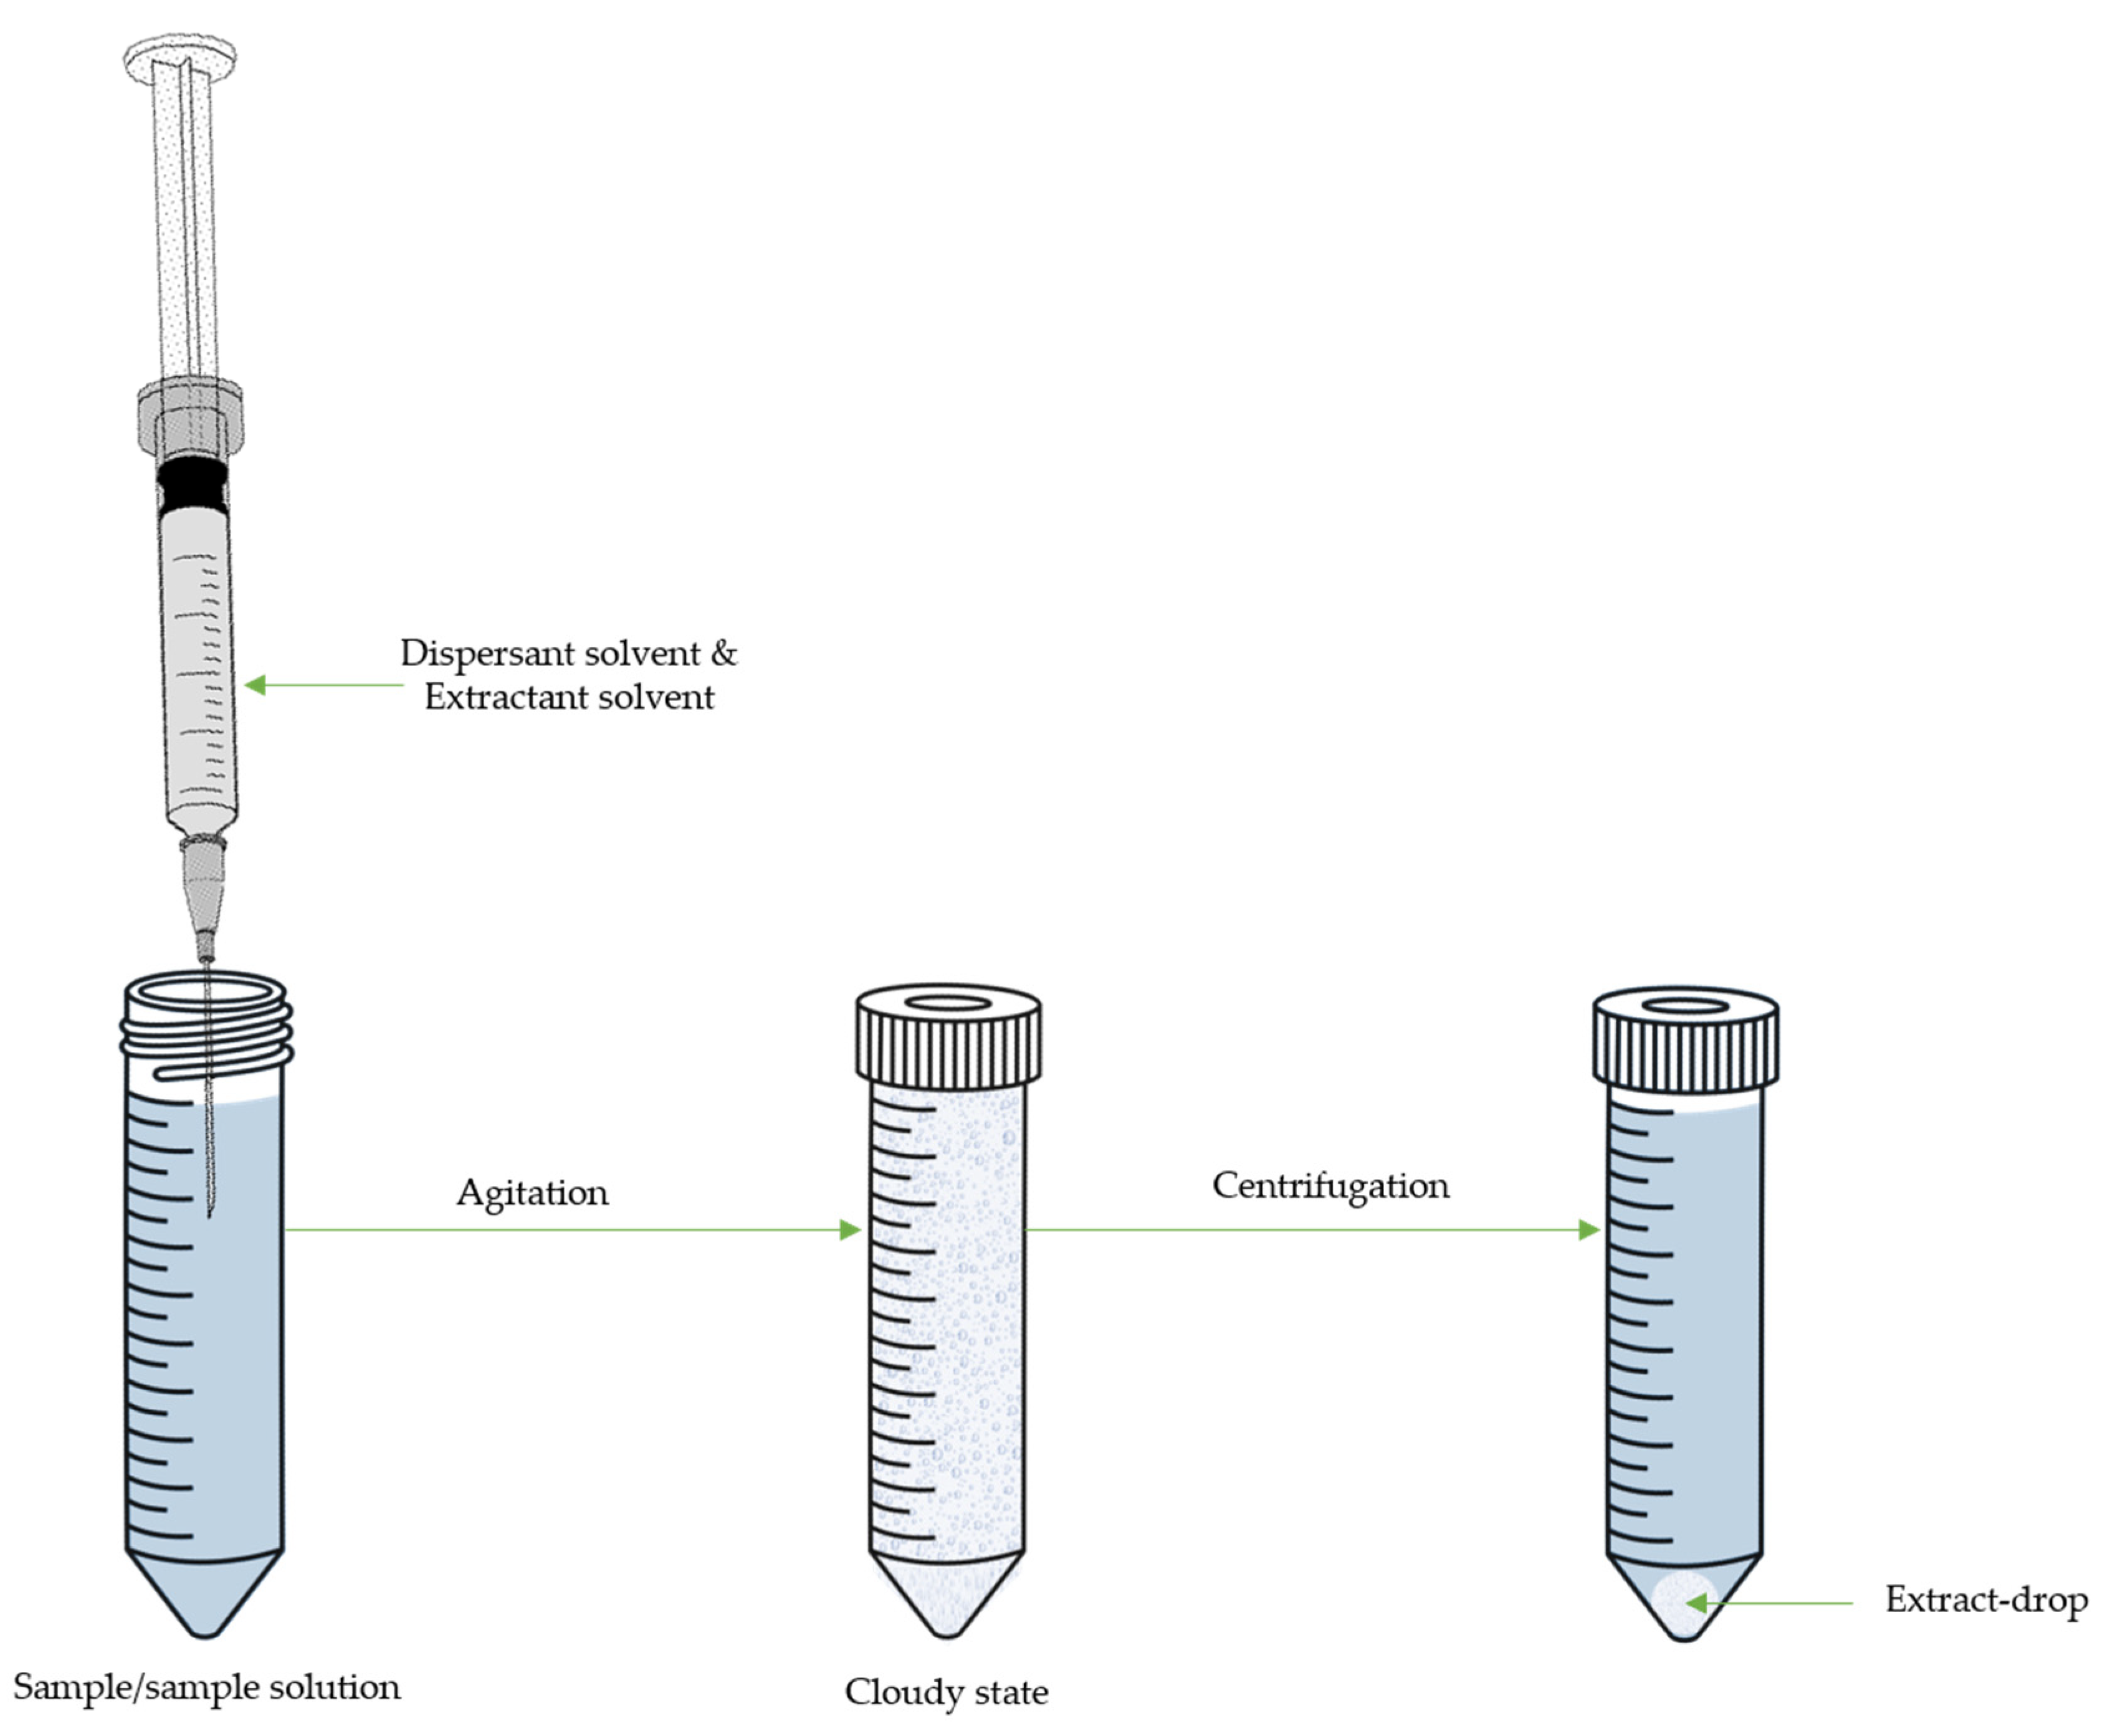
Figure 4. Scheme of dispersive liquid-liquid microextraction (DLLME).
DLLME is characterized by its simplicity, speed, efficiency, and capacity for high enrichment due to the high proportion of donor and acceptor phases. Therefore, the most important parameters of DLLME are the selection of extraction conditions and the choice of dispersive solvents for analytes extraction. An appropriate dispersive solvent must be miscible with the extraction phase and the aqueous phase to create fine droplets in the sample matrices, thus enhancing the interaction between the two phases, resulting in high extraction efficiency.
The most commonly used dispersing solvents are acetone, acetonitrile, and short-chain alcohols (such as methanol, ethanol, and propanol) [105]. The extracting solvent must possess higher density than water, high extraction capacity, and good chromatographic behavior. In classical DLLME, chlorinated solvents such as chloroform, carbon tetrachloride, chlorobenzene, or dichloromethane are the most commonly used extractive solvents. However, these solvents are toxic and harmful to the environment. Over recent years, DLLME has evolved, utilizing less toxic extracting solvents, such as ionic liquids (IL) or less dense extractant solvents than the aqueous phase, such as alcohols [104][105][106]. Ionic liquids (IL) exhibit unique properties, including negligible vapor pressure, miscibility with water and organic solvents, good solubility for organic and inorganic compounds, high temperature, stability, and respect for the environment. Additionally, they efficiently absorb and transfer microwave energy and are formed by a central molecule that combines organic cations and several anions [106][107].
Furthermore, DLLME can be coupled in a single step of in situ derivatization and extraction of analytes of interest and even combined with other extraction techniques, such as GDME or ultrasound-assisted extraction (UAE). Table 4 presents a comparison of the methods developed for the analysis of secondary peroxidation products using DLLME.
Table 4. Analytical method for determination of secondary peroxidation products by dispersive liquid-liquid microextraction (DLLME).
| Target Compound | Sample | DLLME | Derivative Reagent | Determ. | LOD µg/L or µg/Kg |
Rec. % |
Ref. | ||||
|---|---|---|---|---|---|---|---|---|---|---|---|
| Mode | Disperser | Extracting Solvent | T min |
T °C |
|||||||
| Formaldehyde | Beverages | MW-IL- | ACN | IL 3453W | 1.5 | - | DNPH | HPLC-UV | 0.12 | 85–95 | [108] |
| Acrylamide | Brewed coffee | - | ACN | DCM | - | - | - | UPLC-MS/MS | 900 | 97–106 | [109] |
| PCB and acrylamide | Milk/Coffee | IL | [HeOHMIM][Cl] | [BMIM][NTf2] | - | - | - | HS-GC-ECD-MS | - | - | [110] |
| MDA, acrolein, 4-HNE | Beverages | US | ACN | CH3Cl | 5 | 60 °C | DNPH | GC-MS | 50–200 | 94–102 | [111] |
| Formaldehyde | Milk | IL | MeOH | IL 3453W | 0.75 | 45 °C | ACAC | UV | 100 | 91–103 | [112] |
| Acrylamide | Coffee, chocolate, roasted nuts, French fries, cereals, biscuits, chips, bread, and caramelized fruit |
SSA | SUPRAS-2 (SDS/TBABr/AlCl3) |
2 | - | UV | 0.2 | 93–96 | [113] | ||
| Acrylamide | Nuts and seeds | - | PCE | EtOH | 3 | - | Xanthydrol | GC-MS | 0.6 | 95 | [114] |
| Acrylamide | Potato chips | UAE | PCE | EtOH | 2 | - | Xanthydrol | GC-MS | 0.6 | 97 | [115] |
| Acrylamide | Cereal products | - | PCE | EtOH | 1 | - | Xanthydrol | GC-MS | 0.6 | 95 | [116] |
| Acrylamide | Bread | UAE | PCE | MeOH | 1 | - | Xanthydrol | GC-MS | 0.54 | 98 | [117] |
| 4 aldehydes Acrolein & MDA | Vegetable oil | US | ACN | CH3Cl | 5 | 60 | DPNH | GC-MS | 50–100 | ≥95% | 10 |
LOD, limit of detection; Determ., determination; Rec., recovery; Ref., reference; MW, Microwave; IL, Ionic liquid; IL 3453W, Trihexyltetradecylphosphonium Chloride; DNPH, 2,4-dinitrophenylhydrazine; DCM, Dichloromethane; PCB, polychlorinated biphenyls; MDA, malondialdehyde; US, Ultrasound; UAE, ultrasound-assisted extraction; PCE, tetrachloroethylene, SSA, supramolecular solvent-assisted; ACAC, acetylacetone in an ammonium acetate (2.0% v/v).
5. Combined Microextraction Techniques
Recent advancements in analytical sample preparation reflect a growing trend of integrating diverse extraction techniques to enhance aspects such as separation, cleanup, detection limits, enrichment factors, and the handling of complex sample matrices. The combination of microextraction methods to assess both organic and inorganic targets has proven valuable within the realm of modern analytical chemistry [118]. This approach allows for the concurrent execution of target extraction, pre-concentration, and cleanup stages, effectively shortening the overall procedure time and aligning well with the principles of green analytical chemistry [45][46][47]. This trend underscores a significant progression in analytical sample preparation, harnessing the strengths of various techniques to address intricate analytical challenges and yielding enhanced accuracy, sensitivity, and efficiency in analyzing a wide range of samples [119].
Custodio-Mendoza and colleagues introduced a novel approach involving simultaneous GC-MS analysis of MDA, acrolein (ACRL), formaldehyde, acetaldehyde, propanal, and pentanal, utilizing suspended GDME combined with DLLME [10]. The requirement for analytes to be in a suitable non-polar organic solvent for GC-MS analysis posed limitations on GDME’s application. This challenge became particularly pronounced for carbonyl compounds, especially when derivatized, due to their high volatility, making solvent exchanges intricate.
To address this, Custodio-Mendoza et al. employed a multi-step strategy. They commenced with GDME under optimized conditions: a 10 min extraction at 60 °C using 1 mL of DNPH (0.5 g/L in 2 M HCl) solution as the acceptor phase. The innovation emerged in the subsequent steps. The acceptor phase, containing aldehyde-DNPH derivatives, was transferred to a tube containing 4 mL of ultrapure water to undergo DLLME. A mixture of acetonitrile (0.75 mL) and 70 μL chloroform was injected into the aqueous phase and subjected to sonication at 60 °C for 5 min. This combination of techniques resulted in a cleaner extract with enhanced selectivity and sensitivity. Various solvents including isooctane, hexane, and chloroform were evaluated for optimal extraction.
Remarkably, DLLME facilitated solvent exchange and amplified method sensitivity through enrichment factors, significantly lowering detection limits and enhancing result precision. Another distinctive aspect of their approach was incorporating ultrasonic agitation during the GDME process, which substantially reduced extraction time, optimizing method efficiency and cost-effectiveness. This advancement not only surmounted a significant analytical challenge but also refined sensitivity and analysis speed. The processing and storage of edible oils can lead to oxidation, generating volatile compounds like hydrocarbons, aldehydes, alcohols, and ketones. Thus, quantifying these products serves as potential markers for food quality in the oxidative state. Notably, the method was successfully applied to the quantification of forty-eight samples of vegetable oil, spanning categories such as extra virgin olive oil, refined olive oil, olive-pomace oil, and refined seed oil. The outcomes revealed the presence of acrolein and propanal across all samples, with the highest concentration found in one category. Moreover, malondialdehyde levels seemed to decrease in oils enriched with antioxidants or virgin oils. This comprehensive approach demonstrated the potential for robust lipid peroxidation assessment in various oil types.
References
- Yin, H.; Xu, L.; Porter, N.A. Free radical lipid peroxidation: Mechanisms and analysis. Chem. Rev. 2011, 111, 5944–5972.
- Guéraud, F.; Atalay, M.; Bresgen, N.; Cipak, A.; Eckl, P.M.; Huc, L.; Uchida, K. Chemistry and biochemistry of lipid peroxidation products. Free Radic. Res. 2010, 44, 1098–1124.
- Repetto, M.; Semprine, J.; Boveris, A. Lipid peroxidation: Chemical mechanism, biological implications and analytical determination. Lipid Peroxidation 2012, 1, 3–30.
- Sun, Y.E.; Wang, W.D.; Chen, H.W.; Li, C. Autoxidation of unsaturated lipids in food emulsion. Crit. Rev. Food Sci. Nutr. 2011, 51, 453–466.
- Pryoir, W.A.; Prier, D.G.; Lightsey, J.W. Kinetic and mechanism studies of peroxy, vitamin e and anti-oxidant free radicals by pulse radiolysis. In Autoxidation in Food and Biological Systems, 1st ed.; Simic, M.G., Karel, M., Eds.; Springer Science & Business Media: Washington, DC, USA, 2013; pp. 17–26.
- Zielinski, Z.A.; Pratt, D.A. Lipid Peroxidation: Kinetics, mechanisms, and products. J. Org. Chem. 2017, 82, 2817–2825.
- Islam, F.; Imran, A.; Nosheen, F.; Fatima, M.; Arshad, M.U.; Afzaal, M.; Ijaz, N.; Noreen, R.; Mehta, S.; Biswas, S.; et al. Functional roles and novel tools for improving-oxidative stability of polyunsaturated fatty acids: A comprehensive review. Food Sci Nutr. 2023, 11, 2471–2482.
- Rendón, M.Y.; Salva, T.D.J.G.; Bragagnolo, N. Impact of chemical changes on the sensory characteristics of coffee beans during storage. Food Chem. 2014, 147, 279–286.
- Pegg, R.B.; Shahidi, F. Off flavors and rancidity in foods. In Handbook of Meat, Poultry and Seafood Quality; Nollet, L.M.L., Ed.; Wiley-Blackwell: Oxford, UK, 2012; Part 2; pp. 127–139.
- Custodio-Mendoza, J.A.; Aja-Macaya, J.; Valente, I.M.; Rodrigues, J.A.; Almeida, P.J.; Lorenzo, R.A.; Carro, A.M. Determination of malondialdehyde, acrolein and four other products of lipid peroxidation in edible oils by Gas-Diffusion Microextraction combined with Dispersive Liquid-Liquid Microextraction. J. Chromatogr. A 2020, 1627, 461397.
- Rodrigues, F.; Caldeira, M.; Câmara, J.D.S. Development of a dynamic headspace solid-phase microextraction procedure coupled to GC–qMSD for evaluation the chemical profile in alcoholic beverages. Anal. Chim. Acta 2008, 609, 82–104.
- Min, B.; Ahn, D.U. Mechanism of lipid peroxidation in meat and meat products-A review. Food Sci. Biotechnol. 2005, 14, 152–163.
- Khan, I.T.; Nadeem, M.; Imran, M.; Ullah, R.; Ajmal, M.; Jaspal, M.H. Antioxidant properties of Milk and dairy products: A comprehensive review of the current knowledge. Lipids Health Dis. 2019, 18, 1–13.
- Carrasco-Pancorbo, A.; Cerretani, L.; Bendini, A.; Segura-Carretero, A.; Del Carlo, M.; Gallina-Toschi, T.; Lercker, G.; Compagnone, D.; Fernandez-Gutierrez, A. Evaluation of the antioxidant capacity of individual phenolic compounds in virgin olive oil. J. Agric. Food Chem. 2005, 53, 8918–8925.
- Wiśniewska, P.; Śliwińska, M.; Dymerski, T.; Wardencki, W.; Namieśnik, J. The analysis of raw spirits–a review of methodology. J. Inst. Brew. 2016, 122, 5–10.
- Hernandes, K.C.; Souza-Silva, É.A.; Assumpção, C.F.; Zini, C.A.; Welke, J.E. Carbonyl compounds and furan derivatives with toxic potential evaluated in the brewing stages of craft beer. Food Addit. Contam. Part A 2020, 37, 61–68.
- Perrone, G.G.; Tan, S.X.; Dawes, I.W. Reactive oxygen species and yeast apoptosis. Biochim. Biophys. Acta Mol. Cell. Res. 2008, 1783, 1354–1368.
- Culleré, L.; Cacho, J.; Ferreira, V. An assessment of the role played by some oxidation-related aldehydes in wine aroma. J. Agric. Food. Chem. 2007, 55, 876–881.
- Amaral, A.B.; Silva, M.V.D.; Lannes, S.C.D.S. Lipid oxidation in meat: Mechanisms and protective factors—A review. Food Sci. Tech. 2018, 38, 1–15.
- Łuczaj, W.; Skrzydlewska, E. DNA damage caused by lipid peroxidation products. Cell Mol. Biol. Lett. 2003, 8, 391–413.
- World Health Organization. IARC Monographs on the Identification of Carcinogenic Hazards to Humans. 2023. Available online: https://monographs.iarc.who.int/list-of-classifications/ (accessed on 25 August 2023).
- European Food Safety Authority (EFSA). Opinion of the Scientific Panel on food additives, flavourings, processing aids and materials in contact with food (AFC) related to use of formaldehyde as a preservative during the manufacture and preparation of food additives. EFSA J. 2007, 5, 415.
- Center for Drug Evaluation and Research M7(R2) Addendum: Application of the Principles of the ICH M7 Guideline, U.S. Food and Drug Administration. Available online: https://www.fda.gov/media/157451/download (accessed on 25 August 2023).
- Van Andel, I.; Sleijffers, A.; Schenk, E.; Rambali, B.; Wolterink, G.; Vleeming, W.; van Amsterdam, J.G.C. Adverse Health Effects of Cigarette Smoke: Aldehydes Crotonaldehyde, Butyraldehyde, Hexanal and Malonaldehyde; Dutch National Institute of Public Health and the Environment: Utrecht, The Netherland, 2006; Available online: http://hdl.handle.net/10029/7336 (accessed on 25 August 2023).
- Gomes, R.; Meek, M.K. Acrolein. Concise International Chemical Assessment Document 43. World Health Organization. 2002. Available online: https://www.who.int/ipcs/publications/cicad/en/cicad43.pdf (accessed on 25 August 2023).
- Papastergiadis, A.; Fatouh, A.; Jacxsens, L.; Lachat, C.; Shrestha, K.; Daelman, J.; Kolsteren, P.; Van Langenhove, H.; De Meulenaer, B. Exposure assessment of Malondialdehyde, 4-Hydroxy-2-(E)-Nonenal and 4-Hydroxy-2-(E)-Hexenal through specific foods available in Belgium. Food Chem. Tox. 2014, 73, 51–58.
- Guth, S.; Baum, M.; Cartus, A.T.; Diel, P.; Engel, K.H.; Engeli, B.; Epe, B.; Grune, T.; Haller, D.; Heinz, V.; et al. Evaluation of the genotoxic potential of acrylamide: Arguments for the derivation of a tolerable daily intake (TDI value). Food Chem. Toxicol. 2023, 173, 113632.
- Clark, S.; Winter, C.K. Diacetyl in foods: A review of safety and sensory characteristics. Compr. Rev. Food Sci. Food Saf. 2015, 14, 634–643.
- EFSA Panel on Food Additives and Flavourings (FAF); Younes, M.; Aquilina, G.; Castle, L.; Engel, K.H.; Fowler, P.; Mennes, W. Scientific Opinion on Flavouring Group Evaluation 13 Revision 3 (FGE. 13Rev3): Furfuryl and furan derivatives with and without additional side-chain substituents and heteroatoms from chemical group 14. EFSA J. 2021, 19, 06386.
- Kielhorn, J.; Pohlenz-Michel, C.; Schmidt, S.; Mangelsdorf, I. Glyoxal. World Health Organization. 2004. Available online: https://apps.who.int/iris/handle/10665/42867 (accessed on 25 August 2023).
- Renwick, A.G. Structure-based thresholds of toxicological concern—Guidance for application to substances present at low levels in the diet. Toxicol. Appl. Pharmacol. 2005, 207, 585–591.
- Amorati, R.; Valgimigli, L. Advantages and limitations of common testing methods for antioxidants. Free Radic. Res. 2015, 49, 633–649.
- Demirci-Cekic, S.; Özkan, G.; Avan, A.N.; Uzunboy, S.; Çapanoğlu, E.; Apak, R. Biomarkers of oxidative stress and antioxidant defense. J. Pharm. Biomed. Anal. 2022, 209, 114477.
- Grebenteuch, S.; Kroh, L.W.; Drusch, S.; Rohn, S. Formation of secondary and tertiary volatile compounds resulting from the lipid oxidation of rapeseed oil. Foods 2021, 10, 2417.
- Laghrib, F.; Lahrich, S.; El Mhammedi, M.A. Recent Advances in Direct and Indirect Methods for Sensing Carbonyl Compounds Aldehydes in Environment and Foodstuffs. J. Electrochem. Soc. 2019, 166, B1543.
- Li, H.; Li, H.; Liu, X.; Chen, B. Analysis of volatile flavor compounds in top fermented wheat beer by headspace sampling-gas chromatography. Int. J. Agric. Biol. Eng. 2012, 5, 67–75.
- Zamani, A.; Fashi, A. Extraction and preconcentration of trace malondialdehyde from lipid-rich foods using ion pair–based solvent bar liquid-phase microextraction. Food Anal. Methods 2019, 12, 1625–1634.
- Zhang, D.; Zhang, J.; Li, M.; Li, W.; Aimaiti, G.; Tuersun, G.; Chu, Q. A novel miniaturised electrophoretic method for determining formaldehyde and acetaldehyde in food using 2-thiobarbituric acid derivatisation. Food Chem. 2011, 129, 206–212.
- Zeb, A.; Ullah, F. A simple spectrophotometric method for the determination of thiobarbituric acid reactive substances in fried fast foods. J. Anal. Methods Chem. 2016, 2016, 9412767.
- Mathew, S.; Grey, C.; Rumpunen, K.; Adlercreutz, P. Analysis of carbonyl compounds in sea buckthorn for the evaluation of triglyceride oxidation, by enzymatic hydrolysis and derivatisation methodology. Food Chem. 2011, 126, 1399–1405.
- Suh, J.H.; Ho, C.T.; Wang, Y. Evaluation of carbonyl species in fish oil: An improved LC–MS/MS method. Food Control 2017, 78, 463–468.
- Serrano, M.; Gallego, M.; Silva, M. Quantitative analysis of aldehydes in canned vegetables using static headspace–gas chromatography–mass spectrometry. J. Chromatogr. A 2017, 1524, 21–28.
- Zelzer, S.; Oberreither, R.; Bernecker, C.; Stelzer, I.; Truschnig-Wilders, M.; Fauler, G. Measurement of total and free malondialdehyde by gas–chromatography mass spectrometry–comparison with high-performance liquid chromatography methology. Free Radic. Res. 2013, 47, 651–656.
- Ghorbani, M.; Aghamohammadhassan, M.; Chamsaz, M.; Akhlaghi, H.; Pedramrad, T. Dispersive solid phase microextraction. TrAC Trends Anal. Chem. 2019, 118, 793–809.
- López-Lorente, Á.I.; Pena-Pereira, F.; Pedersen-Bjergaard, S.; Zuin, V.G.; Ozkan, S.A.; Psillakis, E. The ten principles of green sample preparation. TrAC Trends Anal. Chem. 2022, 148, 116530.
- Atapattu, S.N.; Rosenfeld, J.M. Analytical derivatizations in environmental analysis. J. Chromatogr. 2022, 1678, 463348.
- Kokosa, J.M.; Przyjazny, A. Green microextraction methodologies for sample preparations. Green Anal. Chem. 2022, 3, 100023.
- Pacheco, J.G.; Valente, I.M.; Gonçalves, L.M.; Rodrigues, J.A.; Barros, A.A. Gas-diffusion microextraction. J. Sep. Sci. 2010, 33, 3207–3212.
- Jalili, V.; Barkhordari, A.; Ghiasvand, A. A comprehensive look at solid-phase microextraction technique: A review of reviews. Microchem. J. 2020, 152, 104319.
- Sajid, M. Dispersive liquid-liquid microextraction: Evolution in design, application areas, and green aspects. TrAC Trends Anal. Chem. 2022, 152, 116636.
- More, V.N.; Mundhe, D.G. Microextraction techniques in analysis of drugs. Int. J. Res. Pharm.Chem. 2013, 3, 330–344.
- Risheed, C.M.; Fakhre, N.A.; Mohammed, M.I.; Ali, D.K. Hollow Fiber Nano Membrane as Liquid Phase Microextraction for Determination of Enrofloxacin in the Prsence of Florfenicol and Tylosin in Chicken Tissues. Egypt. J. Chem. 2022, 65, 133–141.
- Mirnaghi, F.S.; Goryński, K.; Rodriguez-Lafuente, A.; Boyacı, E.; Bojko, B.; Pawliszyn, J. Microextraction versus exhaustive extraction approaches for simultaneous analysis of compounds in wide range of polarity. J. Chromatogr. A 2013, 1316, 37–43.
- Gonçalves, L.M.; Magalhães, P.J.; Valente, I.M.; Pacheco, J.G.; Dostálek, P.; Sýkora, D.; Rodrigues, J.A.; Barros, A.A. Analysis of aldehydes in beer by gas-diffusion microextraction: Characterization by high-performance liquid chromatography–diode-array detection–atmospheric pressure chemical ionization–mass spectrometry. J. Chromatogr. A 2010, 1217, 3717–3722.
- Ferreira, I.M.; Carvalho, D.O.; da Silva, M.G.; Guido, L.F. Gas-Diffusion Microextraction (GDME) Combined with Derivatization for Assessing Beer Staling Aldehydes: Validation and Application. Foods 2021, 10, 1704.
- Ramos, R.M.; Pacheco, J.G.; Gonçalves, L.M.; Valente, I.M.; Rodrigues, J.A.; Barros, A.A. Determination of free and total diacetyl in wine by HPLC–UV using gas-diffusion microextraction and pre-column derivatization. Food Control 2012, 24, 220–224.
- Cruz, M.P.; Valente, I.M.; Gonçalves, L.M.; Rodrigues, J.A.; Barros, A.A. Application of gas-diffusion microextraction to the analysis of free and bound acetaldehyde in wines by HPLC–UV and characterization of the extracted compounds by MS/MS detection. Anal. Bioanal. Chem. 2012, 403, 1031–1037.
- Ramos, R.M.; Gonçalves, L.M.; Vyskočil, V.; Rodrigues, J.A. Voltammetric determination of trace amounts of diacetyl at a mercury meniscus modified silver solid amalgam electrode following gas-diffusion microextraction. Talanta 2017, 169, 203–208.
- Santos, C.M.; Valente, I.M.; Gonçalves, L.M.; Rodrigues, J.A. Chromatographic analysis of methylglyoxal and other α-dicarbonyls using gas-diffusion microextraction. Analyst 2013, 138, 7233–7237.
- Custodio-Mendoza, J.A.; Valente, I.M.; Ramos, R.M.; Lorenzo, R.A.; Carro, A.M.; Rodrigues, J.A. Analysis of free malondialdehyde in edible oils using gas-diffusion microextraction. J. Food Compos. Anal. 2019, 82, 103254.
- Ferreira, R.C.; Ramos, R.M.; Gonçalves, L.M.; Almeida, P.J.; Rodrigues, J.A. Application of gas-diffusion microextraction to solid samples using the chromatographic determination of α-diketones in bread as a case study. Analyst 2015, 140, 3648–3653.
- Cordeiro, L.; Valente, I.M.; Santos, J.R.; Rodrigues, J.A. Qualitative carbonyl profile in coffee beans through GDME-HPLC-DAD-MS/MS for coffee preliminary characterization. Food Res. Int. 2018, 107, 536–543.
- Câmara, J.S.; Perestrelo, R.; Berenguer, C.V.; Andrade, C.F.; Gomes, T.M.; Olayanju, B.; Pereira, J.A. Green extraction techniques as advanced sample preparation approaches in biological, food, and environmental matrices: A review. Molecules 2022, 27, 2953.
- Jeleń, H.H.; Obuchowska, M.; Zawirska-Wojtasiak, R.; Wasowicz, E. Headspace solid-phase microextraction use for the characterization of volatile compounds in vegetable oils of different sensory quality. J. Agric. Food Chem. 2000, 48, 2360–2367.
- Uchida, T.; Gotoh, N.; Wada, S. Method for analysis of 4-hydroxy-2-(E)-nonenal with solid-phase microextraction. Lipids 2002, 37, 621–626.
- Fujioka, K.; Shibamoto, T. Improved malonaldehyde assay using headspace solid-phase microextraction and its application to the measurement of the antioxidant activity of phytochemicals. J. Agric. Food Chem. 2005, 53, 4708–4713.
- Pastorelli, S.; Valzacchi, S.; Rodriguez, A.; Simoneau, C. Solid-phase microextraction method for the determination of hexanal in hazelnuts as an indicator of the interaction of active packaging materials with food aroma compounds. Food Addit. Contam. 2006, 23, 1236–1241.
- Ma, C.; Ji, J.; Tan, C.; Chen, D.; Luo, F.; Wang, Y.; Chen, X. Headspace solid-phase microextraction coupled to gas chromatography for the analysis of aldehydes in edible oils. Talanta 2014, 120, 94–99.
- Goicoechea, E.; Van Twillert, K.; Duits, M.; Brandon, E.D.; Kootstra, P.R.; Blokland, M.H.; Guillén, M.D. Use of an in vitro digestion model to study the bioaccessibility of 4-hydroxy-2-nonenal and related aldehydes present in oxidized oils rich in omega-6 acyl groups. J. Agric. Food Chem. 2008, 56, 8475–8483.
- Guillén, M.D.; Carton, I.; Salmeron, J.; Casas, C. Headspace composition of cod liver oil and its evolution in storage after opening. First evidence of the presence of toxic aldehydes. Food chem. 2009, 114, 1291–1300.
- Damerau, A.; Kamlang-ek, P.; Moisio, T.; Lampi, A.M.; Piironen, V. Effect of SPME extraction conditions and humidity on the release of volatile lipid oxidation products from spray-dried emulsions. Food Chem. 2014, 157, 1–9.
- Martin-Rubio, A.S.; Sopelana, P.; Guillén, M.D. The key role of ovalbumin in lipid bioaccessibility and oxidation product profile during the in vitro digestion of slightly oxidized soybean oil. Food Func. 2019, 10, 4440–4451.
- Liu, X.; Jin, Q.; Liu, Y.; Huang, J.; Wang, X.; Mao, W.; Wang, S. Changes in volatile compounds of peanut oil during the roasting process for production of aromatic roasted peanut oil. J. Food Sci. 2011, 76, C404–C412.
- Liu, Y.; Xu, X.L.; Ouyang, G.F.; Zhou, G.H. Changes in volatile compounds of traditional Chinese Nanjing water-boiled salted duck during processing. J. Food Sci. 2006, 71, S371–S377.
- Mariutti, L.R.; Nogueira, G.C.; Bragagnolo, N. Solid phase microextraction-gas chromatography for the evaluation of secondary lipid oxidation products in chicken patties during long-term storage. J. Braz. Chem. Soc. 2009, 20, 1849–1855.
- Estévez, M.; Ventanas, S.; Cava, R. Oxidation of lipids and proteins in frankfurters with different fatty acid compositions and tocopherol and phenolic contents. Food Chem. 2007, 100, 55–63.
- Chopin, C.; Kone, M.; Serot, T. Study of the interaction of fish myosin with the products of lipid oxidation: The case of aldehydes. Food Chem. 2007, 105, 126–132.
- Iglesias, J.; Gallardo, J.M.; Medina, I. Determination of carbonyl compounds in fish species samples with solid-phase microextraction with on-fibre derivatization. Food Chem. 2010, 123, 771–778.
- Lopez, A.; Bellagamba, F.; Tirloni, E.; Vasconi, M.; Stella, S.; Bernardi, C.; Pazzaglia, M.; Moretti, V.M. Evolution of food safety features and volatile profile in white sturgeon caviar treated with different formulations of salt and preservatives during a long-term storage time. Foods 2021, 10, 850.
- Domínguez, R.; Purriños, L.; Pérez-Santaescolástica, C.; Pateiro, M.; Barba, F.J.; Tomasevic, I.; Bastianello Campagnol, P.C.; Lorenzo, J.M. Characterization of volatile compounds of dry-cured meat products using HS-SPME-GC/MS technique. Food Anal. Methods 2019, 12, 1263–1284.
- García-Llatas, G.; Lagarda, M.J.; Clemente, G.; Farré, R. Monitoring of headspace volatiles in milk-cereal-based liquid infant foods during storage. Eur. J. Lipid Sci. Technol. 2006, 108, 1028–1036.
- García-Llatas, G.; Lagarda, M.J.; Romero, F.; Abellán, P.; Farré, R. A headspace solid-phase microextraction method of use in monitoring hexanal and pentane during storage: Application to liquid infant foods and powdered infant formulas. Food Chem. 2007, 101, 1078–1086.
- Clarke, H.J.; Mannion, D.T.; O’Sullivan, M.G.; Kerry, J.P.; Kilcawley, K.N. Development of a headspace solid-phase microextraction gas chromatography mass spectrometry method for the quantification of volatiles associated with lipid oxidation in whole milk powder using response surface methodology. Food Chem. 2019, 292, 75–80.
- Majcher, M.A.; Goderska, K.; Pikul, J.; Jeleń, H.H. Changes in volatile, sensory and microbial profiles during preparation of smoked ewe cheese. J. Sci. Food Agric. 2011, 91, 1416–1423.
- Natrella, G.; Faccia, M.; Lorenzo, J.M.; De Palo, P.; Gambacorta, G. Sensory characteristics and volatile organic compound profile of high-moisture mozzarella made by traditional and direct acidification technology. J. Dairy Sci. 2020, 103, 2089–2097.
- Cardinali, F.; Foligni, R.; Ferrocino, I.; Harasym, J.; Orkusz, A.; Milanović, V.; Franciosa, O.; Garofalo, C.; Mannozzi, C.; Mozzon, M.; et al. Microbiological, morpho-textural, and volatile characterization of Portuguese Queijo de Nisa PDO cheese. Food Res. Int. 2022, 162, 112011.
- Vesely, P.; Lusk, L.; Basarova, G.; Seabrooks, J.; Ryder, D. Analysis of aldehydes in beer using solid-phase microextraction with on-fiber derivatization and gas chromatography/mass spectrometry. J. Agric. Food Chem. 2003, 51, 6941–6944.
- Saison, D.; De Schutter, D.P.; Delvaux, F.; Delvaux, F.R. Determination of carbonyl compounds in beer by derivatisation and headspace solid-phase microextraction in combination with gas chromatography and mass spectrometry. J. Chromatogr. A 2009, 1216, 5061–5068.
- Moreira, N.; Meireles, S.; Brandão, T.; de Pinho, P.G. Optimization of the HS-SPME–GC–IT/MS method using a central composite design for volatile carbonyl compounds determination in beers. Talanta 2013, 117, 523–531.
- Hernandes, K.C.; Souza-Silva, É.A.; Assumpção, C.F.; Zini, C.A.; Welke, J.E. Validation of an analytical method using HS-SPME-GC/MS-SIM to assess the exposure risk to carbonyl compounds and furan derivatives through beer consumption. Food Addit. Contam. Part A 2019, 36, 1808–1821.
- Perez Olivero, S.J.; Perez Trujillo, J.P. A new method for the determination of carbonyl compounds in wines by headspace solid-phase microextraction coupled to gas chromatography−ion trap mass spectrometry. J. Agric. Food Chem. 2010, 58, 12976–12985.
- Butkhup, L.; Jeenphakdee, M.; Jorjong, S.; Samappito, S.; Samappito, W.; Chowtivannakul, S. HS-SPME-GC-MS analysis of volatile aromatic compounds in alcohol related beverages made with mulberry fruits. Food Sci. Biotechnol. 2011, 20, 1021–1032.
- Lago, L.O.; Nicolli, K.P.; Marques, A.B.; Zini, C.A.; Welke, J.E. Influence of ripeness and maceration of the grapes on levels of furan and carbonyl compounds in wine—Simultaneous quantitative determination and assessment of the exposure risk to these compounds. Food Chem. 2017, 230, 594–603.
- Ferreira, D.C.; Hernandes, K.C.; Nicolli, K.P.; Souza-Silva, É.A.; Manfroi, V.; Zini, C.A.; Welke, J.E. Development of a method for determination of target toxic carbonyl compounds in must and wine using HS-SPME-GC/MS-SIM after preliminary GC× GC/TOFMS analyses. Food Anal. Methods 2019, 12, 108–120.
- Moreira, N.; Araújo, A.M.; Rogerson, F.; Vasconcelos, I.; De Freitas, V.; de Pinho, P.G. Development and optimization of a HS-SPME-GC-MS methodology to quantify volatile carbonyl compounds in Port wines. Food Chem. 2019, 270, 518–526.
- Piergiovanni, M.; Carlin, S.; Lotti, C.; Vrhovsek, U.; Mattivi, F. Development of a Fully Automated Method HS-SPME-GC-MS/MS for the Determination of Odor-Active Carbonyls in Wines: A “Green” Approach to Improve Robustness and Productivity in the Oenological Analytical Chemistry. J. Agric. Food Chem. 2023.
- Wardencki, W.; Sowiński, P.; Curyło, J. Evaluation of headspace solid-phase microextraction for the analysis of volatile carbonyl compounds in spirits and alcoholic beverages. J. Chromatogr. A 2003, 984, 89–96.
- López-Vázquez, C.; Orriols, I.; Perelló, M.C.; De Revel, G. Determination of aldehydes as pentafluorobenzyl derivatives in grape pomace distillates by HS-SPME-GC/MS. Food Chem. 2012, 130, 1127–1133.
- Perestrelo, R.; Silva, C.L.; Silva, P.; Medina, S.; Pereira, R.; Câmara, J.S. Untargeted fingerprinting of cider volatiles from different geographical regions by HS-SPME/GC-MS. Microchem. J. 2019, 148, 643–651.
- Yu, J.; Zhou, Z.; Xu, X.; Ren, H.; Gong, M.; Ji, Z.; Liu, S.; Hu, Z.; Mao, J. Differentiating Huangjiu with Varying Sugar Contents from Different Regions Based on Targeted Metabolomics Analyses of Volatile Carbonyl Compounds. Foods 2023, 12, 1455.
- Lim, H.H.; Shin, H.S. In-solution derivatization and detection of glyoxal and methylglyoxal in alcoholic beverages and fermented foods by headspace solid-phase microextraction and gas chromatography–mass spectrometry. J. Food Compos. Anal. 2020, 92, 103584.
- Rezaee, M.; Assadi, Y.; Hosseini, M.R.M.; Aghaee, E.; Ahmadi, F.; Berijani, S. Determination of organic compounds in water using dispersive liquid-liquid microextraction. J. Chromatogr. A 2006, 1116, 1–9.
- Yan, H.; Wang, H. Recent development and applications of dispersive liquid-liquid microextraction. J. Chromatogr. A 2013, 1295, 1–15.
- Jain, R.; Singh, R. Applications of dispersive liquid–liquid micro-extraction in forensic toxicology. TrAC Trends Anal. Chem. 2016, 75, 227–237.
- El-Deen, A.K.; Elmansi, H.; Belal, F.; Magdy, G. Recent advances in dispersion strategies for dispersive liquid-liquid microextraction from green chemistry perspectives. Microchem. J. 2023, 191, 108807.
- Rykowska, I.; Ziemblińska, J.; Nowak, I. Modern approaches in dispersive liquid-liquid microextraction (DLLME) based on ionic liquids: A review. J. Mol. Liq. 2018, 259, 319–339.
- Marcinkowska, R.; Konieczna, K.; Marcinkowski, Ł.; Namieśnik, J.; Kloskowski, A. Application of ionic liquids in microextraction techniques: Current trends and future perspectives. TrAC Trends Anal. Chem. 2019, 119, 115614.
- Xu, X.; Su, R.; Zhao, X.; Liu, Z.; Li, D.; Li, X.; Zhang, H.; Wang, Z. Determination of formaldehyde in beverages using microwave-assisted derivatization and ionic liquid-based dispersive liquid–liquid microextraction followed by high-performance liquid chromatography. Talanta 2011, 85, 2632–2638.
- Galuch, M.B.; Magon, T.F.S.; Silveira, R.; Nicácio, A.E.; Pizzo, J.S.; Bonafe, E.G.; Maldaner, L.; Santos, O.O.; Visentainer, J.V. Determination of acrylamide in brewed coffee by dispersive liquid–liquid microextraction (DLLME) and ultra-performance liquid chromatography tandem mass spectrometry (UPLC-MS/MS). Food Chem. 2019, 282, 120–126.
- Zhang, C.; Cagliero, C.; Pierson, S.A.; Anderson, J.L. Rapid and sensitive analysis of polychlorinated biphenyls and acrylamide in food samples using ionic liquid-based in situ dispersive liquid-liquid microextraction coupled to headspace gas chromatography. J. Chromatogr. A 2017, 1481, 1–11.
- Custodio-Mendoza, J.A.; Caamaño-Fernandez, C.; Lage, M.A.; Almeida, P.J.; Lorenzo, R.A.; Carro, A.M. GC–MS determination of malondialdehyde, acrolein, and 4-hydroxy-2-nonenal by ultrasound-assisted dispersive liquid-liquid microextraction in beverages. Food Chem. 2022, 384, 132530.
- Nascimento, C.F.; Brasil, M.A.; Costa, S.P.; Pinto, P.C.; Saraiva, M.L.M.; Rocha, F.R. Exploitation of pulsed flows for on-line dispersive liquid–liquid microextraction: Spectrophotometric determination of formaldehyde in milk. Talanta 2015, 144, 1189–1194.
- Altunay, N.; Elik, A.; Tuzen, M.; Lanjwani, M.F.; Mogaddam, M.R.A. Determination and extraction of acrylamide in processed food samples using alkanol-based supramolecular solvent-assisted dispersive liquid-liquid microextraction coupled with spectrophotometer: Optimization using factorial design. J. Food Compos. Anal. 2023, 115, 105023.
- Nematollahi, A.; Kamankesh, M.; Hosseini, H.; Hadian, Z.; Ghasemi, J.; Mohammadi, A. Investigation and determination of acrylamide in 24 types of roasted nuts and seeds using microextraction method coupled with gas chromatography–mass spectrometry: Central composite design. J. Food Meas. Charact. 2020, 14, 1249–1260.
- Zokaei, M.; Abedi, A.S.; Kamankesh, M.; Shojaee-Aliababadi, S.; Mohammadi, A. Ultrasonic-assisted extraction and dispersive liquid-liquid microextraction combined with gas chromatography-mass spectrometry as an efficient and sensitive method for determining of acrylamide in potato chips samples. Food chem. 2017, 234, 55–61.
- Nematollahi, A.; Kamankesh, M.; Hosseini, H.; Ghasemi, J.; Hosseini-Esfahani, F.; Mohammadi, A. Investigation and determination of acrylamide in the main group of cereal products using advanced microextraction method coupled with gas chromatography-mass spectrometry. J. Cereal Sci. 2019, 87, 157–164.
- Norouzi, E.; Kamankesh, M.; Mohammadi, A.; Attaran, A. Acrylamide in bread samples: Determining using ultrasonic-assisted extraction and microextraction method followed by gas chromatography-mass spectrometry. J. cereal sci. 2018, 79, 1–5.
- Moreda-Piñeiro, J.; Moreda-Piñeiro, A. Recent advances in combining microextraction techniques for sample pre-treatment. TRAC Trends Anal. Chem. 2015, 71, 265–274.
- Sajid, M.; Płotka-Wasylka, J. Combined extraction and microextraction techniques: Recent trends and future perspectives. TRAC Trends Anal. Chem. 2018, 103, 74–86.
More
Information
Subjects:
Chemistry, Analytical
Contributors
MDPI registered users' name will be linked to their SciProfiles pages. To register with us, please refer to https://encyclopedia.pub/register
:
View Times:
1.6K
Entry Collection:
Extraction Techniques in Sample Preparation
Revisions:
2 times
(View History)
Update Date:
26 Oct 2023
Table of Contents


Notice
You are not a member of the advisory board for this topic. If you want to update advisory board member profile, please contact office@encyclopedia.pub.
OK
Confirm
Only members of the Encyclopedia advisory board for this topic are allowed to note entries. Would you like to become an advisory board member of the Encyclopedia?
Yes
No
${ textCharacter }/${ maxCharacter }
Submit
Cancel
Back
Comments
${ item }
|
${ item.createdUser.fullName }
${ item.createdAt }
${ item.vote }
${ item.reply }
Delete
${ reply.createdUser.fullName }
${ reply.createdAt }
${ reply.vote }
Delete
There is no reply to this comment~
${ item.replyTextCharacter }/${ item.replyMaxCharacter }
Submit
Cancel
More
No more~
There is no comment~
${ textCharacter }/${ maxCharacter }
Submit
Cancel
${ selectedItem.replyTextCharacter }/${ selectedItem.replyMaxCharacter }
Submit
Cancel
Confirm
Are you sure to Delete?
Yes
No