Your browser does not fully support modern features. Please upgrade for a smoother experience.
Please note this is a comparison between Version 1 by Jorge Antonio Custodio-Mendoza and Version 2 by Fanny Huang.
Lipid peroxidation, the most aggressive reaction in food, results in the formation of reactive organic compounds that detrimentally impact food sensory qualities and consumers’ health. While controlled lipid peroxidation can enhance flavors and appearance in certain foods, secondary peroxidation products lead to sensory deterioration in a variety of products, such as oils, alcoholic beverages, and meat. Dispersive liquid-liquid microextraction (DLLME), solid-phase microextraction (SPME), and gas-diffusion microextraction (GDME). These techniques offer efficient and sensitive approaches to extracting and quantifying lipid oxidation products and contribute to the understanding of oxidative deterioration in various food products.
- food analysis
- gas-diffusion microextraction
- lipid peroxidation
- dispersive liquid-liquid microextraction
- solid-phase microextraction
1. Introduction
Lipid peroxidation, autooxidation, or oxidative rancidity, is the most aggressive reaction in food that results in the formation of reactive organic compounds [1]. These compounds have an adverse effect on the sensory qualities of food and can potentially harm consumer health [1][2][1,2]. Lipid peroxidation is driven by the complex interaction of polyunsaturated fatty acids (PUFA) with reactive oxygen species (ROS) (Figure 1), resembling free radical reactions [3]. Exposure to factors like light, heat, or metallic ions initiates the process by releasing hydrogen atoms, forming radical carbonations. These radicals rearrange to create conjugated systems [1][2][4][1,2,4]. Atmospheric oxygen reacts with these conjugated dienes, generating peroxide radicals that sustain the chain reaction [3][4][3,4]. Although lipid peroxides are relatively stable, further degradation occurs through heat or metal ions, resulting in more stable secondary products [3][5][3,5]. The extent of autooxidation varies based on factors such as storage conditions, oxygen levels, and lipid composition, with the number of unsaturated bonds in the fatty acid influencing the susceptibility [5][6][7][5,6,7].
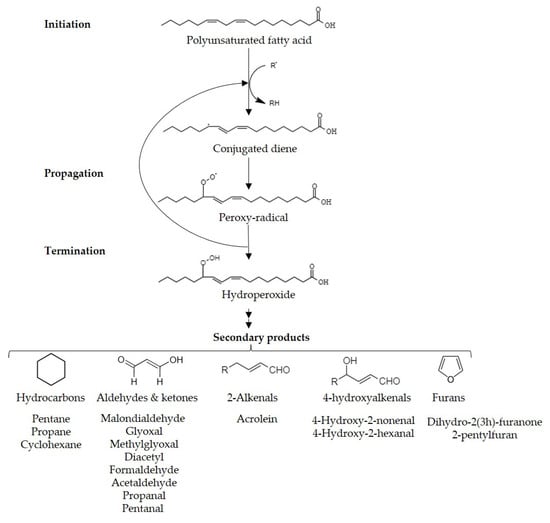
Figure 1. Pathway of lipid peroxidation.
Controlled lipid peroxidation possesses positive effects, enhancing the flavors in certain products like aged cheese, roasted coffee beans, and toasted nuts [8][9][8,9]. However, secondary lipid peroxidation products can lead to sensory deterioration and off flavors in various foods, including oils, alcoholic beverages, meat, milk, and dairy products [9][10][11][12][13][9,10,11,12,13]. The susceptibility to autooxidation varies among different edible oils, with olive oil’s resistance attributed to its high phenolic content [10][14][10,14]. Alcoholic beverages, such as wine and beer, can develop lipid peroxidation products due to the interaction of PUFA in the raw materials with lipid peroxidation factors during production and fermentation [15][16][15,16]. Yeast metabolism in alcohol fermentation can also contribute to generating ROS, accelerating oxidative rancidity [17]. Extended periods of aging and storage, common in wines, further expose them to oxidative conditions [18]. Meat products, processed through grinding, cutting, and packaging, expose more surface area to ROS, promoting lipid peroxidation, which is exacerbated by extended storage times, especially under improper conditions [12][19][12,19]. Additionally, food products made from meat or fish are high in protein, PUFA and monounsaturated fatty acids (MUFA), and salt can experience protein deterioration due to primary (hydroperoxides) and secondary (aldehydes, ketones) lipid oxidation products reacting with free proteins, peptides, and amino acids [12][19][12,19].
Excessive lipid peroxidation can have adverse health effects by producing secondary peroxidation products that interact with biomolecules (proteins, peptides, nucleic acids, and other lipids) within cells, potentially leading to toxic and mutagenic effects [1][2][3][1,2,3].
These secondary lipid peroxidation products can follow two pathways: they can break down into carbonyl compounds like aldehydes, ketones, and alcohols [1][2][1,2], or undergo cyclization to form malondialdehyde, which can then dehydrate into acrolein [20].
The International Agency for Research on Cancer (IARC) classifies certain secondary peroxidation products based on their potential carcinogenic hazards to humans [21]. This classification (Table 1) categorizes compounds according to their level of evidence as carcinogens into different groups: Category 1, indicating sufficient evidence of its carcinogenicity to humans, Category 2A, suggesting they are probably carcinogenic to humans based on limited evidence. Category 2B, indicating that they are possibly carcinogenic to humans, supported by limited evidence, and Category 3, indicating insufficient evidence for their carcinogenicity.
Table 1. Classification of secondary lipid peroxidation products based on their carcinogenetic and recommended exposure levels.
| Secondary Product | CAS Number | IARC Category | Tolerable Daily Intake µg/Kg bw/Day |
Reference | |
|---|---|---|---|---|---|
| Saturate Carbonyls | Formaldehyde | 50-00-0 | 1 | 150 | [22] |
| Acetaldehyde | 75-07-0 | 2B | 185 | ||
]. Other derivatization reagents, such as hydrazines, react with carbonyl compounds to form hydrazones, detectable spectroscopically after LC or gas chromatography-mass spectrometry (GC-MS) [40][41][42][40,41,42]. Phenyl hydrazine (PH) and derivatives such as 2,4-Dinitrophenylhydrazine (DNPH) and 2,3,4,5,6-pentafluorophenylhydrazine (PFPH) are commonly used for this purpose [40][41][42][40,41,42].
The choice of a sample preparation method depends on various factors, including the sample’s state (solid, liquid, gas), size, the analytical technique used, the type of analysis, properties of the analyte, and its initial concentration [44]. Traditional sample preparation methods often involve significant quantities of organic solvents, multiple steps, and result in substantial waste and time consumption [45]. An ideal sample preparation method should be simple, time efficient, cost effective, rugged, potentially automated, and align with the principles of green analytical chemistry, with a focus on minimizing sample, solvent, and waste usage [44][45][44,45]. Furthermore, simultaneous derivatization and extraction can reduce the overall analysis time while enhancing sensitivity and specificity [46]. In response to these needs, novel microextraction-based methods have emerged. Microextraction involves using a small volume of an extracting phase compared to the sample volume [47][48][49][50][47,48,49,50]. While it may not achieve exhaustive extraction, it significantly increases the concentration of the analyte in the extractive phase, reducing solvent usage [47][48][49][50][47,48,49,50]. The efficiency of microextraction depends on how the analyte partitions between the matrix and the extractive phase [51]. Since partitioning is not affected by analyte concentration, quantification is based on the absolute amount extracted [52]. The affinity of the analyte for the extraction phase determines the quantity extracted [51][52][51,52]. Moreover, microextraction operates on equilibrium, where extraction time determines the system’s equilibrium position [53]. Once equilibrium is reached, no further analyte extraction occurs [51][52][53][51,52,53]. Microextraction can also serve as a pre-concentration step before analysis [49][50][51][49,50,51].
Microextraction techniques, including dispersive liquid-liquid microextraction (DLLME), solid-phase microextraction (SPME), and gas-diffusion microextraction (GDME), have gained prominence in the analysis of lipid peroxidation in food. These techniques provide efficient and sensitive approaches to extracting and quantifying lipid oxidation products, thereby contributing to understanding the oxidative deterioration of food products.
2. Gas Diffusion Microextraction
GDME (Figure 2) was introduced to the scientific community through the Journal of Separation Science in 2010 [48].
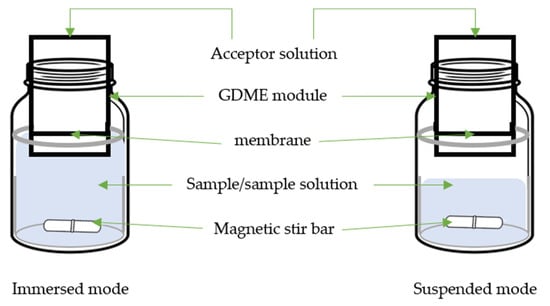
Figure 2. Scheme of gas-diffusion microextraction (GDME).
GDME is a versatile and efficient technique offering several advantages in addressing food matrices complexities. Its selective extraction capability allows the isolation of specific target compounds from complex mixtures, ensuring precise analysis even in interfering components. GDME operates through passive diffusion, with target compounds migrating from the sample matrix into an acceptor phase, usually a liquid solution containing a derivative reagent. This process involves placing the acceptor phase in the GDME module containing a microporous hydrophobic membrane, typically a 5.0 µm PTFE membrane, which supports the acceptor phase. Equilibrium is established between the sample and acceptor phases, and the acceptor phase is collected for analysis. GDME’s minimal sample requirements make it well suited for limited availability, while its reduced solvent usage aligns with the trend of green analytical chemistry [45]. GDME exhibits high sensitivity, when coupled with sensitive detection methods like GC-MS or high-performance liquid chromatography-ultraviolet (HPLC-UV). This empowers the quantification of trace-level compounds in food analyses [10][48][54][55][56][57][58][59][60][61][62][10,48,54,55,56,57,58,59,60,61,62].
From quality control to monitoring changes during storage and processing, GDME’s synergy with analytical techniques such as GC and HPLC unveils the intricacies of food composition and quality, setting its status as an indispensable tool in modern food analysis practices. Its selective enrichment capabilities enhance the detectability of compounds, making GDME valuable for trace analysis. In practice, GDME is employed for discerning volatile aroma compounds, evaluating off flavors, assessing lipid oxidation products, and analyzing a spectrum of other volatile constituents. Additionally, GDME’s non-destructive nature preserves the integrity of samples for further investigations, enhancing the versatility of its applications across various food products, including solid (bread and coffee beans), liquid (beer, wine, soy sauce), and semi-liquid (vegetable oils) foods. Table 2 presents a comparison of the methods developed for the analysis of carbonyl compounds using GDME.
Table 2. Analytical method for determination of secondary peroxidation products by gas-diffusion microextraction (GDME).
| Target Compound | Sample | GDME | Derivative Reagent | Determination | LOD µg/L or µg/Kg |
Recovery % |
Ref. | |||
|---|---|---|---|---|---|---|---|---|---|---|
| Mode | Vacceptor solution mL |
t min |
T °C |
|||||||
| 1,3-pentadione Diacetyl |
Beer | Immersed | 0.5 | 15 | 40 | O-PDA | HPLC-UV | 3.8–4.6 | - | [48] |
| 2 aldehydes & Furfural |
Beer | Immersed | a | 0.75[23] | ||||||
| 5 | 30 | DNPH | ||||||||
.
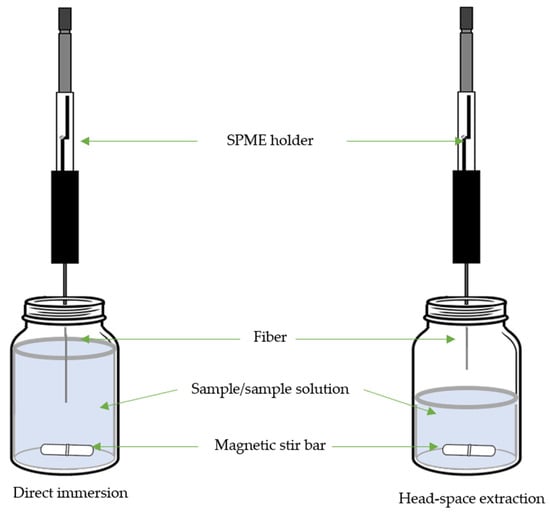 SPME finds particular utility in extracting volatile and semi-volatile compounds from complex matrices, especially in food analysis. SPME involves a fiber coated with a thin layer of an absorbent material, which is exposed to the sample to extract the analytes of interest [49][63][49,63]. The SPME process comprises several key steps: equilibration, when the SPME fiber is exposed to the sample (either in immersed mode or sample headspace) to allow analytes to partition between the sample matrix and the fiber coating, adsorption, when the analytes are absorbed onto the fiber coating, concentrating them from the sample matrix, and desorption of the analytes from the fiber coating to the analytical instrument for analysis [63].
The application of SPME for analyzing lipid peroxidation products is well justified due to its selective extraction capabilities, which minimize interference from complex matrices. SPME simplifies sample preparation by concentrating trace amounts of these compounds, enhancing sensitivity, and eliminating the need for extensive cleanup steps [49][63][49,63]. Furthermore, its reduced solvent usage aligns with environmental concerns [63]. SPME’s adaptability to various sample types enables real-time monitoring, making it versatile for studying lipid peroxidation in biological, food, and other samples [49][63][49,63]. Its compatibility with quantitative and qualitative analytical techniques, coupled with its ability to mitigate matrix effects, further underlines its value as a technique for accurate and comprehensive lipid peroxidation product analysis (Table 3).
SPME finds particular utility in extracting volatile and semi-volatile compounds from complex matrices, especially in food analysis. SPME involves a fiber coated with a thin layer of an absorbent material, which is exposed to the sample to extract the analytes of interest [49][63][49,63]. The SPME process comprises several key steps: equilibration, when the SPME fiber is exposed to the sample (either in immersed mode or sample headspace) to allow analytes to partition between the sample matrix and the fiber coating, adsorption, when the analytes are absorbed onto the fiber coating, concentrating them from the sample matrix, and desorption of the analytes from the fiber coating to the analytical instrument for analysis [63].
The application of SPME for analyzing lipid peroxidation products is well justified due to its selective extraction capabilities, which minimize interference from complex matrices. SPME simplifies sample preparation by concentrating trace amounts of these compounds, enhancing sensitivity, and eliminating the need for extensive cleanup steps [49][63][49,63]. Furthermore, its reduced solvent usage aligns with environmental concerns [63]. SPME’s adaptability to various sample types enables real-time monitoring, making it versatile for studying lipid peroxidation in biological, food, and other samples [49][63][49,63]. Its compatibility with quantitative and qualitative analytical techniques, coupled with its ability to mitigate matrix effects, further underlines its value as a technique for accurate and comprehensive lipid peroxidation product analysis (Table 3).
Figure 3. Scheme of solid-phase microextraction (SPME).
Table 3. Analytical methods for determination of secondary peroxidation products by solid-phase microextraction (SPME).
| Target Compound | Sample | SPME | Derivative Reagent | Determination | LOD µg/L or µg/Kg |
Recovery % |
Ref. | ||||
|---|---|---|---|---|---|---|---|---|---|---|---|
| Mode | t min |
T °C |
Fiber | Tdesorption °C |
|||||||
| 14 aldehydes & ketones | Vegetable oil | HS | 30 | 20 | DVB/CAR/PDMS | 270 | - | GC-FID & GC-MS | 0.04–2.24 | - | [64] |
| HPLC-UV | 1.5–12.3 | - | [ | 54 | ] | ||||||
| 4-HNE | Oils & porcine liver | DI | 15 | 40 | Hexanal | 66-25-1 | - | ||||
| PDMS/DVB | 5 aldehydes | Beer | Suspended780 * | 0.5[24] | |||||||
| 20 | 40 | HBA | |||||||||
105][107,108,109]. The DLLME system consists of a ternary solvent system comprising an aqueous phase containing the analytes of interest, a dispersive solvent that is miscible with both the aqueous phase and the third component of the system, which is the extracting solvent. The mixture formed by the dispersant and the extractant is rapidly injected into the aqueous solution, forming a cloudy solution. This microemulsion is composed of tiny droplets of extractant solvent dispersed in the aqueous phase, thereby increasing the contact surface between them and facilitating quick equilibrium.
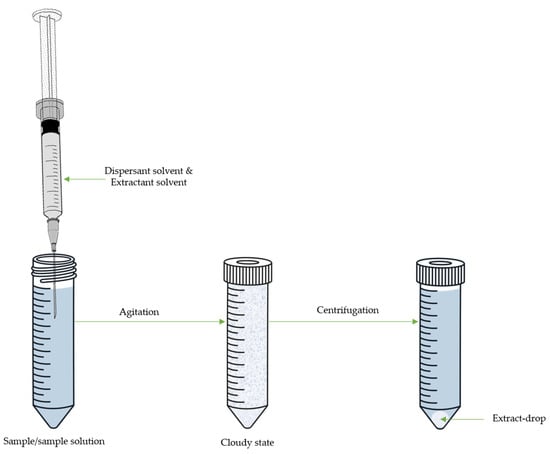 DLLME is characterized by its simplicity, speed, efficiency, and capacity for high enrichment due to the high proportion of donor and acceptor phases. Therefore, the most important parameters of DLLME are the selection of extraction conditions and the choice of dispersive solvents for analytes extraction. An appropriate dispersive solvent must be miscible with the extraction phase and the aqueous phase to create fine droplets in the sample matrices, thus enhancing the interaction between the two phases, resulting in high extraction efficiency.
The most commonly used dispersing solvents are acetone, acetonitrile, and short-chain alcohols (such as methanol, ethanol, and propanol) [105][109]. The extracting solvent must possess higher density than water, high extraction capacity, and good chromatographic behavior. In classical DLLME, chlorinated solvents such as chloroform, carbon tetrachloride, chlorobenzene, or dichloromethane are the most commonly used extractive solvents. However, these solvents are toxic and harmful to the environment. Over recent years, DLLME has evolved, utilizing less toxic extracting solvents, such as ionic liquids (IL) or less dense extractant solvents than the aqueous phase, such as alcohols [104][105][106][108,109,110]. Ionic liquids (IL) exhibit unique properties, including negligible vapor pressure, miscibility with water and organic solvents, good solubility for organic and inorganic compounds, high temperature, stability, and respect for the environment. Additionally, they efficiently absorb and transfer microwave energy and are formed by a central molecule that combines organic cations and several anions [106][107][110,111].
Furthermore, DLLME can be coupled in a single step of in situ derivatization and extraction of analytes of interest and even combined with other extraction techniques, such as GDME or ultrasound-assisted extraction (UAE). Table 4 presents a comparison of the methods developed for the analysis of secondary peroxidation products using DLLME.
DLLME is characterized by its simplicity, speed, efficiency, and capacity for high enrichment due to the high proportion of donor and acceptor phases. Therefore, the most important parameters of DLLME are the selection of extraction conditions and the choice of dispersive solvents for analytes extraction. An appropriate dispersive solvent must be miscible with the extraction phase and the aqueous phase to create fine droplets in the sample matrices, thus enhancing the interaction between the two phases, resulting in high extraction efficiency.
The most commonly used dispersing solvents are acetone, acetonitrile, and short-chain alcohols (such as methanol, ethanol, and propanol) [105][109]. The extracting solvent must possess higher density than water, high extraction capacity, and good chromatographic behavior. In classical DLLME, chlorinated solvents such as chloroform, carbon tetrachloride, chlorobenzene, or dichloromethane are the most commonly used extractive solvents. However, these solvents are toxic and harmful to the environment. Over recent years, DLLME has evolved, utilizing less toxic extracting solvents, such as ionic liquids (IL) or less dense extractant solvents than the aqueous phase, such as alcohols [104][105][106][108,109,110]. Ionic liquids (IL) exhibit unique properties, including negligible vapor pressure, miscibility with water and organic solvents, good solubility for organic and inorganic compounds, high temperature, stability, and respect for the environment. Additionally, they efficiently absorb and transfer microwave energy and are formed by a central molecule that combines organic cations and several anions [106][107][110,111].
Furthermore, DLLME can be coupled in a single step of in situ derivatization and extraction of analytes of interest and even combined with other extraction techniques, such as GDME or ultrasound-assisted extraction (UAE). Table 4 presents a comparison of the methods developed for the analysis of secondary peroxidation products using DLLME.
Figure 4. Scheme of dispersive liquid-liquid microextraction (DLLME).
Table 4. Analytical method for determination of secondary peroxidation products by dispersive liquid-liquid microextraction (DLLME).
| Target Compound | Sample | DLLME | Derivative Reagent | Determ. | LOD µg/L or µg/Kg |
Rec. % |
Ref. | |||||||||||||||||||||
|---|---|---|---|---|---|---|---|---|---|---|---|---|---|---|---|---|---|---|---|---|---|---|---|---|---|---|---|---|
| Mode | Disperser | Extracting Solvent | T min |
T °C |
||||||||||||||||||||||||
| Formaldehyde | Beverages | MW-IL- | ACN | IL 3453W | 1.5 | - | DNPH | HPLC-UV | 0.12 | 85–95 | [108][112] | |||||||||||||||||
| Acrylamide | Brewed coffee | - | ACN | DCM | - | - | - | UPLC-MS/MS | 900 | 97–106 | ||||||||||||||||||
| HPLC-DAD | 1.2–1857.7 | >96% | [ | 55 | ||||||||||||||||||||||||
| α,β-Unsaturated Carbonyls | Acrolein | 107-02-8 | 2A | 7.5 | [25] | |||||||||||||||||||||||
| ] | ||||||||||||||||||||||||||||
| DNPH | HPLC-SP | 0.001–1.42 | 66–87% | [ | 65 | ] | [ | 109 | ] | [113] | ||||||||||||||||||
| PCB and acrylamide | Milk/Coffee | IL | [HeOHMIM][Cl] | [BMIM][NTf2] | - | - | - | HS-GC-ECD-MS | - | - | [110][114] | Diacetyl 1 | Wine | Immersed | 0.4 | |||||||||||||
| MDA, acrolein, 4-HNE | 20 | 65 | Beverages | O-PDA | US | ACN | CH3Cl | 5HPLC-UV | 3.8 | 60 °C- | [ | DNPH56] | GC-MS | 50–200 | 94–102 | [111] | 4-hydroxy-2-nonenal | 75899-68-2 | 3 | 1.5 ** | [26] | |||||||
| Acetaldehyde 1 | Wine | Immersed | 1.0 | 15 | 50 | DNPH | HPLC-UV | 800–1100 | - | [57 | ||||||||||||||||||
| MDA | Cod liver oil | HS | 10 | RT | PDMS/DVB | 200 | N-MH | GC-NPD | 0.74 | 91% | [66] | |||||||||||||||||
| Hexanal | Hazelnut | HS | 10 | 60 | CAR/PDMS | 300 | - | GC-FID | 8.01 | - | [67] | [115] | ] | |||||||||||||||
| 7 aldehydes | ||||||||||||||||||||||||||||
| Formaldehyde | Peanut, soybean and olive oils | HS | 15 | Milk | IL | MeOH50 | CAR/PDMS | 250 | IL 3453W | 0.75 | 45 °C- | GC-FID | 4.6–10.2 | 85–110 | [ | ACAC68 | UV | 100 | 91–103] | 4-hydroxy-2-hexenal | 17427-21-3 | 3 | 1.5 ** | [26] | ||||
| [ | 112 | ] | Diacetyl | Wine & beer | Suspended | 1.0 | 10 | 60 | O-PDA | DPV | 0.053 | |||||||||||||||||
| [ | 116 | ] | 3 α,β-UC | Sunflower oil digestion phases | HS | 60 | ||||||||||||||||||||||
| Acrylamide | Coffee, chocolate, roasted nuts, French fries, cereals, biscuits, chips, bread, and caramelized fruit |
SSA | SUPRAS-2 | - | (SDS/TBABr/AlCl3) | 50 | [ | 58 | ] | DVB/CAR/PDMS | 250 | 2 | - | - | UVGC-MS | - | - | 0.2 | 93–96 | [113][69] | [117] | Acrylamide | 79-06-1 | 2A | NE | [27 | ||
| α-DCC | Wine; black tea & soy sauce | Immersed 2 | ] | |||||||||||||||||||||||||
| 0.5 | 10 | 55 | O | -PDA | HPLC-UV | 50–200 | - | [ | 59 | ] | ||||||||||||||||||
| 100 carbonyl compounds | Cod liver oil | HS | 60 | 50 | DVB/CAR/PDMS | 220 | - | GC-MS | - | - | [70] | |||||||||||||||||
| Acrylamide | Nuts and seeds | - | PCE | EtOH | 3 | - | Xanthydrol | GC-MS | 0.6 | 95 | [114][118] | Crotonaldehyde | 4170-30-3 | 2B | - | |||||||||||||
| MDA | ||||||||||||||||||||||||||||
| 18 VOC | ||||||||||||||||||||||||||||
| Acrylamide | Potato chips | UAE | - | |||||||||||||||||||||||||
| Vegetable oil | Suspended | 0.5 | 30 | 65 | TBA | HPLC-UV/FLD | 250–350 | ≥82% | Sunflower oil emulsions | [60] | HS | 30 | 50 | DVB/CAR/PDMS | 250 | - | GC-MS | - | - | [71] | Dicarbonyls | Malondialdehyde | 102-52-3 | 3 | 30 ** | |||
| 4 aldehydes Acrolein & MDA | Vegetable oil | |||||||||||||||||||||||||||
| Aldehydes & 2-pentylfuran | [ | Suspended | 26 | ] | ||||||||||||||||||||||||
| Soybean oils | 1.0 | 10 | 60 | DPNH | GC-MS | 50–100 | ≥95% | [ | 10 | ] | Glyoxal | 107-22-2 | - | 200 | [28] | |||||||||||||
| Methylglyoxal | 78-98-8 | 3 | - | - | ||||||||||||||||||||||||
| Diacetyl | 431-03 | - | 900 * | [28] | ||||||||||||||||||||||||
| Furans | Dihydro-2(3H)-furanone | 96-48-0 | 3 | - | - | |||||||||||||||||||||||
| Furfural | 98-01-1 | 3 | 500 | [29] | ||||||||||||||||||||||||
IARC, International Agency for Research on Cancer; bw, body way; a Acceptable intake reported at µg/day; * Acceptable daily intake; ** Threshold of toxicological concern set by The International Programme on Chemical Safety (IPCS); NE, non-established.
Additionally, the European Food Safety Authority (EFSA) establishes tolerable daily intake values based on available toxicological information [26][27][28][29][30][26,27,28,29,30]. In cases where toxicological data are lacking for certain secondary peroxidation products, safety measures such as Acceptable Daily Intake (ADI) or Threshold of Toxicological Concern (TTC) can be applied [31].
Quantifying primary peroxidation products is challenging due to their reactivity and volatility [32]. Therefore, the measurement of secondary lipid peroxidation products is commonly used as biomarkers to monitor oxidative stress within cells [33]. Additionally, these products can serve as markers of food quality to assess the oxidative state of food products [34]. Various analytical techniques have emerged in recent years for analyzing and quantifying carbonyl compounds, with applications in food, biological, and environmental studies [33][35][33,35]. These methods primarily involve spectrometry and chromatography technologies [35]. A direct measurement of carbonyl compounds offers non-destructive and specific approaches, minimizing sample contamination risks due to their natural occurrence [35][36][37][38][35,36,37,38]. Direct methods for carbonyl compound analyses in food mainly employ flame ionization detectors (FID) and electron capture detectors (ECD). However, they may have increased detection limits due to potential analyte degradation within the detector [36][37][38][36,37,38]. In contrast, indirect methods offer a way to detect secondary peroxidation products by forming carbonyl adducts, which are determined using ultraviolet (UV), fluorescence (FLD), and mass spectrometry (MS) [10][39][40][41][42][43][10,39,40,41,42,43].
The traditional thiobarbituric acid (TBA) reactive substances (TBARS) assay has been employed to determine carbonyl compounds as lipid peroxidation products in biological and food samples [39]. This assay involves the reaction with TBA to form a chromophore detectable by spectrophotometric methods [39][43][39,43]. However, TBARS lack specificity due to interactions with various organic compounds [39]. Therefore, some applications incorporate a separation step, often via liquid chromatography (LC), before determination [43
| PCE | |||||||||||||||||||||||||
| EtOH | |||||||||||||||||||||||||
| 2 | |||||||||||||||||||||||||
| - | |||||||||||||||||||||||||
| Xanthydrol | GC-MS | 0.6 | 97 | [ | 115 | ] | [ | 119 | ] | ||||||||||||||||
| HS | 55 | 50 | DVB/CAR/PDMS | 250 | - | GC-MS | - | - | [ | 72 | ] | ||||||||||||||
| Acrylamide | Cereal products | - | PCE | EtOH | 1 | - | Xanthydrol | GC-MS | 0.6 | 95 | [116][120] | 2 ketones & diacetyl | Ground bread | Suspended | 0.5 | 15 | 65 | O-PDA | HPLC-UV | 6–12 | - | [61] | |||
| VOC | Peanut oil | HS | 40 | ||||||||||||||||||||||
| Acrylamide | Bread | UAE | 50 | PDMS/DVB | 250 | PCE | MeOH | 1 | - | Xanthydrol | GC-MS | 0.54 | 98 | [ | 27 carbonyl compounds 3 | Green & roast coffee beans | Suspended | 0.5 | 16 | 40 | O-PDA | HPLC-DAD | 50–200 | - | [62] |
1 free and total; 2 0.22 um PVDF membrane; 3 Qualitative analysis; LOD, limit of detection; Ref., reference; DNPH, 2,4-dinitrophenylhydrazine; HBA, 4-hydrazinobenzoic acid; O-PDA, O-phenylenediamine; α-DCC, α-dicarbonyl compounds; MDA, malondialdehyde; TBA, 2-thiobarbituric acid; DPV, differential pulse voltammetry.
3. Solid-Phase Microextraction
SPME (Figure 3) is a well-established sample preparation technique commonly used in analytical chemistry to extract and concentrate target compounds from various sample matrices before analysis [49][51][63][49,51,63]| - |
| GC-MS | |||||||||||||||||||||||
| - | |||||||||||||||||||||||
| - | |||||||||||||||||||||||
| [ | |||||||||||||||||||||||
| 73 | |||||||||||||||||||||||
| ] | |||||||||||||||||||||||
| 117 | ] | [ | 121 | ] | 4 aldehydes & 1 ketone | Roast & boiled duck | HS | 40 | 45 | CAR/PDMS | 280 | - | GC-MS | - | - | [74] | |||||||
| 4 aldehydes Acrolein & MDA | Vegetable oil | US | ACN | CH3Cl | 5 | 60 | DPNH | GC-MS | 50–100 | ≥95% | 10 | 3 aldehydes | Chicken patties | HS | 10 | 60 | DVB/CAR/PDMS | 250 | - | GC-FID | - | - | [75] |
| Hexanal | Pig sausages | HS | 30 | 50 | DVB/CAR/PDMS | 220 | - | GC-MS | - | - | [76] | ||||||||||||
| 2 aldehydes & 2 dialdehydes | Cod | HS | 30 | 50 | CAR/PDMS | 260 | - | GC-FID | - | - | [77] | ||||||||||||
| 8 aldehydes | Fish | HS | 15 | 60 | PDMS/DVB | 260 | PFBHA | GC-MS | 1.4–6.1 | 79–102 | [78] | ||||||||||||
| 6 aldehydes | Caviar | HS | 30 | 60 | DVB/CAR/PDMS | 250 | - | GC-MS | - | - | [79] | ||||||||||||
| 198 VOCs | Dry cured meat | HS | 30 | 37 | 260 | - | GC-MS | - | - | [80] | |||||||||||||
| Aldehydes | Infant formula | HS | 10 | 25 | PDMS/DVB | 250 | - | GC-MS | - | - | [81] | ||||||||||||
| 3 aldehydes & pentane | Infant formula | HS | 45 | 37 | CAR/PDMS | 250 | - | GC-FID | 0.02–1.05 | - | [82] | ||||||||||||
| 13 Carbonyl compounds | Milk powder | HS | 45 | 43 | 250 | - | GC-MS | 2–6 | - | [83] | |||||||||||||
| VOC | Smoked cheese | HS | 45 | 50 | CAR/PDMS | 260 | - | GC-MS | - | - | [84] | ||||||||||||
| VOC | Mozzarella | HS | 15 | 37 | 220 | - | GC-MS | - | - | [85] | |||||||||||||
| VOC | Portuguese cheese | HS | 45 | 50 | DVB/PDMS | 250 | - | GC-MS | - | - | [86] | ||||||||||||
| 9 aldehydes | Beer | HS | 60 | 50 | PDMS/DVB | 250 | PFBHA * | GC-MS | - | 89–114 | [87] | ||||||||||||
| 41 carbonyl compounds | Beer | HS | 40 | 60 | PDMS/DVB | 250 | PFBHA *,** | GC-MS | 0.003–20,000 | - | [88] | ||||||||||||
| 250 carbonyl compounds | Beer | HS | 20 | 45 | PDMS/DVB | 250 | PFBAH ** | GC-ITMS | 0.003–0.510 | 88–114 | [89] | ||||||||||||
| 6 carbonyl compound | Beer | HS | 60 | 55 | DVB/CAR/PDMS | 250 | TFEH ** | GC-MS | 0.03–0.5 | 90–105 | [16] | ||||||||||||
| 6 carbonyl compound | Craft beer | HS | 60 | 55 | DVB/CAR/PDMS | 250 | TFEH ** | GC-MS | 0.03–0.5 | 90–105 | [90] | ||||||||||||
| 18 carbonyl compound | Wine | HS | 45 | 40 | DVB/CAR/PDMS | 250 | - | GC-ITMS | 0.62–129.2 | 19–190 | [91] | ||||||||||||
| 80 VOC | Wine | HS | 30 | 40 | DVB/CAR/PDMS | 240 | - | GC-MS | - | - | [92] | ||||||||||||
| 6 carbonyl compound | Syrah wines | HS | 45 | 55 | DVB/CAR/PDMS | 250 | TFEH | GCxGC-TOFMS | 0.5–5.2 | 90–106 | [93] | ||||||||||||
| 3 aldehydes | Must & wine | HS | 45 | 55 | DVB/CAR/PDMS | 250 | TFEH | GC-qMS | 0.1–0.8 | 90–102 | [94] | ||||||||||||
| 38 carbonyl compound | Port wine | HS | 20 | 32 | PDMS/DVB | 250 | PFBHA | GC-MS | 0.006–0.089 | 88–119 | [95] | ||||||||||||
| 45 carbonyl compound | Wine | HS | 20 | 40 | PDMS/DVB | 250 | PFBHA | GC-MS/MS | - | 71–146 | [96] | ||||||||||||
| 9 aldehydes | Spirits and alcoholic beverages | DI | 15 | 20 | PDMS | 250 | PFBHA | GC-ECD | 0.05–0.5 | - | [97] | ||||||||||||
| VOC & SVOC | Beer, wine & whisky | HS | 60 | 30 | PDMS CAR/PDMS DVB/CAR/PDMS |
250 260 260 |
- | GC-MS | - | - | [11] | ||||||||||||
| 20 aldehydes | Green pomace distillates | HS | 40 | 55 | PDMS/DVB | 250 | PFBHA | GC-MS | 0.0007–0.02 | 76–110 | [98] | ||||||||||||
| 107 VOC | Cider | HS | 30 | 50 | DVB/CAR/PDMS | 250 | - | GC-MS | - | - | [99] | ||||||||||||
| 53 carbonyl compounds | Huangjiu (alcoholic beverage) | HS | 35 | 45 | DVB/CAR/PDMS | 250 | PFBHA | GC-MS/MS | - | 71–146 | [100] | ||||||||||||
| 2 α-DCC | Soybean paste, red pepper past, soy sauce, wine, beer, distilled liquor | HS | 20 | 85 | DVB/CAR/PDMS | 240 | TFEH | GC-MS | 0.7–1.1 | 92–104 | [101] |
LOD, limit of detection; HS, headspace; 4-HNE, 4-hydroxy-2-nonenal; DI, direct immersion; DVB, divinylbenzene; CAR, carboxen®; PDMS, polydimethylsiloxane; DNPH, 2,4-dinitrophenylhydrazine; MDA, malondialdehyde; N-MH, N-methylhydrazine; α-β-UC, α-β-unsaturated carbonyl compound; VOC, volatile organic compounds; SVOC, semi volatile organic compounds; α-DCC, α-dicarbonyl compound, * on fiber derivatization, ** in-solution derivatization.
However, information on the applications of SPME in the determination of volatile compounds from lipids decomposition in foods are limited. Additionally, a notable limitation of the SPME technique is the lack of reproducibility when using different fibers, especially from different batches. Consequently, most comparative studies are carried out with a single fiber to address this limitation.
4. Dispersive Liquid-Liquid Microextraction
DLLME (Figure 4) is a miniaturized LLE technique introduced by Rezaee et al. [102][106]. Since its introduction in 2006, this technique garnered the interest of analysts and has been widely used for the extraction of various types of analytes from different matrices, such as water, tissues, biological fluids, and food matrices [103][104][LOD, limit of detection; Determ., determination; Rec., recovery; Ref., reference; MW, Microwave; IL, Ionic liquid; IL 3453W, Trihexyltetradecylphosphonium Chloride; DNPH, 2,4-dinitrophenylhydrazine; DCM, Dichloromethane; PCB, polychlorinated biphenyls; MDA, malondialdehyde; US, Ultrasound; UAE, ultrasound-assisted extraction; PCE, tetrachloroethylene, SSA, supramolecular solvent-assisted; ACAC, acetylacetone in an ammonium acetate (2.0% v/v).