Submitted Successfully!
To reward your contribution, here is a gift for you: A free trial for our video production service.
Thank you for your contribution! You can also upload a video entry or images related to this topic.
Version Summary Created by Modification Content Size Created at Operation
1 + 8463 word(s) 8463 2021-12-28 09:22:29 |
2 format correct -126 word(s) 8337 2022-02-07 01:39:34 | |
3 Roll back entry to make some changes. -1156 word(s) 7181 2022-02-07 03:03:04 | |
4 format correct -4102 word(s) 3079 2022-02-17 08:46:33 | |
5 format correct -4109 word(s) 3072 2022-02-17 09:02:45 | |
6 format correct + 6 word(s) 3078 2022-02-17 09:05:49 | |
7 format correct -147 word(s) 2925 2022-02-17 09:10:25 | |
8 format correct -147 word(s) 2925 2022-02-17 09:15:28 |

Video Upload Options

Do you have a full video?

Confirm

Are you sure to Delete?
Cite
If you have any further questions, please contact Encyclopedia Editorial Office.
Papamichael, I.; Pappas, G. Gamified Waste Management Tool. Encyclopedia. Available online: https://encyclopedia.pub/entry/19114 (accessed on 24 July 2024).
Papamichael I, Pappas G. Gamified Waste Management Tool. Encyclopedia. Available at: https://encyclopedia.pub/entry/19114. Accessed July 24, 2024.
Papamichael, Iliana, Georgios Pappas. "Gamified Waste Management Tool" Encyclopedia, https://encyclopedia.pub/entry/19114 (accessed July 24, 2024).
Papamichael, I., & Pappas, G. (2022, February 06). Gamified Waste Management Tool. In Encyclopedia. https://encyclopedia.pub/entry/19114
Papamichael, Iliana and Georgios Pappas. "Gamified Waste Management Tool." Encyclopedia. Web. 06 February, 2022.
Gamified Waste Management Tool
Edit

Waste management is an increasingly visible and essential element to functioning civilization. However, while the theory of waste management is studied widely, waste management remains for many a difficult concept to understand. There is an opportunity to create an informative, easy-to-use simulator to help all types of individuals build an understanding of waste management and to evaluate the impact of various changes on waste management performance, particularly in the context of gamified tools. 

waste management gamified tools gamification Key Performance Indicators Strategy Development Simulation Modelling Environmental Performance Unified Metrics Urban Development Green City

1. Introduction

Waste management is an increasingly visible and essential element to functioning civilization. It is a particularly critical area of study in addressing growing climate [1] and public health [2] crises, yet in-depth exploration of this important topic is often not feasible to the average person as knowledge barriers and challenges relating to data access hinder public education efforts. In truth, it is these “average” individuals who most contribute to these problems and—through behavioral changes—might best support their amelioration.
Increasing public awareness of challenges and opportunities in waste management has the potential to bring about significant positive change. However, while the theory of waste management is studied widely, and observational data from real, waste management remains for many a difficult concept to understand–particularly as far as drivers of change are concerned. For many, a lack of “hands on” data makes developing intuition difficult. For others, poor understanding of critical evaluative performance metrics makes it tough to understand what effect policies might have on waste generation and management.
Though tools have been developed to quantify waste management efficacy, and simulators have been built to allow individuals to “pull the levers” in a virtual environment to gauge their impact, these metrics and simulators are needlessly complex and therefore only serve a small audience. Existing simulations map inputs to performance indicators, requiring a complex setup to develop and adapt models for environments such as cities. This expertise requirement poses a barrier to knowledge that limits individuals’ understanding of waste management systems, whereas broader knowledge of waste management could contribute positively towards the creation of enhanced social policies and constituent engagement in an effort to reduce and manage waste.
There is an opportunity to create an informative, easy-to-use simulator to help all types of individuals build an understanding of waste management and to evaluate the impact of various changes on waste management performance, particularly in the context of gamified tools. Building an understanding of challenges and opportunities within a larger network has the potential to drive positive change in waste generation and management. 

2. History

Within cities, large populations and small regional boundaries lead to significant accumulation of solid waste, making waste management—whether through reduction, reuse, or recycling—essential. While waste is typically undesirable, elements of its management can be made “fun” through the exploration of waste management techniques in games such as those related to city building. One such example is the SimCity franchise of games, which was first released in 1989 and has since witnessed four significant updates. Each version includes increasingly-advanced waste management features. Haupt, Arnold, and Bidlingmaier found that SimCity 3000 (1999) and SimCity 4 (2003) included infrastructure systems that were comparable to real-world cities and realistic enough to support research [3][4]SimCity 4’s updated waste management system (elements of which are visible in Figure 1) is notable as the definitive version for research [4]. In this model, all waste created in the city fall are grouped together as “garbage”, though there are three different ways to dispose of the city’s waste: landfill, recycling, and energy conversion, with each having positive and negative associated attributes. Landfill is inexpensive when disposing of waste in small amounts, but it becomes expensive to maintain as the landfill reaches capacity—and residents find proximity to the dump undesirable. Recycling reduces the percentage of garbage relative to waste within the city, but may be cost-prohibitive. The waste-to-energy plant creates power for the city while eliminating significant waste, but it creates pollution and generates small amounts of power. SimCity 4 informs users of how well they manage the city’s waste through different reporting means, including the city’s desirability score and the user’s Mayor Rating (https://simcity.fandom.com/wiki/Mayor_rating, accessed on 13 December 2021), which both depend partially on how much garbage has piled up within the city. This rating varies from −100 to 100 and indicates citizens’ approval of the mayor based on policies enacted, decisions made, and city statistics. The metric provides a quick “gut check” for players to determine sentiment related to their policies comprising social, economic, and other factors in one key performance indicator.
Figure 1. Landfill and waste-to-energy plant are potential options for waste management in SimCity 4.
Other city-building games have been used for urban development and waste management research –Fernández and Ceacero-Moreno [5] tested Cities: Skylines (2015) to see if it met the standards necessary to train environmentalists with gamified training scenarios as well as to see if it was able to correctly identify and manage natural hazards that occurred in the city. Cities: Skylines was also tested and scored in waste management, as well as energy production, and health systems, and it was deemed sufficiently realistic to be used in gamified learning [5]Cities: Skylines is like SimCity 4 in that it groups all types of waste as garbage, and all garbage can be treated or disposed of through various means. In Cities: Skylines (Figure 2), waste disposal options include a floating garbage collector for contaminated water, an incineration plant, a landfill site, a recycling center, an ultimate recycling plant, a waste disposal unit, a waste processing complex, and a waste transfer facility. These methods all have trade-offs, such as the waste disposal unit creating a small amount of energy in exchange for a lot of pollution. One notable way in which Cities: Skylines varies from SimCity is that some methods, such as the waste processing complex and the recycling center, produce recycled materials from the waste, providing users with incentive to buy into more expensive recycling methods. Every building in the city also has a garbage buildup meter showing how much garbage the building has and its remaining capacity. If a building fills up with garbage, users are informed of the need to empty the building lest it be abandoned. Research into both the SimCity franchise and Cities: Skylines shows that commercial games are realistic enough to be viable for use in gamified research and education, which makes their systems valuable to urban planning and waste management.
Figure 2. The Recycling Center, Incineration Plant, and Landfill Site are among the waste management options available to players of Cities: Skylines.
There have been recent research efforts to study the use of serious games in teaching and evaluating strategies for urban waste management. Wu and Huang created a waste management simulation game (Figure 3) that allows participants to control a city including its waste management, and see the ramifications of their decisions on the city [6]. Simulation users see waste accumulating in their city through a representative number of trashed 3D soda cans that litter the city’s streets if waste is not adequately managed. The effects of this waste are also communicated to users through “official reports”, which provide users with feedback and results related to their waste management choices, for example with one report informing users that the dogs in the city are getting sick as a result of consuming trash. Wu and Huang tested their waste management simulation on two subject groups, Taiwanese undergraduate students and Taiwanese elementary school students, and tracked both groups’ decisions relating to balancing economic growth and the ecological effects of increased pollutants. Their research found that the undergraduate students generally put more importance on economic growth while ignoring the negative effects on the environment, while the group of elementary school students tried to balance economic growth with limiting environmental pollution, leading to issues with untenable resource allocation in other areas. Both situations focus on a core concept in teaching waste management, notably that there must be compromise. A city may hire more waste management workers and build more garbage trucks, but that will come at a monetary and environmental cost—not to mention the need to sequester or otherwise dispose of the waste.
Figure 3. Wu and Huang’s Waste Management Simulation Game evaluated two groups’ planning decisions with respect to economic and environmental impact (Adapted with permission from Ref. [6]).
Wood of War is a serious game for waste management research created by Salazar et al. [7]. This game (Figure 4) uses mobile user data to identify areas with excessive solid waste build-up in Colima, Mexico throughout gameplay, and then compares these data to a map of areas in Colima, Mexico with significant amounts of rainfall to identify potential risk points where rain and trash could mix, blocking sewer drains and causing flooding. The game encourages players to go to these areas to destroy or dispose of enemies modeled to resemble sentient trash into piles of waste. Users are given extra points if they find a new area of excess waste and tag it using GPS for the developers [7]. This cycle of finding enemies in the real-world waste and finding trash-laden locations for more points-bearing enemies keeps game participation high and allows the developers to collect data valuable to local waste removal services [7]. Serious games like Wood of War can be specialized to a specific area of need like Colima, Mexico, where urbanization has been steadily growing in recent years while the waste management system is struggling to keep up with its urban population’s excess waste. The game identifies areas of importance for waste management officials to address such that associated negative externalities, such as flooding from blocked sewer drains, can be managed responsively. Understanding where waste build-up occurs most frequently by using the game’s data can also help officials build more efficient waste removal routes.
Figure 4. Wood of War encourages players to map trash by using real-world data to spawn trash monsters (Adapted with permission from Ref. [7]).
Other gamified software for waste management is the Multi-Agent-Based Modelling environment NetLogo [8] (Figure 5), developed in 1997 by Professor Uri Wilensky at the Center of Connected Learning(CCL) at Tufts University. This programmable software has been used in the modeling process in different areas including teaching, education, and research.
Figure 5. NetLogo was used to model and project waste management in the Norte Pioneiro region of Parana (Adapted with permission from Ref. [9]).
Eunice David Likotiko, Devotha Nyambo, and Joseph Mwangoka used NetLogo for the real-time simulation of waste management decisions. In the simulation, citizens are involved in optimizing the cost of waste collection services as well as providing decision algorithms to determine the best mobility for waste collections and bins. The authors’ model verified the optimal waste collection route, aiding the development of smart and innovative waste management systems and modeling for real life scenarios. Continuous empirical data and Geographical Information Systems(GIS) are proposed to be used for further model extensions [10].
Addressing sociotechnical aspects of waste management, Vitor Miranda de Souza et al. [9] used the dynamics of waste generation, disposal and collection to assess the eco-effectiveness of a solid waste management plan using NetLogo. The authors assessed the eco-effectiveness of Parana’s Norte Pioneiro region, forecasting waste generation, collection, and other waste management processes. Different population growth scenarios were simulated from 2020–2038, with different criteria analyzed to generate success metrics. This illustrates how NetLogo and similar ABMs may be used to inform socio-technical and socio-economic aspects of waste management plans as well as model the influence of policy [9].
Table 1. Comparison of waste grouping, disposal methods, notification methods, and use cases for Waste Management Systems in Gamified Tools and Commercial Games.
Commercial Games
/Research Tools
Information about Waste
Management Systems
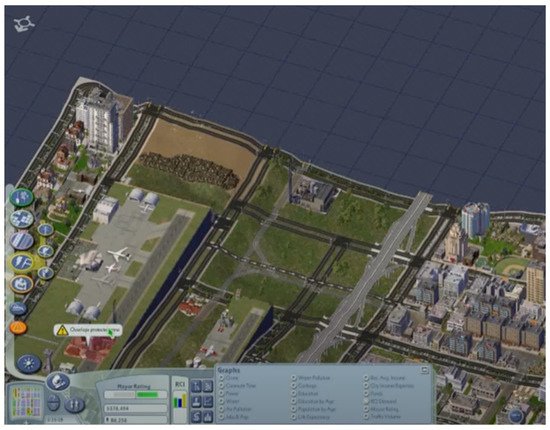
SimCity 4 All waste lumped as “garbage”
Multiple disposal avenues
(Landfill, Recycling, Waste-to-Energy)
Waste accumulation reported though
desirability reports, Mayor Rating
Cities: Skylines All waste lumped as “garbage”
Multiple disposal avenues
(Landfill, Recycling, Incinerator, Waste Processing, …)
Waste accumulation reported though
feedback bubbles
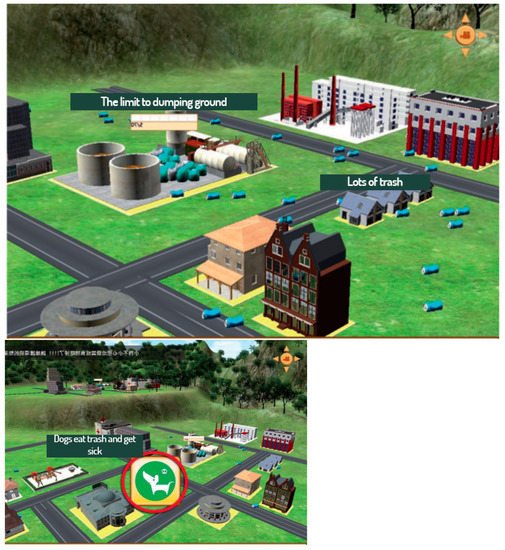
Wu and Huang’s
Research Tool [6]
All waste lumped as “garbage”
Multiple disposal avenues
(Waste Product Dump, Incinerator, Environment Factory,
Trading Companies)
Waste accumulation reported though
reports of garbage-driven natural disasters
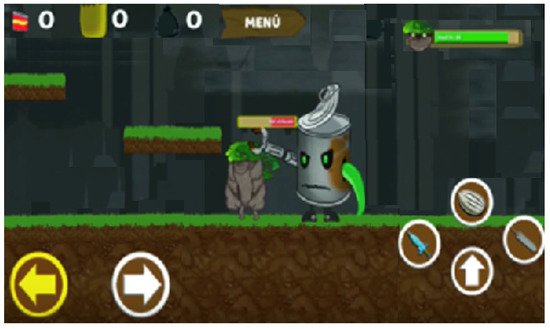
Wood of War Multiple waste monsters found with varied garbage piles
Waste disposed of by defeating monsters
Real-world waste reported through GPS tags
Real-world waste build-up is communicated to
developers, authorities
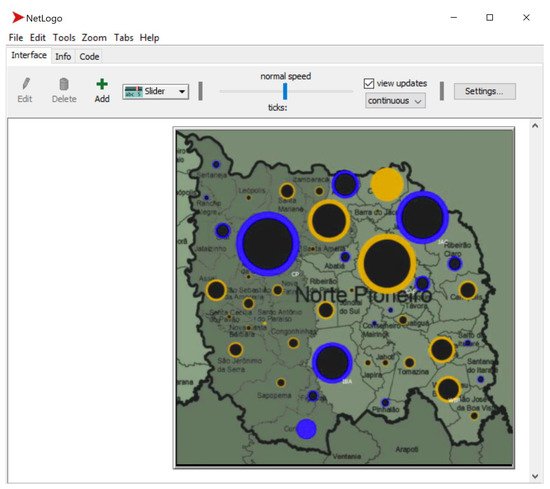
NetLogo All waste types lumped
Sociotechnical approach for complex waste management
and decision-making
Waste management parameters (agents) executed serially.
Empirical calibration necessary to mirror real-world scenarios.
A clear opportunity remains to develop a tool that combines gamification and ease-of-use with robust simulation and easy-to-read performance metrics to provide a quick feedback loop relating to policy and other changes.

3. Current Status

The main scene is the interactive core of this application. It features an imaginary virtual city with population of 100,000 people that is comprised of nine areas laid out in a 3 × 3 matrix (Figure 7). Each area has unique and distinct parameters that may be randomly defined or tuned related to waste generation and management. When the main scene is loaded, the player camera moves from a close-up view to a top-down perspective to allow an overview of the entire city in a single window. From this top-down view, players are able to select and engage with the various interactive areas and elements of the city.

Upon loading the main scene, each area is automatically assigned with a random population number out of specific options. These options are 1500, 2000, 5000, 6500, 7000, 10,000, 18,000, 20,000, and 30,000 to sum to 100,000. The total population of 100,000 people helps to simplify calculations for the user. The graphics and the building models including houses do not reflect the numbers of the area population assigned but are representative and increase user engagement and relatability. In Figure 7, the population of Area11 was automatically set to 2000 people by the tool. The rest areas were assigned with each area having the value of one of the remaining choices from the options list.

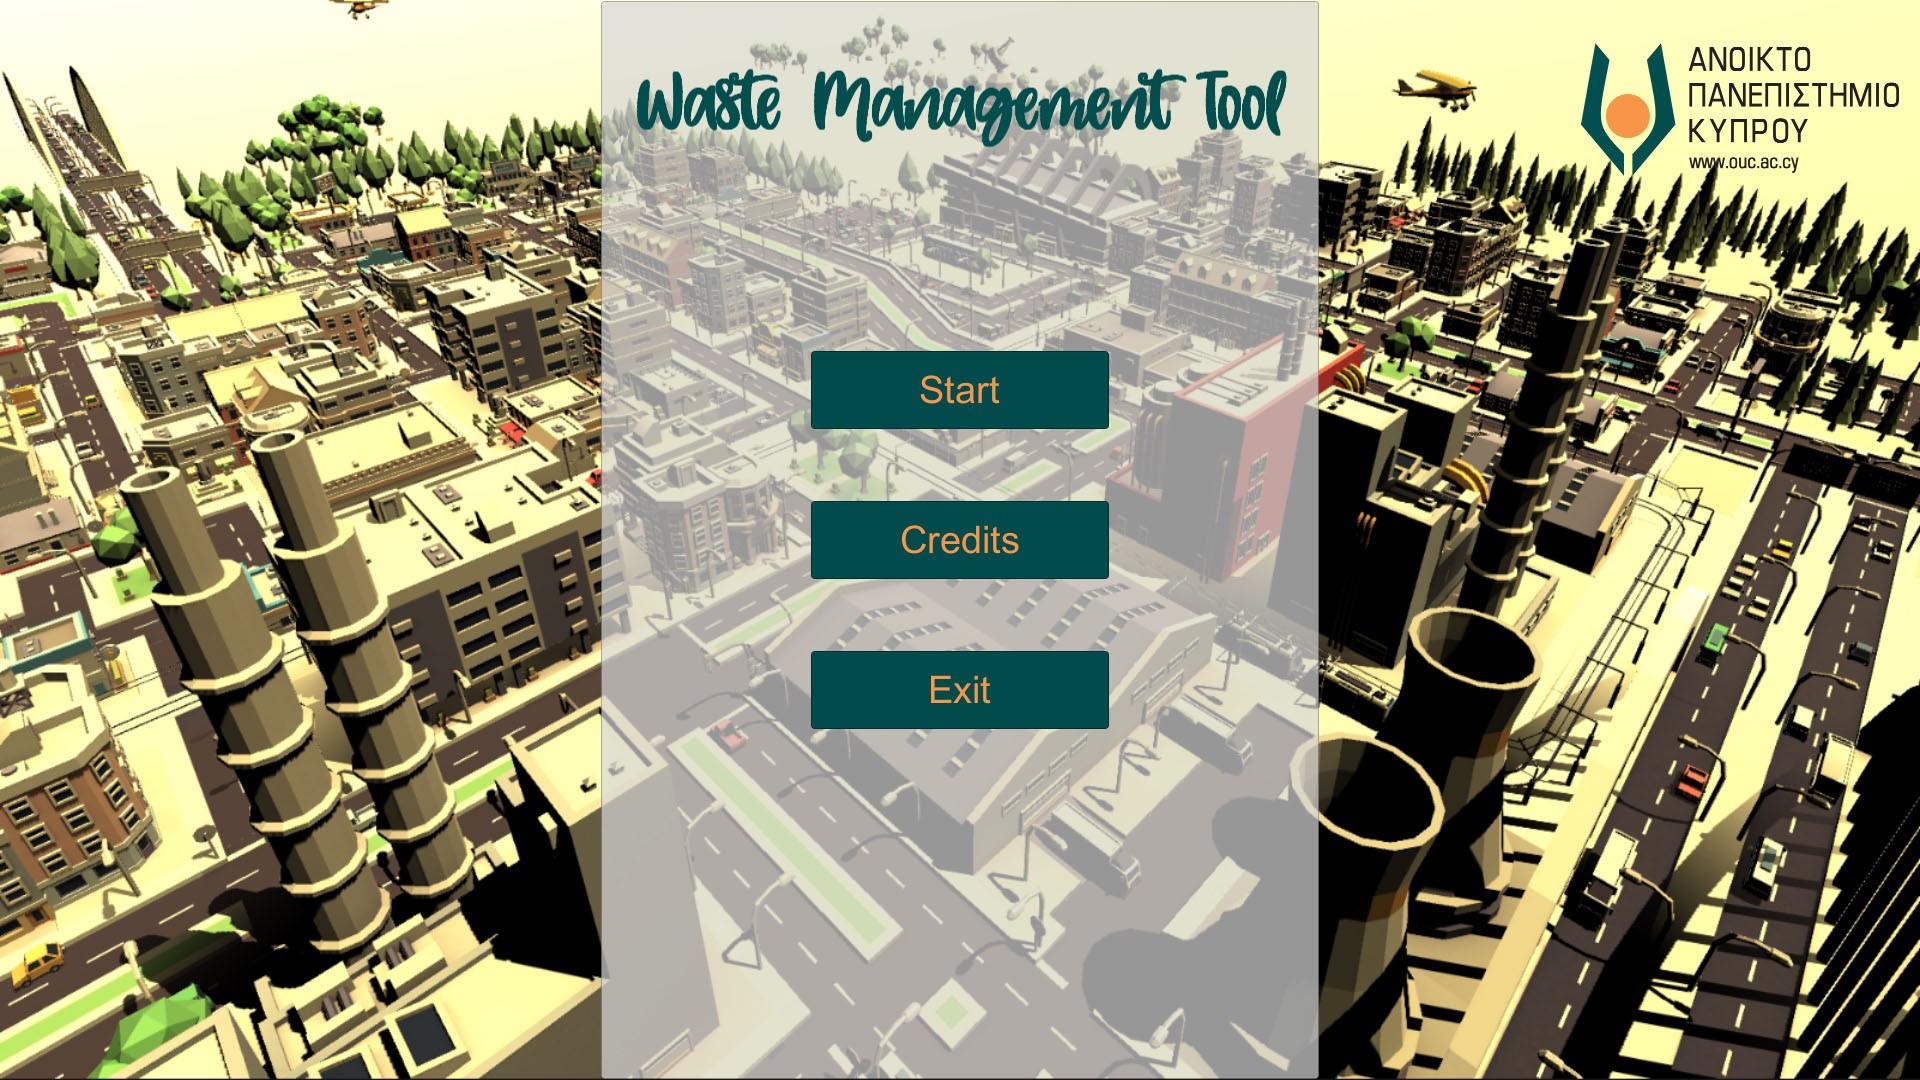
Figure 6. The Waste Management Tool’s main menu allows players to start the simulator, view the credits, or exit the game.

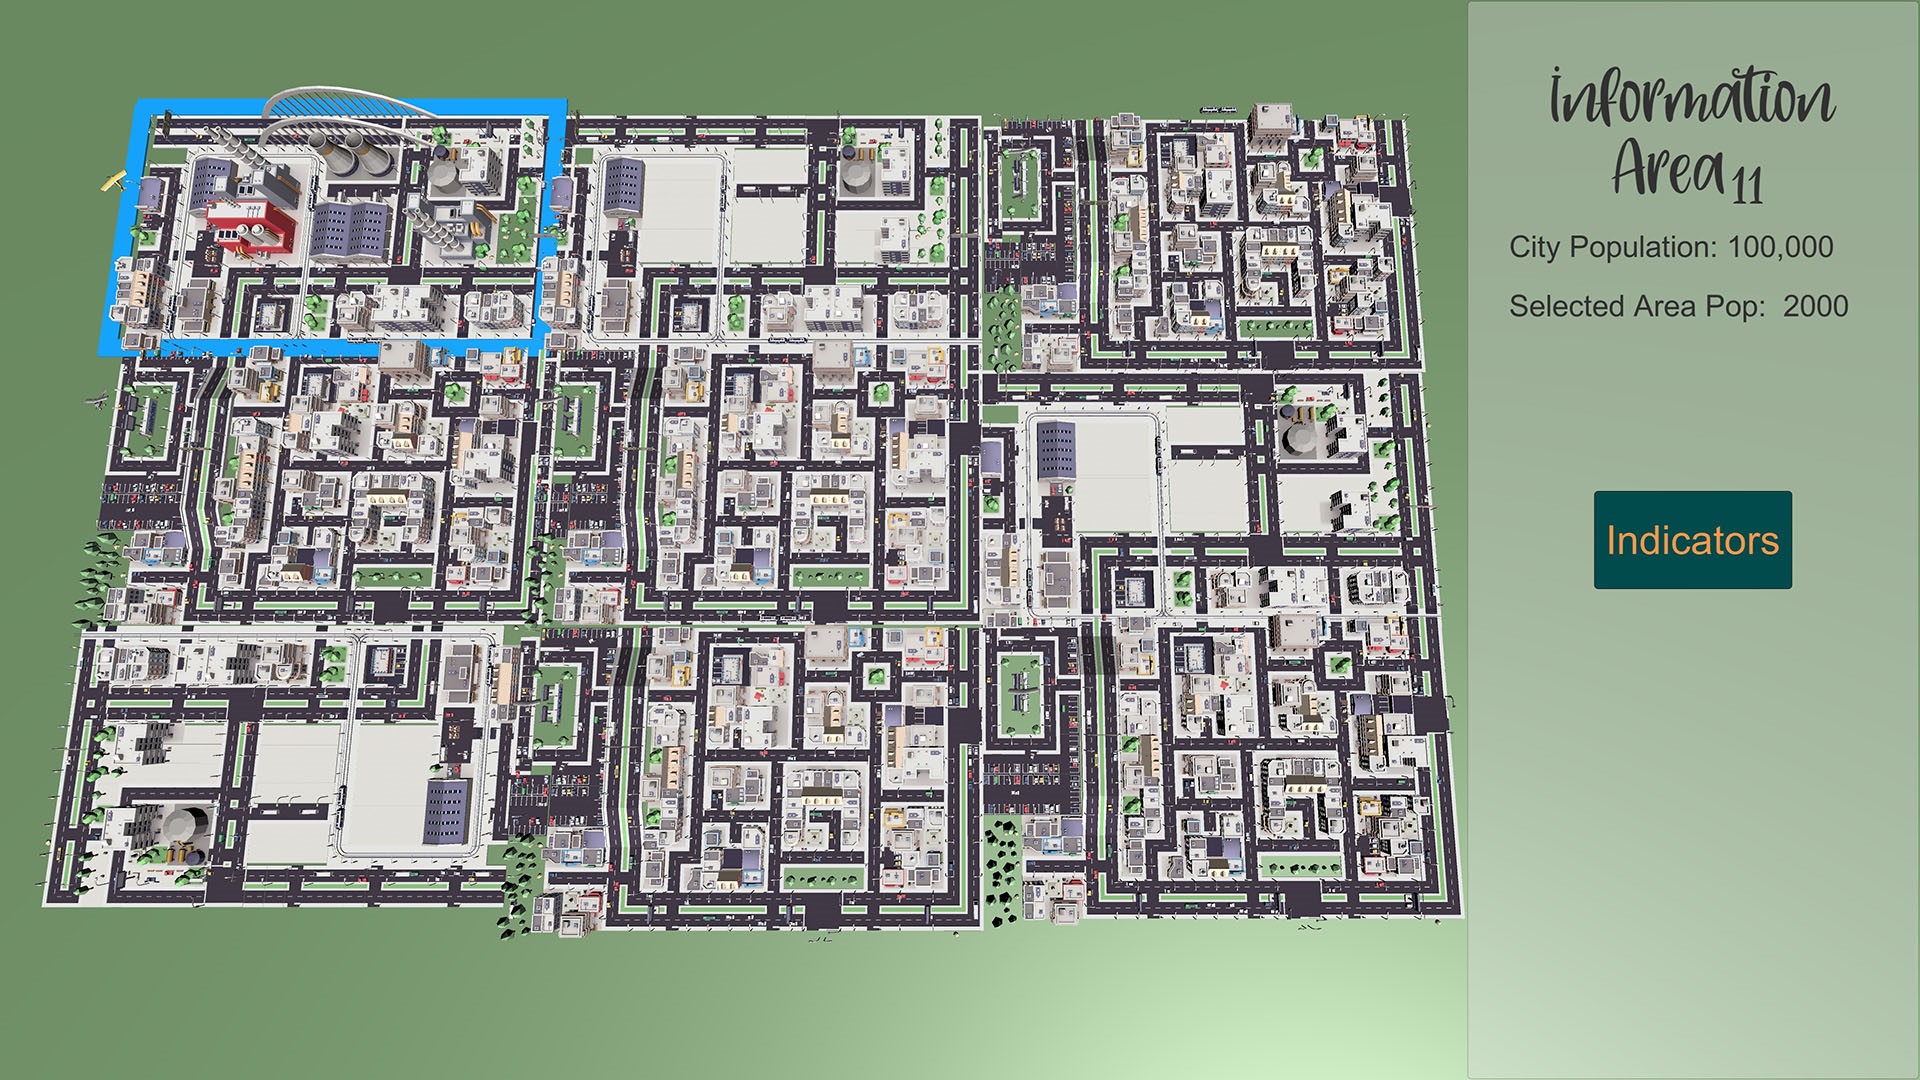
Figure 7. The Main Scene features a top-down view of the city, divided into nine parts. Each part can be highlighted, selected, and clicked to view information about waste management KPIs and policies in that region.

Having selected a specific area of the virtual city, the users may press the “Indicators” button on the right side of their screen. After doing so, a panel with the indicators (Figure 8) for the selected area appears.

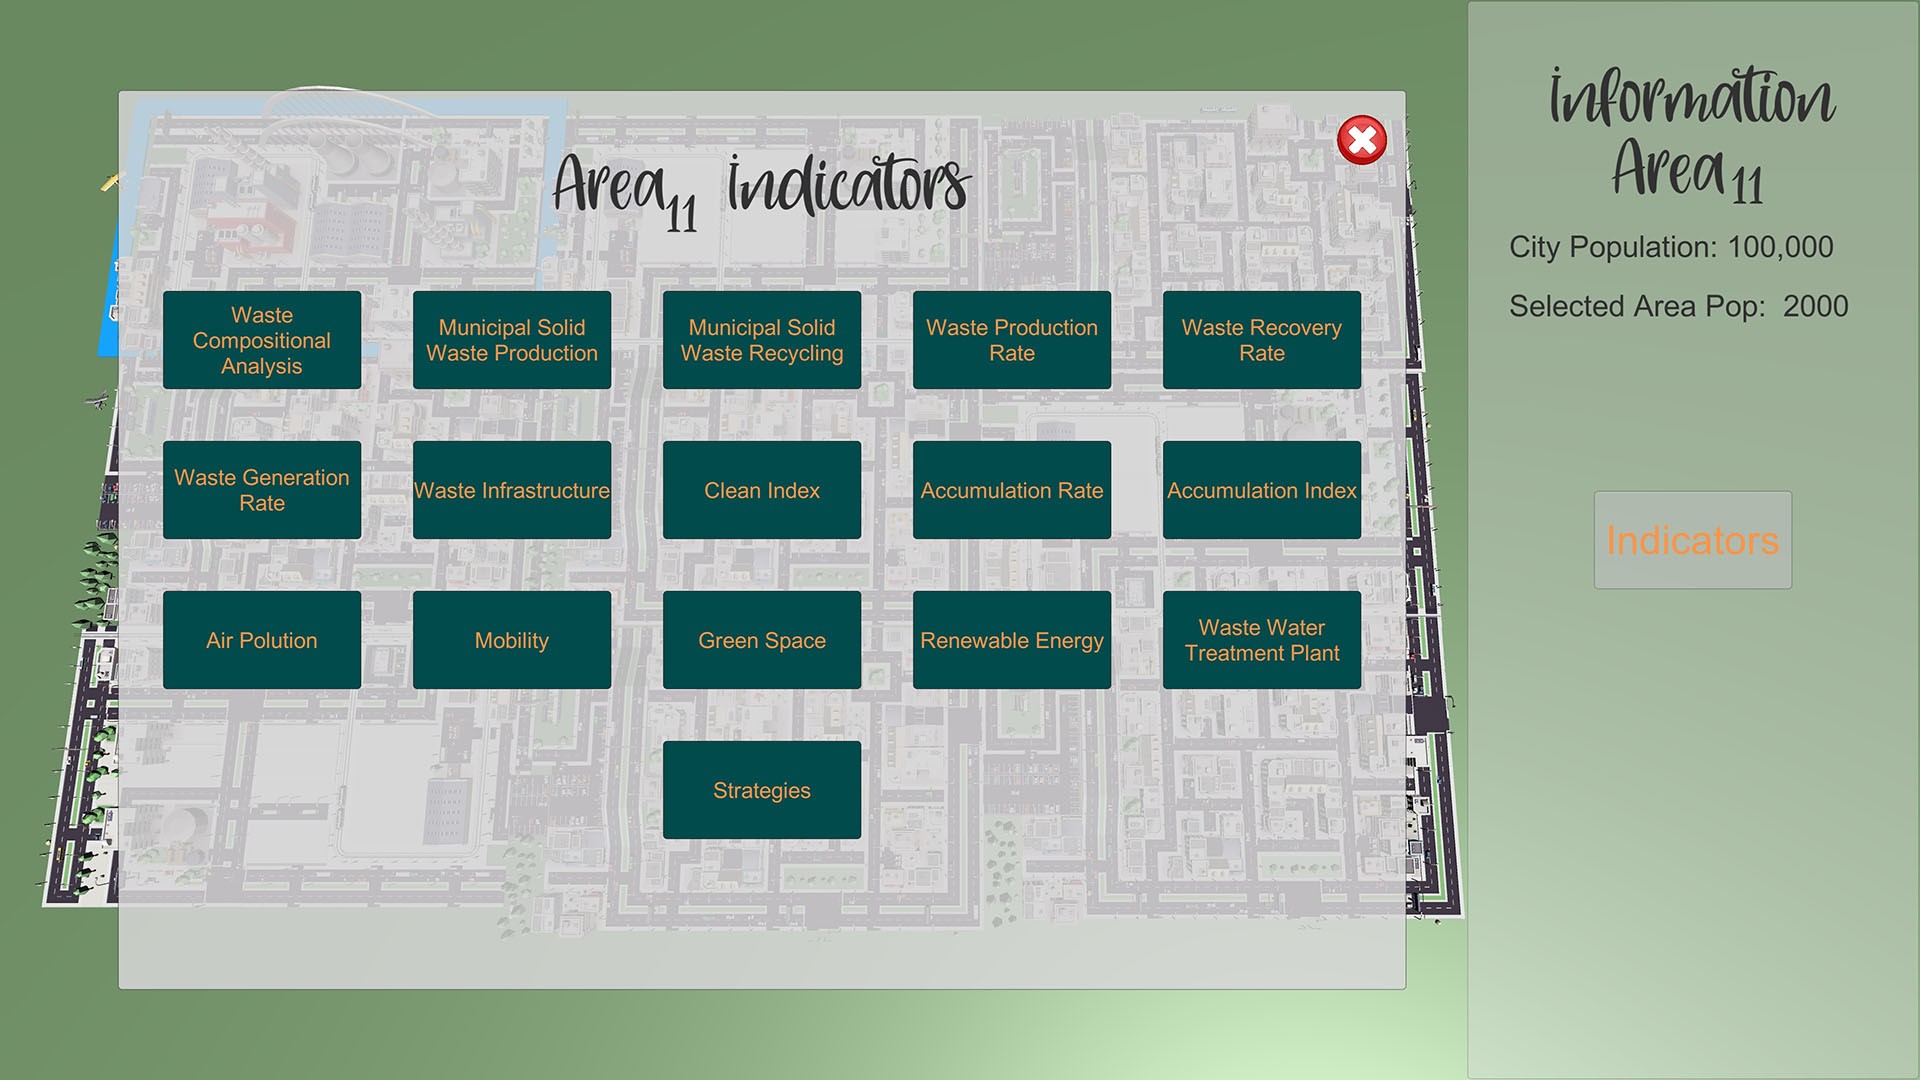
Figure 8. Key performance indicators for each region are shown on a dashboard to provide a high-level, easily interperable overview of waste management performance.

Table 2. Waste Compositional Analysis categories for a population of 100,000 people and possible range in tn for each of the categories (figures per [11]). This table is used only for designing purposes and its amounts were later scaled to express the upper and lower bounds of each of the area population options.

Categories of Waste

Scaled Est. Amount (tn)

Range (tn)

PMD

7639

5000–10,000

Plastic Film

3588

2000–5000

Plastics Non-Recyclable

1835

1000–3000

Aluminium/Ferrous

682

500–1000

Paper

8572

6000–10,000

Glass

4327

3000–5000

Toilet and Kitchen Paper

9652

8000–11,000

Food Waste (edible)

12,055

10,000–14,000

Food Waste (inedible)

4091

3000–5000

Organic Waste (Green Waste, Yard Waste)

22,243

20,000–25,000

Others

6494

5000–7000


Table 3. The Lower and Upper Bounds for each of the categories for all population options. These values were scaled based on the range from Table 15.


Population: 1500

Population: 2000

Population: 5000

Population: 6500

Population: 7000

Population: 10,000

Population: 18,000

Population: 20,000

Population: 30,000

Lower Bound

Upper Bound

Lower Bound

Upper Bound

Lower Bound

Upper Bound

Lower Bound

Upper Bound

Lower Bound

Upper Bound

Lower Bound

Upper Bound

Lower Bound

Upper Bound

Lower Bound

Upper Bound

Lower Bound

Upper Bound

PMD

750

1500

100

200

250

500

325

650

350

700

500

1000

900

1800

1000

2000

1500

3000

Plastic Film

300

750

40

100

100

250

130

325

140

350

200

500

360

900

400

1000

600

1500

Plastic Non Recyclable

150

450

20

60

50

150

65

195

70

210

100

300

180

540

200

600

300

900

Aluminun/ Ferrous

75

150

10

20

25

50

32

65

35

70

50

100

90

180

100

200

150

300

Paper

900

1500

120

200

300

500

390

650

420

700

600

1000

1080

1800

1200

2000

1800

3000

Glass

450

750

60

100

150

250

195

325

210

350

300

500

540

900

600

1000

900

1500

Toilet and Kitchen paper

1200

1650

160

220

400

550

520

715

560

770

800

1100

1440

1980

1600

2200

2400

3300

Food Waste Edible

1500

2100

200

280

500

700

650

910

700

980

1000

1400

1800

2520

2000

2800

3000

4200

Food Waste Inedible

450

750

60

100

150

250

195

325

210

350

300

500

540

900

600

1000

900

1500

Organic Waste

3000

3750

400

500

1000

1250

1300

1625

1400

1750

2000

2500

3600

4500

4000

5000

6000

7500

Others

750

1050

100

140

250

350

325

455

350

490

500

700

900

1260

1000

1400

1500

2100

Similar to the area populations, the tool automatically loads the lower and upper bounds for the relevant population number. At the same time, it randomly sets a new value in the respective sliders for each category, creating a unique but broadly-similar city waste footprint for each user. A representative example for Area11 is showcased in Figure 9. Users may then choose to change these values.

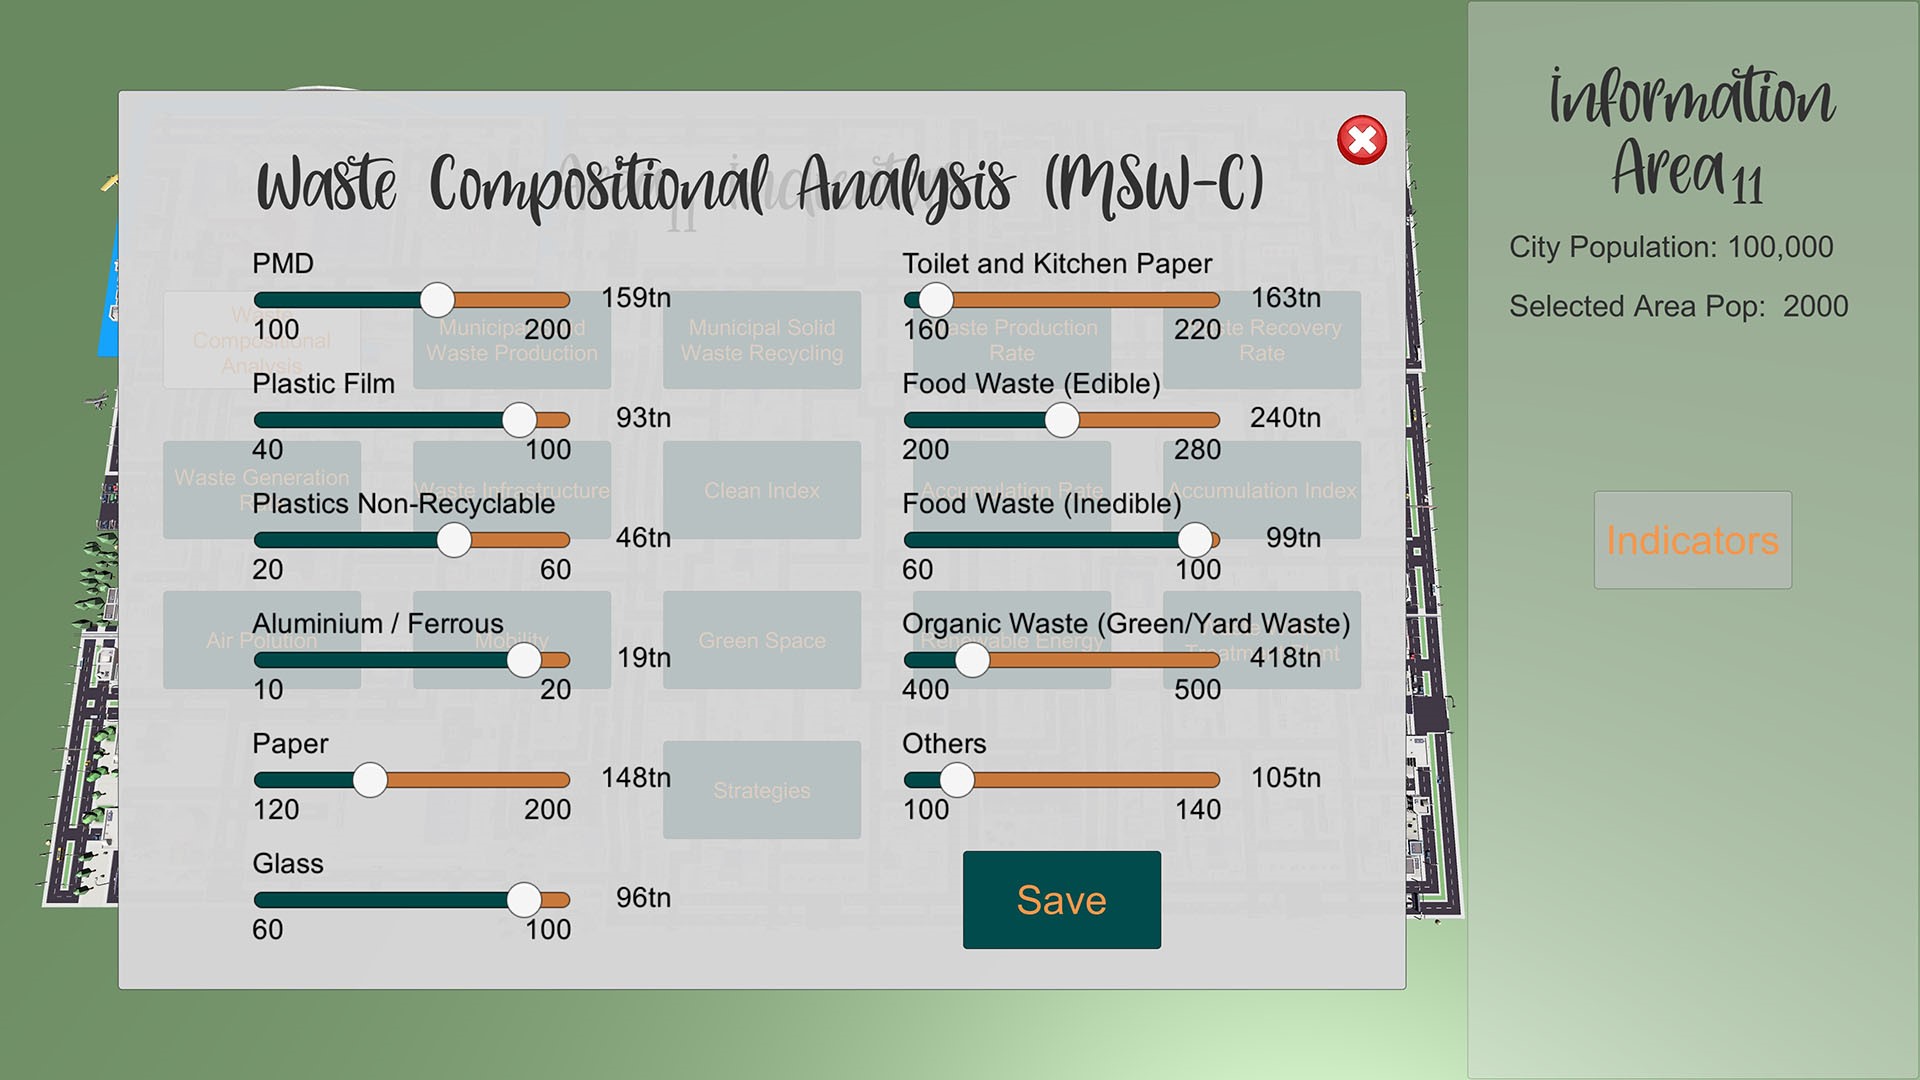
Figure 9. Each area’s waste generation and policy parameters can be altered independently.

The Municipal Solid Waste Production KPI (MSW-P). This KPI does not have any user-configurable categories and is completely independent of MSW-C. This value comes from the division of the total amount of waste divided by the population of the area.

Based on the tool’s randomly-generated amounts (Figure 9) and the population of Area11, (2000):

Q T o t ( t ) Q P O P ( t ) = 159 + 93 + 46 + 19 + 148 + 96 + 163 + 240 + 99 + 418 + 105 2000 = 0.793

The result is the same as the calculated one in Equation (15). This result can change in real time when a slider value from MSW-C panel is also changed.

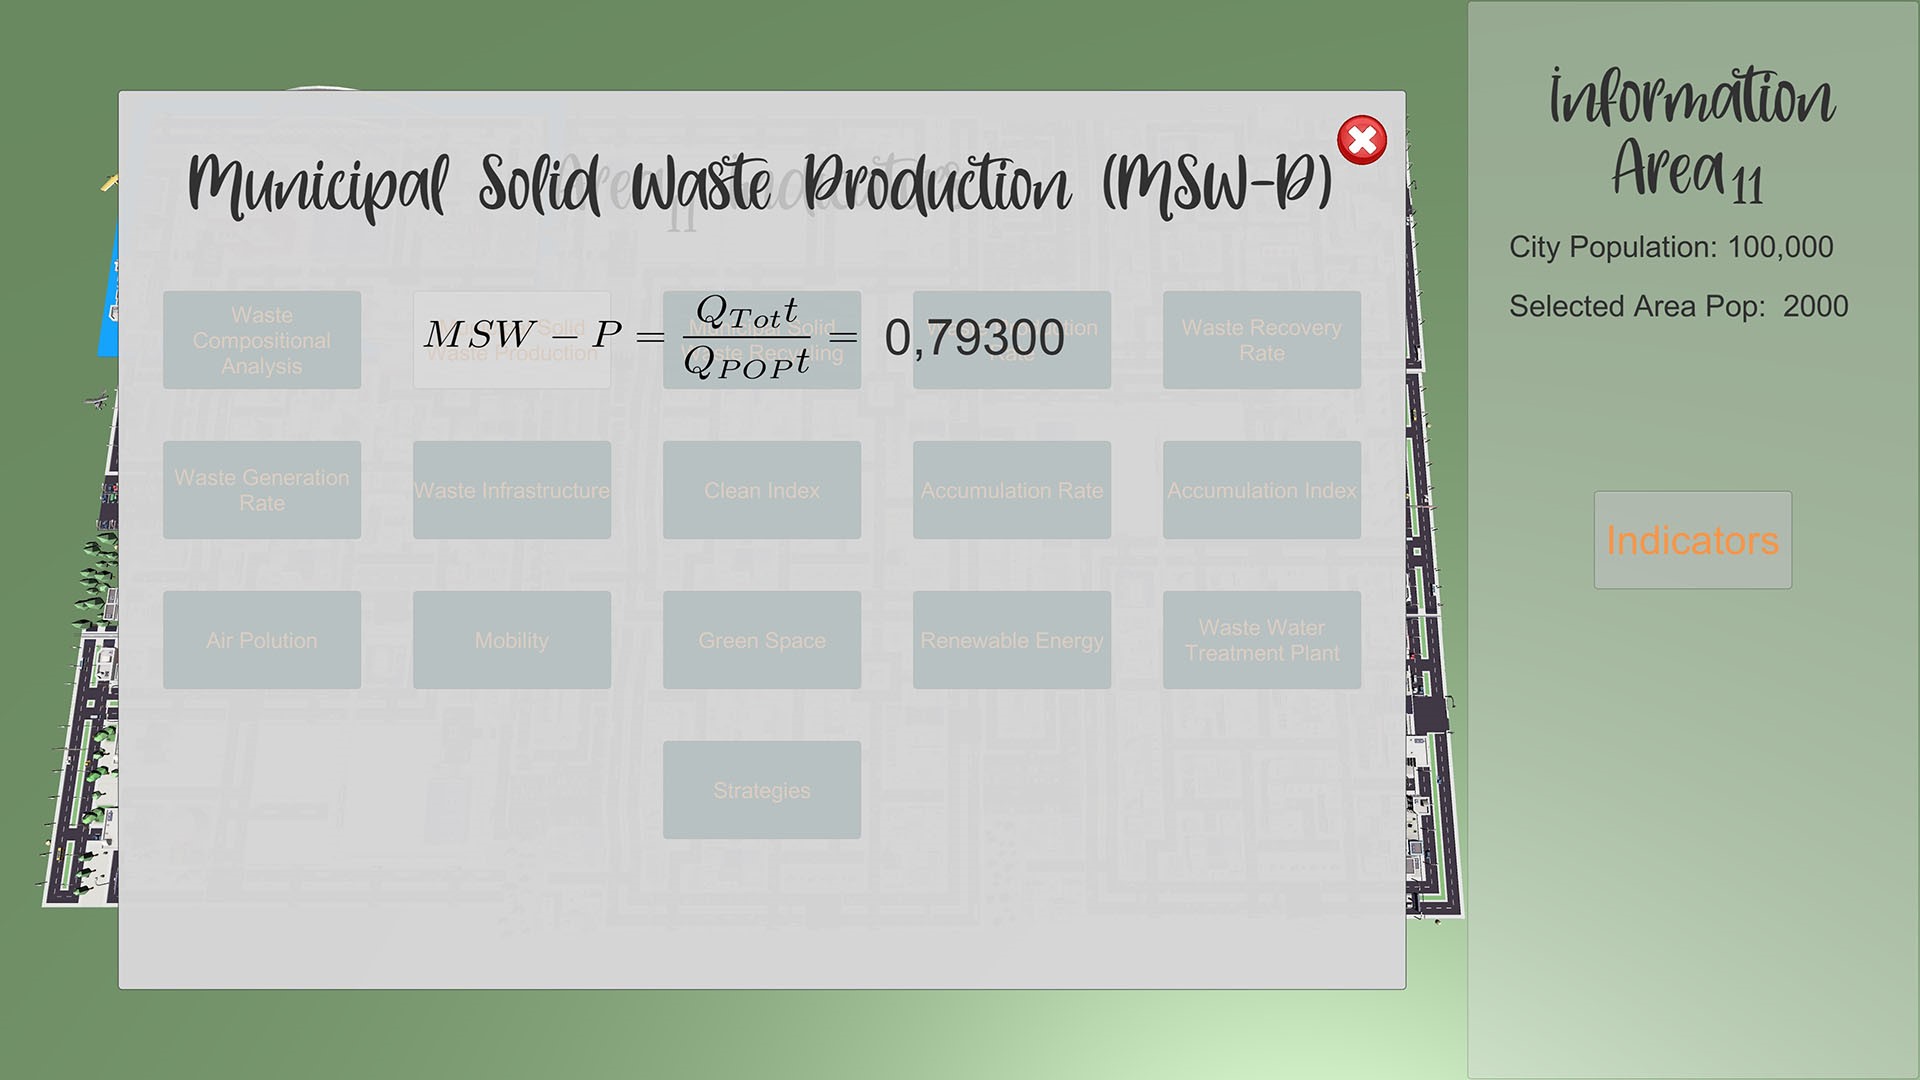
Figure 10. Clicking each metric provides information about how it is calculated, which helps students learn to create effective management policies. These indicators reflect the parameters as identified in Section 3 (note that due to regional differences, the figure shows a comma rather than a period in the numeric text).

These examples are representative of how all models involved in the computation of waste production and management are handled in the game design.

Using these indicators, along with configurable elements thereof, allows individuals to use the game as a means of modelling waste generation and management. Through study and play, users may learn those metrics most affecting waste production and mitigation in order to inform effective policies for diverse scenarios.

With the game created and reflecting the model developed in Section 3, this tool will be used to enable a range of academic studies that will be the subject of future work. Ongoing work will conduct playtesting with diverse constituents, the feedback from which will be fed into a version of the game to be made freely available to researchers (please contact the authors for additional information).

References

  1. Ackerman, F. Waste management and climate change. Local Environ. 2000, 5, 223–229.
  2. Seeberger, J.; Grandhi, R.; Kim, S.S.; Mase, W.A.; Reponen, T.; Ho, S.m.; Chen, A. Special report: E-waste management in the united states and public health implications. J. Environ. Health 2016, 79, 8–17.
  3. Haupt, T.; Arnold, U.; Bidlingmaier, W. Studien-und Hochschulübergreifender Einsatz Einer Engl.-spr. Multimedialen Urban Infrastructure Development Simulation in der Akademischen Ausund Weiterbildung-MUrIDS (Cross-Study and Cross-University Use of an English Multimedia Urban Infrastructure Deve. Workshop: Multimedia in Bildung und Wirtschaft–Einsatz und Nachhaltigkeit von eLearning, Volume 22, p. 5. Available online: https://his-he.de/fileadmin/user_upload/Publikationen/Projektberichte_alte_Website/Hochschulplanung/hp165.pdf (accessed on 24 October 2021).
  4. Arnold, U.; Söbke, H.; Reichelt, M. Simcity in infrastructure management education. Educ. Sci. 2019, 9, 209.
  5. Fernández, P.; Ceacero-Moreno, M. Urban sustainability and natural hazards management; designs using simulations. Sustainability 2021, 13, 649.
  6. Wu, K.C.; Huang, P.Y. Treatment of an Anonymous Recipient: Solid-Waste Management Simulation Game. J. Educ. Comput. Res. 2015, 52, 568–600.
  7. Lepe-Salazar, F.; Cortés-Álvarez, T.; Serratos-Chávez, E.; Jáuregui-Flores, L.; Juárez-Cervantes, E.; Valdovinos-López, R.; Rincón-Martínez, D.; la Madrid, R. A Game-Based Service to Mitigate the Risk of Inundations Caused by Solid Waste Accumulation. In Making Smart Cities More Playable: Exploring Playable Cities; Nijholt, A., Ed.; Springer: Singapore, 2020; pp. 279–299.
  8. Wilensky, U. NetLogo. 1999. Available online: http://ccl.northwestern.edu/netlogo/ (accessed on 24 October 2021).
  9. de Souza, V.M.; Bloemhof, J.; Borsato, M. Assessing the eco-effectiveness of a solid waste management plan using agent-based modelling. Waste Manag. 2021, 125, 235–248.
  10. Likotiko, E.; Nyambo, D.; Mwangoka, J. Multi-Agent Based IoT Smart Waste Monitoring and Collection Architecture. Int. J. Comput. Sci. Eng. Inf. Technol. 2017, 7, 1–14.
  11. Zorpas, A.A.; Lasaridi, K.; Voukkali, I.; Loizia, P.; Chroni, C. Household waste compositional analysis variation from insular communities in the framework of waste prevention strategy plans. Waste Manag. 2015, 38, 3–11.
More
Information
Contributors MDPI registered users' name will be linked to their SciProfiles pages. To register with us, please refer to https://encyclopedia.pub/register : ,
View Times: 1.0K
Entry Collection: Environmental Sciences
Revisions: 8 times (View History)
Update Date: 17 Feb 2022
1000/1000
Video Production Service