Waste management is an increasingly visible and essential element to functioning civilization. However, while the theory of waste management is studied widely, waste management remains for many a difficult concept to understand. There is an opportunity to create an informative, easy-to-use simulator to help all types of individuals build an understanding of waste management and to evaluate the impact of various changes on waste management performance, particularly in the context of gamified tools.
- waste management
- gamified tools
- gamification
- Key Performance Indicators
- Strategy Development
- Simulation
- Modelling
- Environmental Performance
- Unified Metrics
- Urban Development
- Green City
1. Introduction
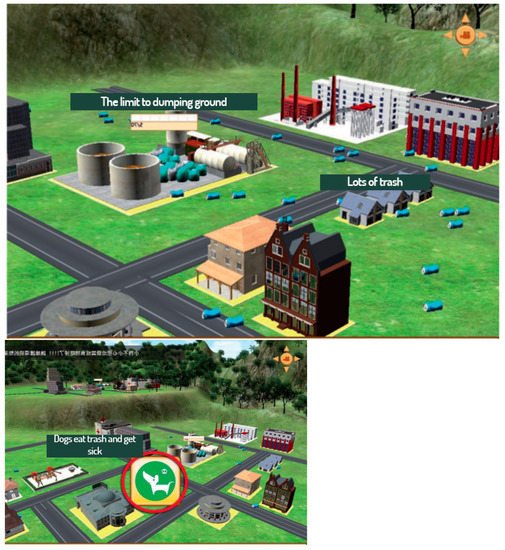
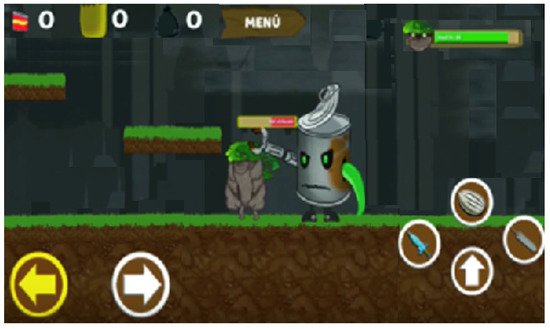
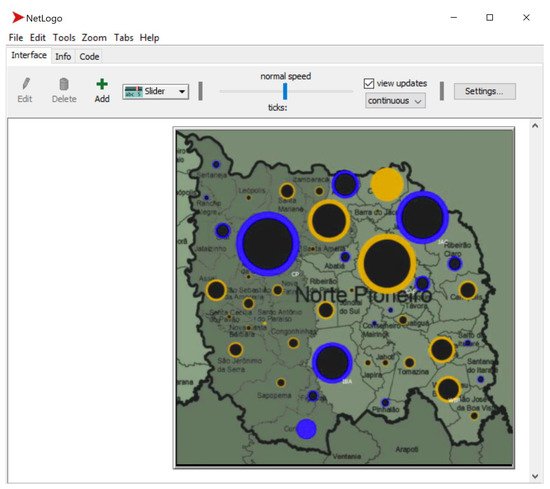
2. History


| Commercial Games /Research Tools |
Information about Waste Management Systems |
|---|---|
| SimCity 4 | All waste lumped as “garbage” |
| Multiple disposal avenues (Landfill, Recycling, Waste-to-Energy) |
|
| Waste accumulation reported though desirability reports, Mayor Rating |
|
| Cities: Skylines | All waste lumped as “garbage” |
| Multiple disposal avenues (Landfill, Recycling, Incinerator, Waste Processing, …) |
|
| Waste accumulation reported though feedback bubbles |
|
| Wu and Huang’s Research Tool [6] |
All waste lumped as “garbage” |
| Multiple disposal avenues (Waste Product Dump, Incinerator, Environment Factory, Trading Companies) |
|
| Waste accumulation reported though reports of garbage-driven natural disasters |
|
| Wood of War | Multiple waste monsters found with varied garbage piles |
| Waste disposed of by defeating monsters Real-world waste reported through GPS tags |
|
| Real-world waste build-up is communicated to developers, authorities |
|
| NetLogo | All waste types lumped |
| Sociotechnical approach for complex waste management and decision-making |
|
| Waste management parameters (agents) executed serially. Empirical calibration necessary to mirror real-world scenarios. |
3. Current Status
The main scene is the interactive core of this application. It features an imaginary virtual city with population of 100,000 people that is comprised of nine areas laid out in a 3 × 3 matrix (Figure 7). Each area has unique and distinct parameters that may be randomly defined or tuned related to waste generation and management. When the main scene is loaded, the player camera moves from a close-up view to a top-down perspective to allow an overview of the entire city in a single window. From this top-down view, players are able to select and engage with the various interactive areas and elements of the city.
Upon loading the main scene, each area is automatically assigned with a random population number out of specific options. These options are 1500, 2000, 5000, 6500, 7000, 10,000, 18,000, 20,000, and 30,000 to sum to 100,000. The total population of 100,000 people helps to simplify calculations for the user. The graphics and the building models including houses do not reflect the numbers of the area population assigned but are representative and increase user engagement and relatability. In Figure 7, we see that the population of Area11 was automatically set to 2000 people by the tool. The rest areas were assigned with each area having the value of one of the remaining choices from the options list.
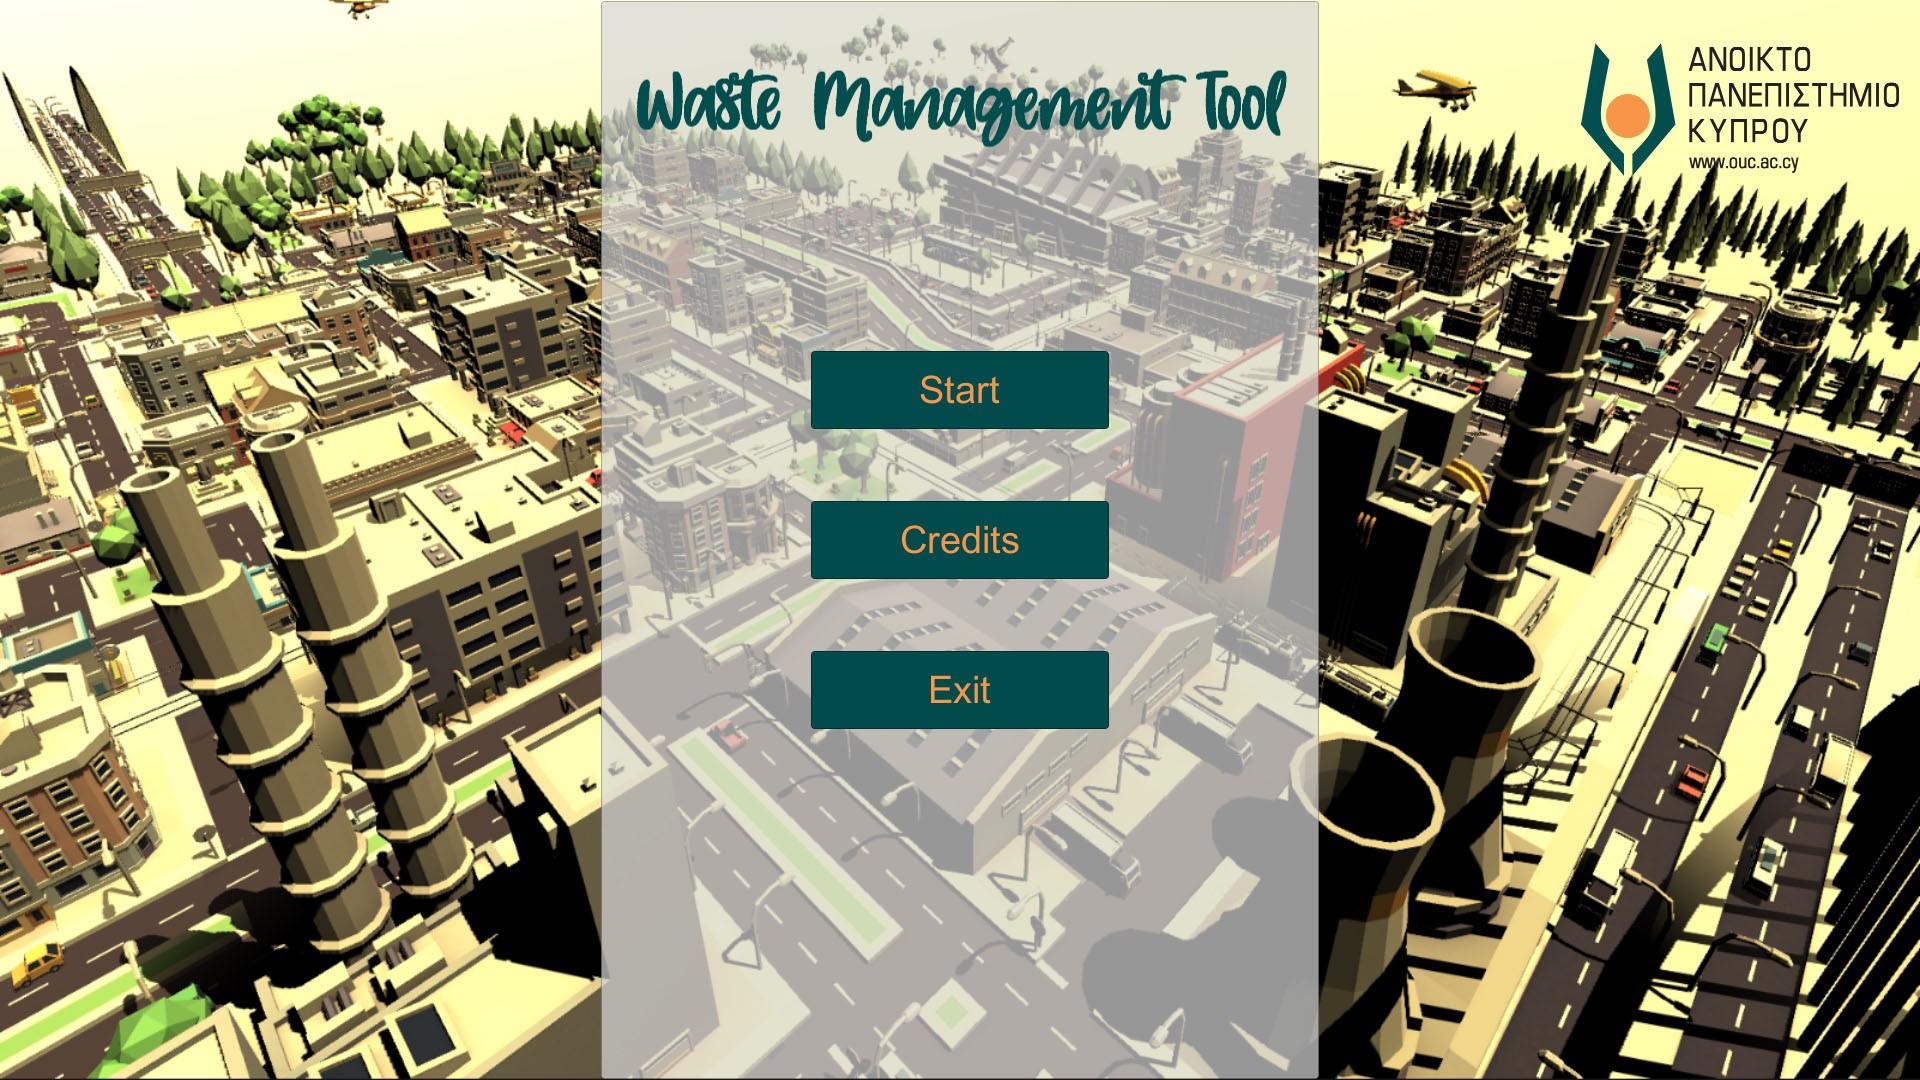
Figure 6. The Waste Management Tool’s main menu allows players to start the simulator, view the credits, or exit the game.
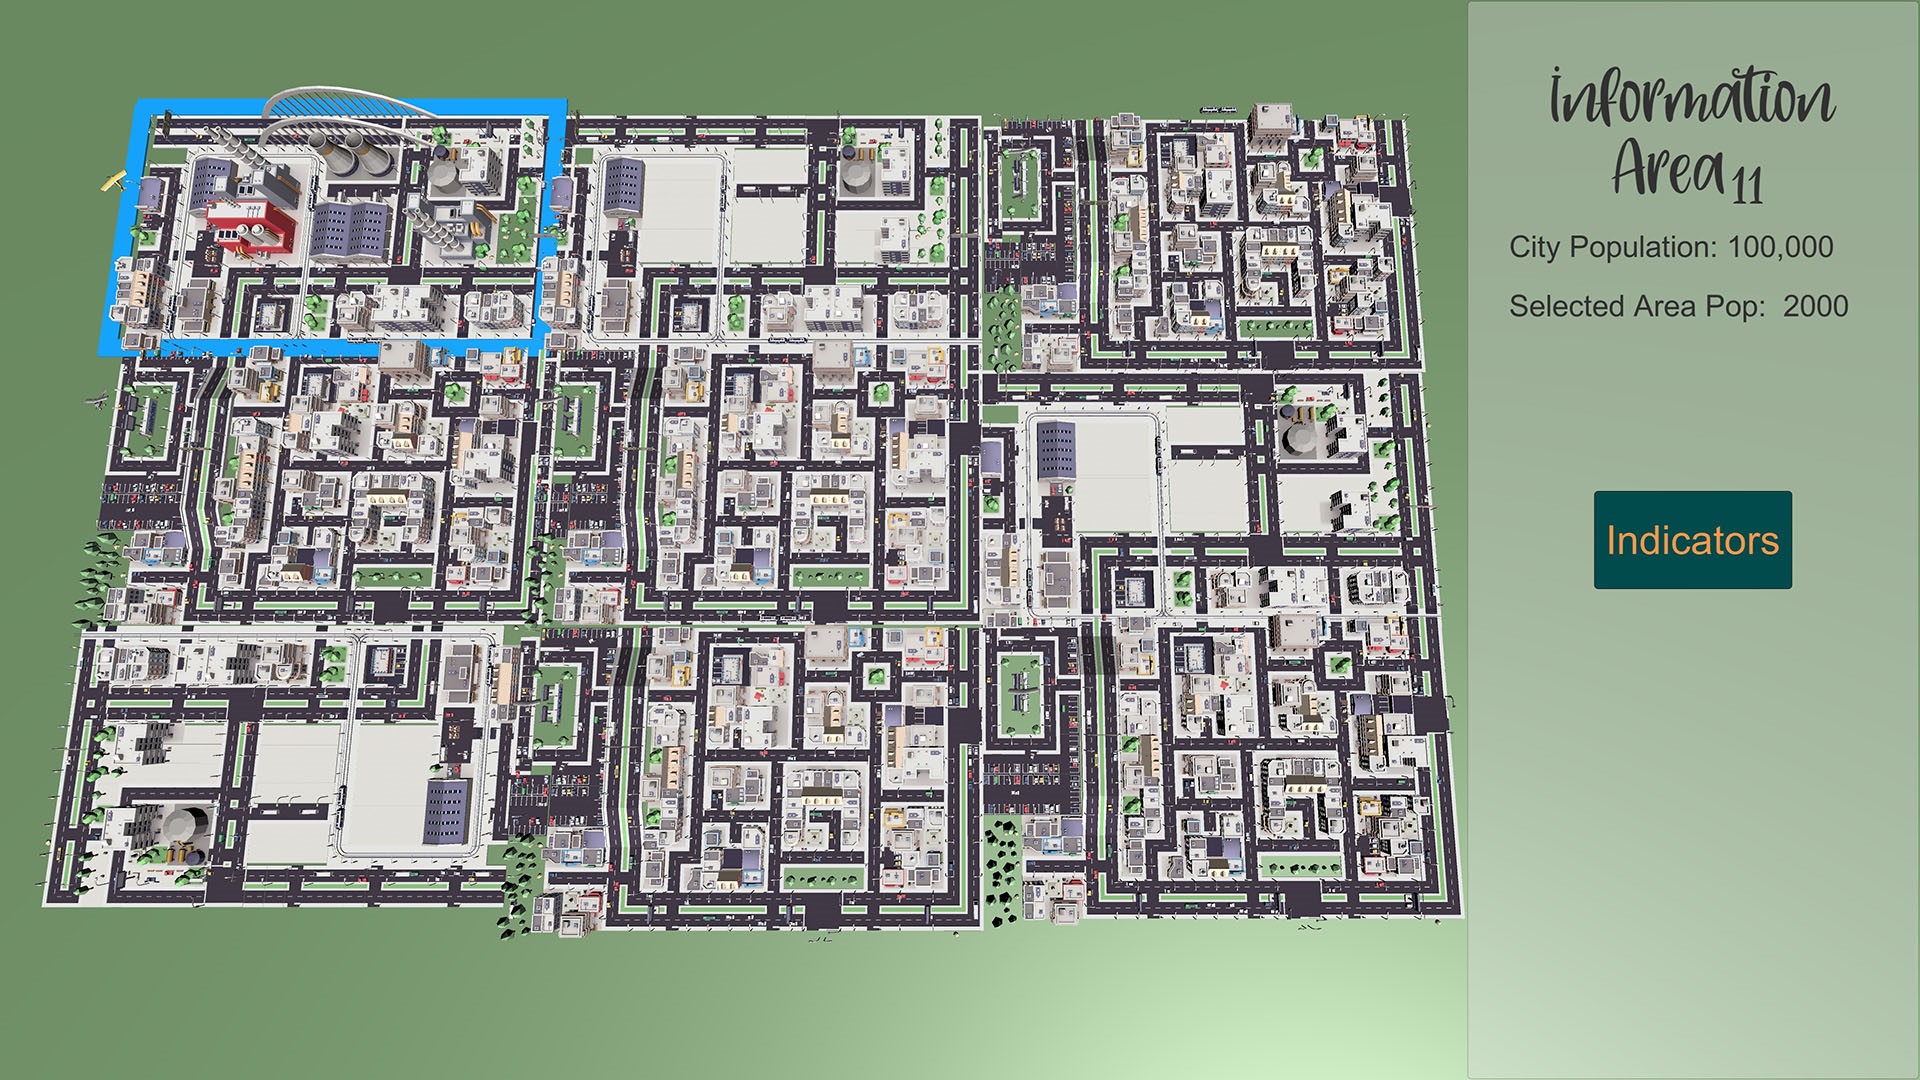
Figure 7. The Main Scene features a top-down view of the city, divided into nine parts. Each part can be highlighted, selected, and clicked to view information about waste management KPIs and policies in that region.
Having selected a specific area of the virtual city, the users may press the “Indicators” button on the right side of their screen. After doing so, a panel with the indicators (Figure 8) for the selected area appears. These indicators are the same KPIs that we have identified and presented in Section 3.
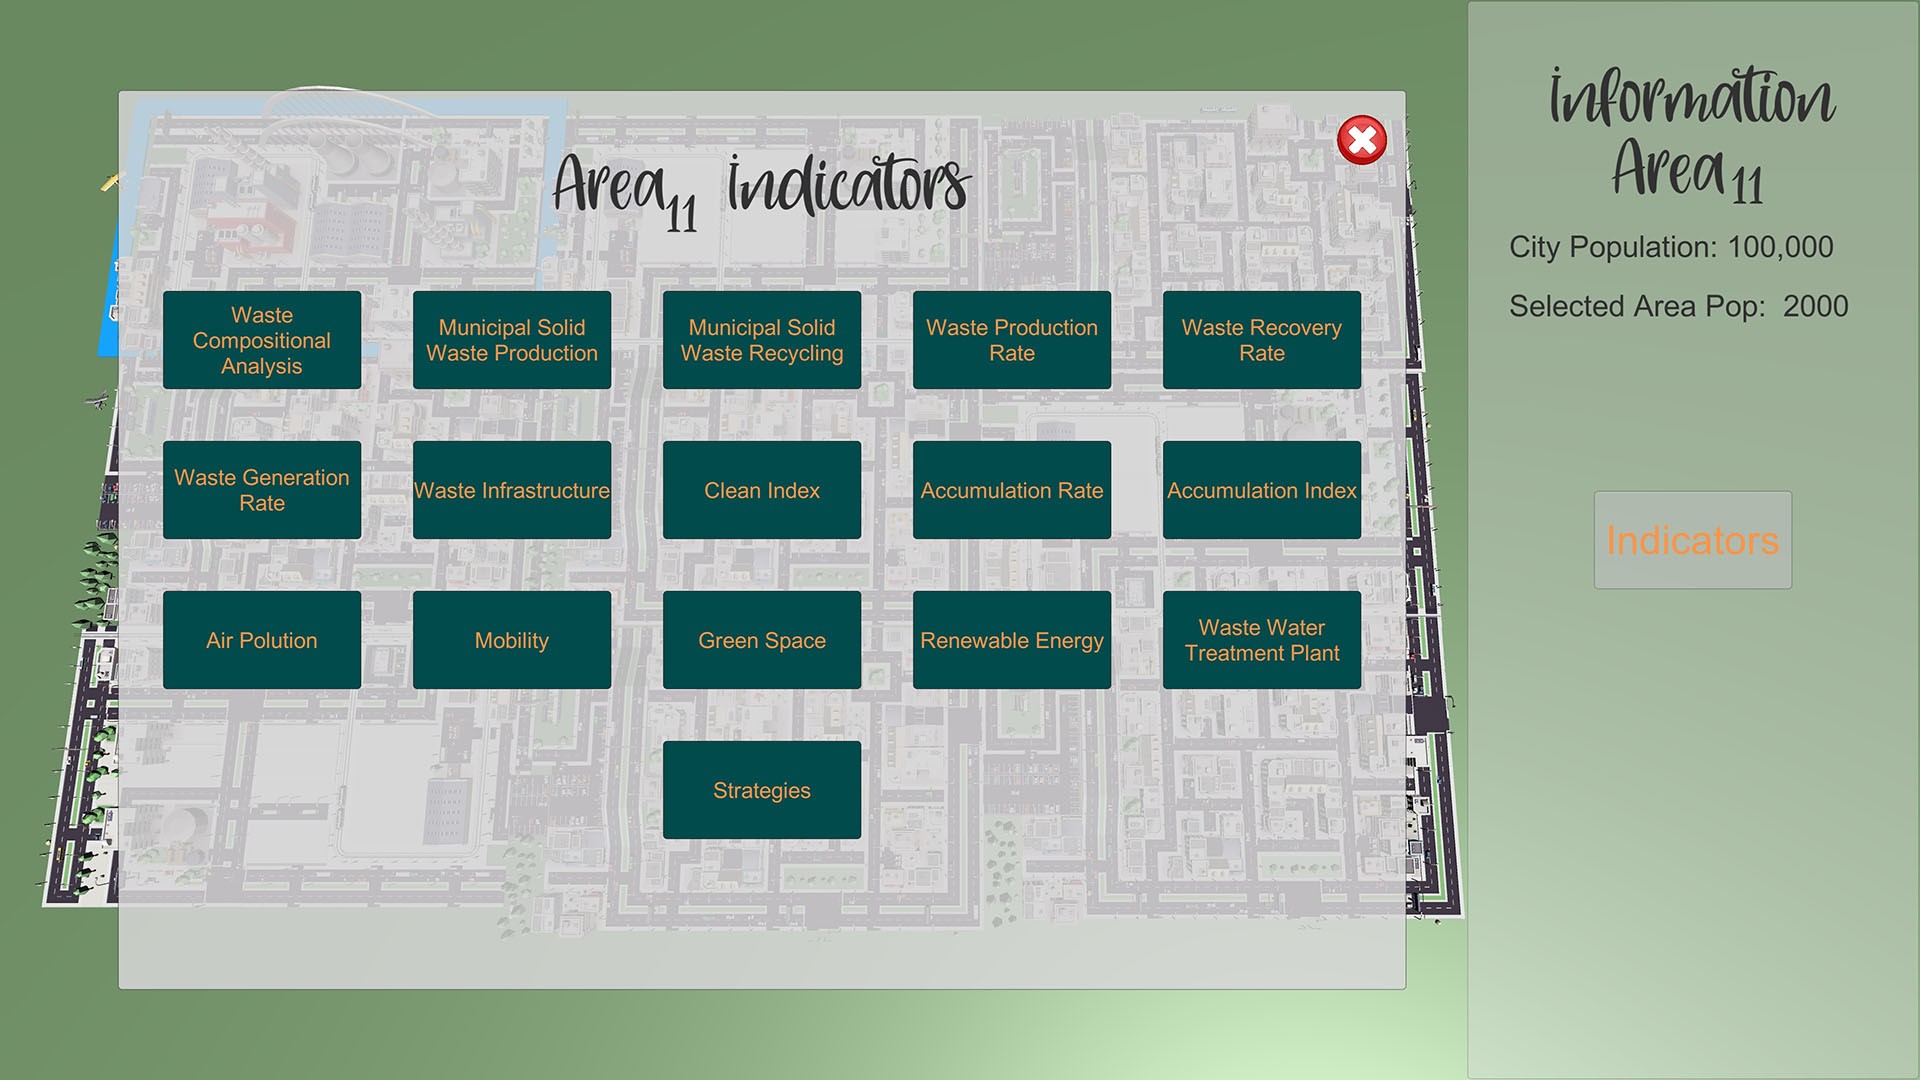
Figure 8. Key performance indicators for each region are shown on a dashboard to provide a high-level, easily interperable overview of waste management performance.
In this panel, the KPIs present new buttons that users can interact with. For illustrative purposes, we will explain how the first two indicators work. Starting with the Waste Compositional Analysis (MSW-C), this KPI is comprised of multiple configurable values each as described in Section 3.2.1. Using the amounts measured at Municipality of Paralimni and scaling up from 18,601 to 100,000 people for our simulator, we created Table 15 to display possible ranges in these categories for internal design purposes only. These amounts are scaled to fit each population option for all areas. The final bounds for each population option are presented in Table 16. These values are stored to an external and accessible file enabling easy customization in the case of new research developments necessitating specific game permutations.
Table 15. Waste Compositional Analysis categories for a population of 100,000 people and possible range in tn for each of the categories (figures per [13]). This table is used only for designing purposes and its amounts were later scaled to express the upper and lower bounds of each of the area population options.
|
Categories of Waste |
Scaled Est. Amount (tn) |
Range (tn) |
|
PMD |
7639 |
5000–10,000 |
|
Plastic Film |
3588 |
2000–5000 |
|
Plastics Non-Recyclable |
1835 |
1000–3000 |
|
Aluminium/Ferrous |
682 |
500–1000 |
|
Paper |
8572 |
6000–10,000 |
|
Glass |
4327 |
3000–5000 |
|
Toilet and Kitchen Paper |
9652 |
8000–11,000 |
|
Food Waste (edible) |
12,055 |
10,000–14,000 |
|
Food Waste (inedible) |
4091 |
3000–5000 |
|
Organic Waste (Green Waste, Yard Waste) |
22,243 |
20,000–25,000 |
|
Others |
6494 |
5000–7000 |
Table 16. The Lower and Upper Bounds for each of the categories for all population options. These values were scaled based on the range from Table 15.
|
Population: 1500 |
Population: 2000 |
Population: 5000 |
Population: 6500 |
Population: 7000 |
Population: 10,000 |
Population: 18,000 |
Population: 20,000 |
Population: 30,000 |
||||||||||
|
Lower Bound |
Upper Bound |
Lower Bound |
Upper Bound |
Lower Bound |
Upper Bound |
Lower Bound |
Upper Bound |
Lower Bound |
Upper Bound |
Lower Bound |
Upper Bound |
Lower Bound |
Upper Bound |
Lower Bound |
Upper Bound |
Lower Bound |
Upper Bound |
|
|
PMD |
750 |
1500 |
100 |
200 |
250 |
500 |
325 |
650 |
350 |
700 |
500 |
1000 |
900 |
1800 |
1000 |
2000 |
1500 |
3000 |
|
Plastic Film |
300 |
750 |
40 |
100 |
100 |
250 |
130 |
325 |
140 |
350 |
200 |
500 |
360 |
900 |
400 |
1000 |
600 |
1500 |
|
Plastic Non Recyclable |
150 |
450 |
20 |
60 |
50 |
150 |
65 |
195 |
70 |
210 |
100 |
300 |
180 |
540 |
200 |
600 |
300 |
900 |
|
Aluminun/ Ferrous |
75 |
150 |
10 |
20 |
25 |
50 |
32 |
65 |
35 |
70 |
50 |
100 |
90 |
180 |
100 |
200 |
150 |
300 |
|
Paper |
900 |
1500 |
120 |
200 |
300 |
500 |
390 |
650 |
420 |
700 |
600 |
1000 |
1080 |
1800 |
1200 |
2000 |
1800 |
3000 |
|
Glass |
450 |
750 |
60 |
100 |
150 |
250 |
195 |
325 |
210 |
350 |
300 |
500 |
540 |
900 |
600 |
1000 |
900 |
1500 |
|
Toilet and Kitchen paper |
1200 |
1650 |
160 |
220 |
400 |
550 |
520 |
715 |
560 |
770 |
800 |
1100 |
1440 |
1980 |
1600 |
2200 |
2400 |
3300 |
|
Food Waste Edible |
1500 |
2100 |
200 |
280 |
500 |
700 |
650 |
910 |
700 |
980 |
1000 |
1400 |
1800 |
2520 |
2000 |
2800 |
3000 |
4200 |
|
Food Waste Inedible |
450 |
750 |
60 |
100 |
150 |
250 |
195 |
325 |
210 |
350 |
300 |
500 |
540 |
900 |
600 |
1000 |
900 |
1500 |
|
Organic Waste |
3000 |
3750 |
400 |
500 |
1000 |
1250 |
1300 |
1625 |
1400 |
1750 |
2000 |
2500 |
3600 |
4500 |
4000 |
5000 |
6000 |
7500 |
|
Others |
750 |
1050 |
100 |
140 |
250 |
350 |
325 |
455 |
350 |
490 |
500 |
700 |
900 |
1260 |
1000 |
1400 |
1500 |
2100 |
Similar to the area populations, the tool automatically loads the lower and upper bounds for the relevant population number. At the same time, it randomly sets a new value in the respective sliders for each category, creating a unique but broadly-similar city waste footprint for each user. A representative example for Area11 is showcased in Figure 9. Users may then choose to change these values.
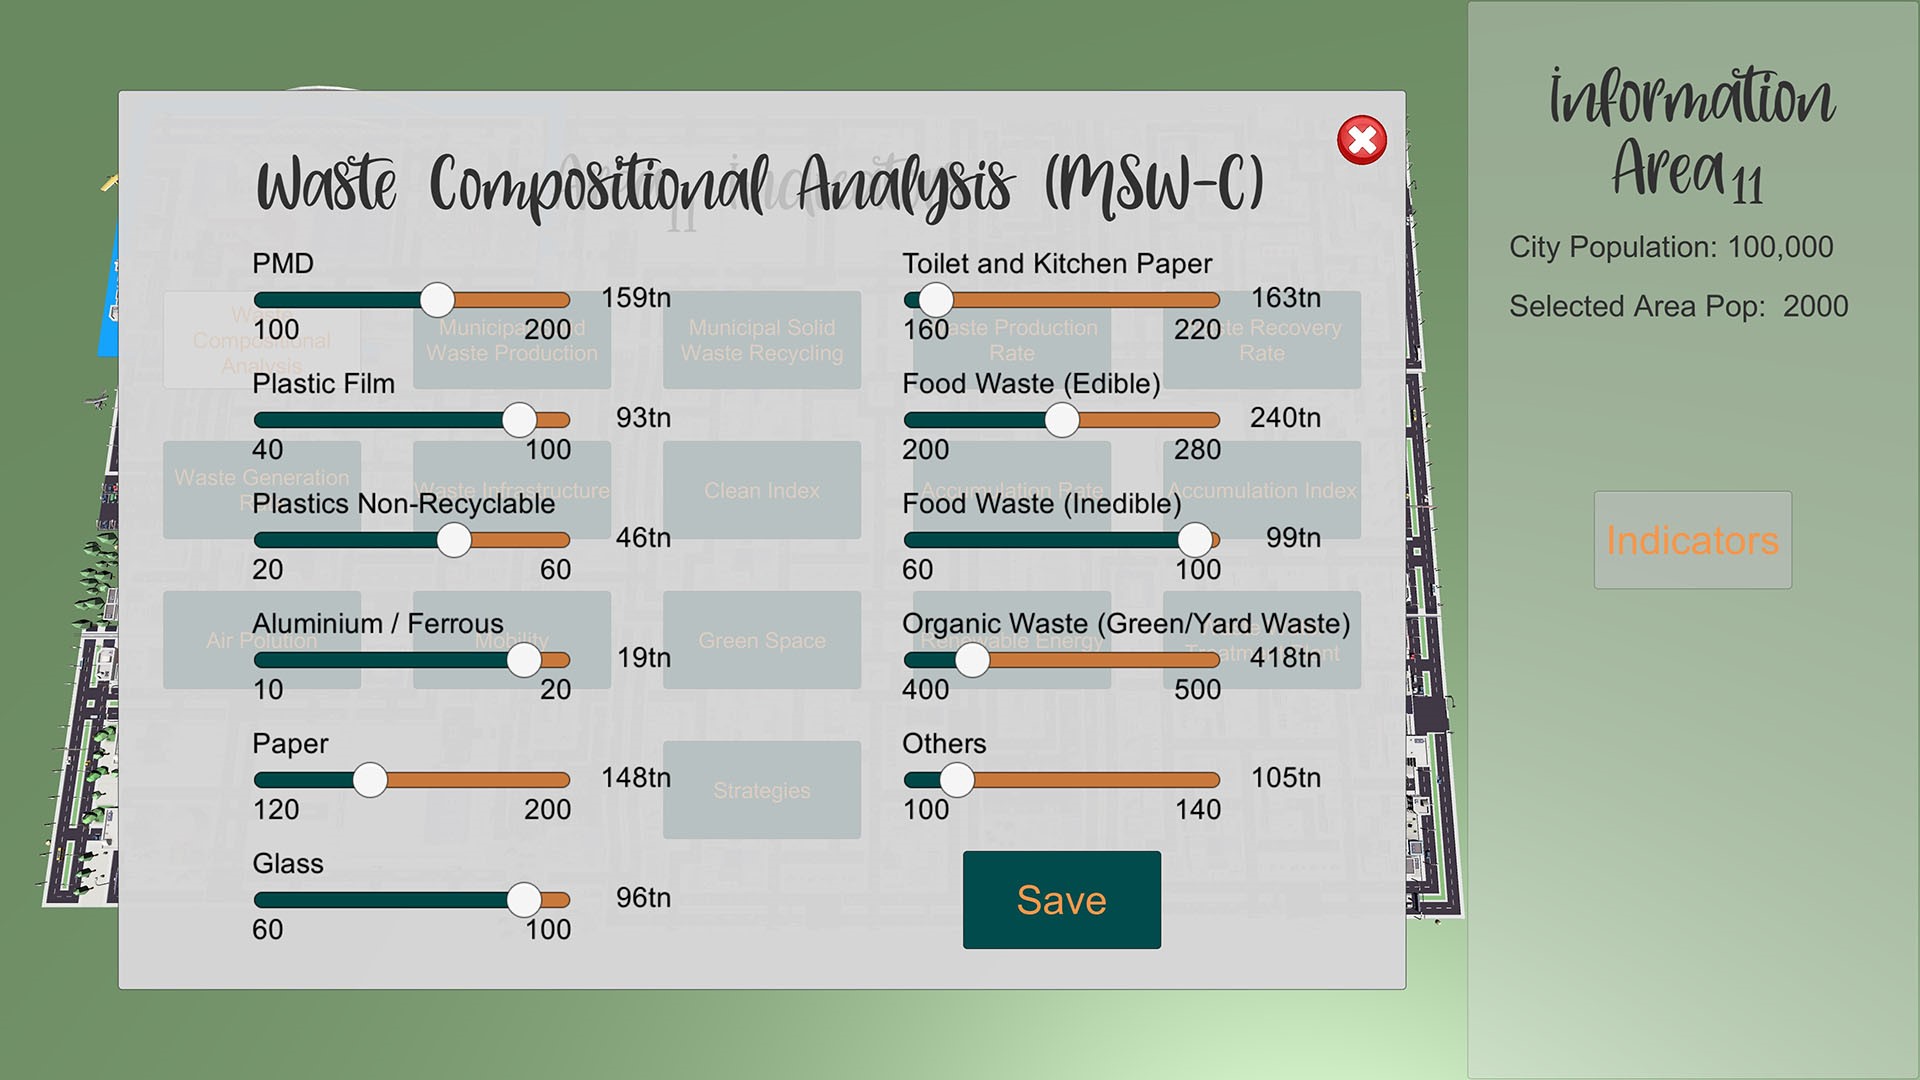
Figure 9. Each area’s waste generation and policy parameters can be altered independently.
Next, we have the Municipal Solid Waste Production KPI (MSW-P). This KPI does not have any user-configurable categories and is completely independent of MSW-C. This value comes from the division of the total amount of waste divided by the population of the area, as shown in Equation (4).
Based on the tool’s randomly-generated amounts (Figure 9) and the population of Area11, (2000), we have the following:

As we notice in Figure 10, the result is the same as the calculated one in Equation (15). This result can change in real time when a slider value from MSW-C panel is also changed.
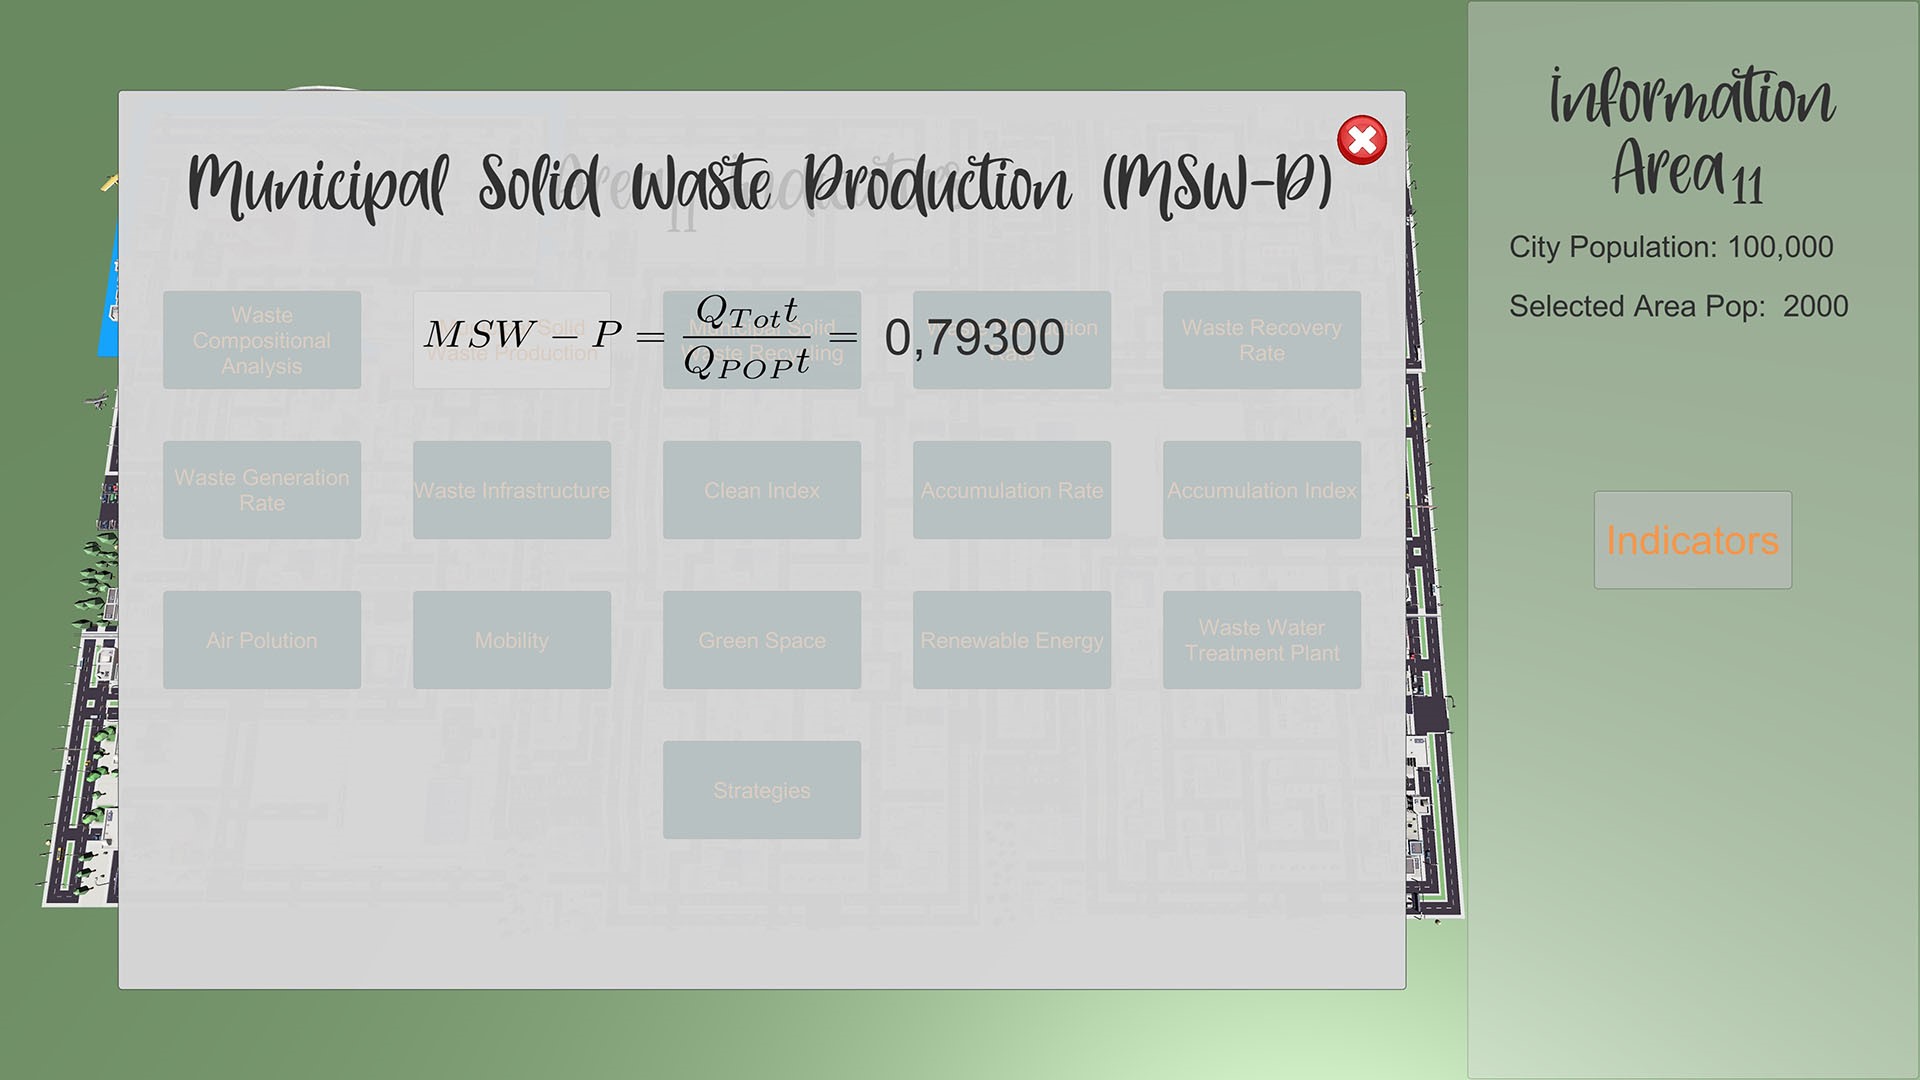
Figure 10. Clicking each metric provides information about how it is calculated, which helps students learn to create effective management policies. These indicators reflect the parameters as identified in Section 3 (note that due to regional differences, the figure shows a comma rather than a period in the numeric text).
These examples are representative of how all models involved in the computation of waste production and management are handled in the game design.
Using these indicators, along with configurable elements thereof, allows individuals to use the game as a means of modelling waste generation and management. Through study and play, users may learn those metrics most affecting waste production and mitigation in order to inform effective policies for diverse scenarios.
With the game created and reflecting the model developed in Section 3, this tool will be used to enable a range of academic studies that will be the subject of future work. Ongoing work will conduct playtesting with diverse constituents, the feedback from which will be fed into a version of the game to be made freely available to researchers (please contact the authors for additional information).
References
- Ackerman, F. Waste management and climate change. Local Environ. 2000, 5, 223–229.
- Seeberger, J.; Grandhi, R.; Kim, S.S.; Mase, W.A.; Reponen, T.; Ho, S.m.; Chen, A. Special report: E-waste management in the united states and public health implications. J. Environ. Health 2016, 79, 8–17.
- Haupt, T.; Arnold, U.; Bidlingmaier, W. Studien-und Hochschulübergreifender Einsatz Einer Engl.-spr. Multimedialen Urban Infrastructure Development Simulation in der Akademischen Ausund Weiterbildung-MUrIDS (Cross-Study and Cross-University Use of an English Multimedia Urban Infrastructure Deve. Workshop: Multimedia in Bildung und Wirtschaft–Einsatz und Nachhaltigkeit von eLearning, Volume 22, p. 5. Available online: https://his-he.de/fileadmin/user_upload/Publikationen/Projektberichte_alte_Website/Hochschulplanung/hp165.pdf (accessed on 24 October 2021).
- Arnold, U.; Söbke, H.; Reichelt, M. Simcity in infrastructure management education. Educ. Sci. 2019, 9, 209.
- Fernández, P.; Ceacero-Moreno, M. Urban sustainability and natural hazards management; designs using simulations. Sustainability 2021, 13, 649.
- Wu, K.C.; Huang, P.Y. Treatment of an Anonymous Recipient: Solid-Waste Management Simulation Game. J. Educ. Comput. Res. 2015, 52, 568–600.
- Lepe-Salazar, F.; Cortés-Álvarez, T.; Serratos-Chávez, E.; Jáuregui-Flores, L.; Juárez-Cervantes, E.; Valdovinos-López, R.; Rincón-Martínez, D.; la Madrid, R. A Game-Based Service to Mitigate the Risk of Inundations Caused by Solid Waste Accumulation. In Making Smart Cities More Playable: Exploring Playable Cities; Nijholt, A., Ed.; Springer: Singapore, 2020; pp. 279–299.
- Wilensky, U. NetLogo. 1999. Available online: http://ccl.northwestern.edu/netlogo/ (accessed on 24 October 2021).
- de Souza, V.M.; Bloemhof, J.; Borsato, M. Assessing the eco-effectiveness of a solid waste management plan using agent-based modelling. Waste Manag. 2021, 125, 235–248.
- Likotiko, E.; Nyambo, D.; Mwangoka, J. Multi-Agent Based IoT Smart Waste Monitoring and Collection Architecture. Int. J. Comput. Sci. Eng. Inf. Technol. 2017, 7, 1–14.
- European Commission. Green City Accord Target Areas. 2021. Available online: https://ec.europa.eu/environment/green-cityaccord/monitoring-framework_en (accessed on 24 October 2021)
- Loizia, P.; Voukkali, I.; Zorpas, A.A.; Navarro Pedreño, J.; Chatziparaskeva, G.; Inglezakis, V.J.; Vardopoulos, I.; Doula, M. Measuring the level of environmental performance in insular areas, through key performed indicators, in the framework of waste strategy development. Sci. Total Environ. 2021, 753, 141974.
- Zorpas, A.A.; Lasaridi, K.; Voukkali, I.; Loizia, P.; Chroni, C. Household waste compositional analysis variation from insular communities in the framework of waste prevention strategy plans. Waste Manag. 2015, 38, 3–11.
- Zorpas, A.A.; Lasaridi, K.; Voukkali, I.; Loizia, P.; Chroni, C. Promoting Sustainable Waste Prevention Strategy Activities and Planning in Relation to the Waste Framework Directive in Insular Communities. Environ. Process. 2015, 2, 159–173.
- Voukkali, I.; Loizia, P.; Navarro-Pedreño, J.; Zorpas, A.A. Urban strategies evaluation for waste management in coastal areas in the framework of area metabolism. Waste Manag. Res. J. Sustain. Circ. Econ. 2021, 39, 0734242X20972773.
- Zorpas, A.A. Strategy development in the framework of waste management. Sci. Total Environ. 2020, 716, 137088.
- Sharp, V.; Giorgi, S.; Wilson, D.C. Methods to monitor and evaluate household waste prevention. Waste Manag. Res. 2010, 28, 269–280.
- Vardopoulos, I.; Konstantopoulos, I.; Zorpas, A.A.; Limousy, L.; Bennici, S.; Inglezakis, V.J.; Voukkali, I. Sustainable metropolitan areas perspectives through assessment of the existing waste management strategies. Environ. Sci. Pollut. Res. 2021, 28, 24305–24320.
- Victor, P.A. Indicators of sustainable development: Some lessons from capital theory. Ecol. Econ. 1991, 4, 191–213. [CrossRef] 20. Green Dot Cyprus. Green National Household Results per Municipality per Year Cyprus. 2011. Available online: https: //greendot.com.cy/en/ (accessed on 24 October 2021).
- Green Dot Cyprus. Green National Household Results per Municipality per Year Cyprus. 2011. Available online: https: //greendot.com.cy/en/ (accessed on 24 October 2021
- The European Parliament and the Council of the European Union. Directive 2003/35/EC of the European Parliament and of the Council of 26 May 2003 providing for public participation in respect of the drawing up of certain plans and programmes relating to the environment and amending with regard to public participation. Off. J. Eur. Union 2003, 17–25.
- Printing Office of the Republic of Cyprus. Packaging and Waste Packaging (Amendment) Law; (Law No. 159(I)/2005); Printing Office of the Republic of Cyprus: Nicosia, Cyprus, 2005.
- Rhyner, C.; Schwartz, L.; Wenger, R.; Kohrell, M. Waste Management and Resource Recovery; CRC Press: Boca Raton, FL, USA, 2017; pp. 1–528.
- Luttenberger, L.R. Waste management challenges in transition to circular economy—Case of Croatia. J. Clean. Prod. 2020, 256, 120495. 2020.120495.
- Bhada-Tata, P.; Hoornweg, D. What a Waste?: A Global Review of Solid Waste Management. 2012. Available online: http: //hdl.handle.net/10986/17388 (accessed on 24 October 2021).
- Kaza, S.; Yao, L.; Bhada-Tata, P.; Van Woerden, F. What a Waste 2.0: A Global Snapshot of Solid Waste Management to 2050; The World Bank: Washington, DC, USA, 2018; p. 292.
- Alkalay, R.; Pasternak, G.; Zask, A. Clean-coast index—A new approach for beach cleanliness assessment. Ocean. Coast. Manag. 2007, 50, 352–362.
- Messineo, A.; Panno, D. Municipal waste management in Sicily: Practices and challenges. Waste Manag. 2008, 28, 1201–1208.
- Loizia, P.; Voukkali, I.; Chatziparaskeva, G.; Navarro-Pedreño, J.; Zorpas, A.A. Measuring the Level of Environmental Performance on Coastal Environment before and during the COVID-19 Pandemic: A Case Study from Cyprus. Sustainability 2021, 12, 2485.
- Ghorani azam, A.; Riahi-Zanjani, B.; Balali-Mood, M. Effects of air pollution on human health and practical measures for prevention in Iran. J. Res. Med. Sci. 2016, 21, 65.
- Zarate, E. Understanding the Origins and Fate of Air Pollution in Bogotá, Colombia. 2007. Available online: https://infoscience.epfl.ch/record/100037 (accessed on 24 October 2021
- Ho, B. Urban Air Pollution; IntechOpen: Rijeka, Croatia, 2012.
- Hogg, D.; Ballinger, A. The Potential Contribution of Waste Management to a Low Carbon Economy; Eunomia Research & Consulting Ltd.: Bristol, UK, 2015.
- Department of Labour Inspection (DLI) of the Ministry of Labour; Insurance, S. Air Quality in Cyprus. Available online: https://www.airquality.dli.mlsi.gov.cy/ (accessed on 24 October 2021).
- Pisoni, E.; Christidis, P.; Thunis, P.; Trombetti, M. Evaluating the impact of “Sustainable Urban Mobility Plans” on urban background air quality. J. Environ. Manag. 2019, 231, 249–255.
- Kasten, P.; Bracker, J.; Haller, M.; Purwanto, J. Assessing the Status of Electrification of the Road Transport Passenger Vehicles and Potential Future Implications for the Environment and European Energy System; Öko-Institut: Darmstadt, Germany, 2016.
- De la Barrera, F.; Reyes-Paecke, S.; Banzhaf, E. Indicators for green spaces in contrasting urban settings. Ecol. Indic. 2016, 62, 212–219.
- Gerstenberg, T.; Hofmann, M. Perception and preference of trees: A psychological contribution to tree species selection in urban areas. Urban For. Urban Green. 2015, 15, 103–111.
- European Commission. Building a Green Infrastructure for Europe; Publications Office of the European Union: Luxembourg; Brussels, Belgium, 2013; p. 22
- World Health Organisation(WHO). Health Indicators of Sustainable Cities in the Context of the Rio+20 UN Conference on Sustainable Development; WHO: Geneva, Switzerland, 2012.
- Russo, A.; Cirella, G. Modern Compact Cities: How Much Greenery Do We Need? Int. J. Environ. Res. Public Health 2018, 15, 2180.
- Delponte, I.; Schenone, C. RES Implementation in Urban Areas: An Updated Overview. Sustainability 2020, 12, 382.
- European Commission. Resolution of the European Committee of the Regions—The Green Deal in partnership with local and regional authorities. In Communication from the Commission to the European Parliament, The European Council, The Council, The European Economic and Social Committee and the Committee of the Regions the European Green Deal; Number COM(2019) 640 Final; European Commission: Brussels, Belgium; Luxembourg, 2019; p. 24.
- Zorpas, A.A.; Saranti, A. Multi-criteria analysis of sustainable environmental clean technologies for the treatment of winery’s wastewater. Int. J. Glob. Environ. Issues 2016, 15, 151–168.
- Cyprus, T.S.O. Transmission System Operator Cyprus. 2020. Available online: https://tsoc.org.cy/electrical-system/energy-gen eration-records/res-penetration/ (accessed on 24 October 2021).
- Regu, C.E. Cyprus Energy Regulatory Authority. 2021. Available online: https://www.cera.org.cy/en-gb/smv/sp-graph (accessed on 24 October 2021).
- Republic of Cyprus, Statistical Service, Ministry of Finance. Demographic Statistics 2019. 2019. Available online: https://www.mof.gov.cy/mof/cystat/statistics.nsf/populationcondition_21main_en/populationcondition_21main_en ?OpenForm&sub=1&sel=1 (accessed on 24 October 2021)
- European Commission. Directive (EU) 2018/2001 of the European Parliament and of the Council of 11 December 2018 on the Promotion of the Use of Energy from Renewable Sources (Recast) (Text with EEA Relevance)Text with EEA Relevance; Technical Report; European Commission: Brussels, Belgium; Luxembourg, 2018.
- Pesqueira, J.F.J.R.; Pereira, M.F.R.; Silva, A.M.T. Environmental impact assessment of advanced urban wastewater treatment technologies for the removal of priority substances and contaminants of emerging concern: A review. J. Clean. Prod. 2020, 261, 121078.
- European Commission. Communication from the Commission to the European Parliament, the Council, the European Economic and Social Committee and the Committee of the Regions A Policy Framework for Climate and Energy in the Period from 2020 to 2030; European Commission: Brussels, Belgium; Luxembourg, 2014.
- European Commission. Report from the Commission to the European Parliament, the Council, the European Economic and Social Committee and the Committee of the Regions- Tenth Report on the Implementation Status and Programmes for Implementation (as required by Article 17 of Coun; European Commission: Brussels, Belgium; Luxembourg, 2016.
- World Health Organisation (WHO). Population Connected to Wastewater Treatment Facilities. 2015. Available online: https: //gateway.euro.who.int/en/indicators/enhis_4-population-connected-to-wastewater-treatment-facilities/ (accessed on 24 October 2021).
- Eurostat. Population Connected to Wastewater Treatment Plants. 2018. Available online: http://appsso.eurostat.ec.europa.eu/n ui/show.do?dataset=env_ww_con&lang=en (accessed on 24 October 2021).
- Niccolucci, V.; Botto, S.; Rugani, B.; Nicolardi, V.; Bastianoni, S.; Gaggi, C. The real water consumption behind drinking water: The case of Italy. J. Environ. Manag. 2011, 92, 2611–2618.
- European Commission. Communication from the Commission to the European Parliament, the Council, the European Economic and Social Committee and the Committee of the Regions Closing the Loop—An EU Action Plan for the Circular Economy; Number COM(2015) 614 Final; European Commission: Brussels, Belgium; Luxembourg, 2015.
- Nations, U. Transforming Our World: The 2030 Agenda for Sustainable Development. 2015. Available online: https://sdgs.un.or g/2030agenda (accessed on 24 October 2021).
- Mohanty, S. Everything You Wanted to Know About Smart Cities. IEEE Consum. Electron. Mag. 2016, 5, 60–70.
- Stambouli, A.B.; Khiat, Z.; Flazi, S.; Kitamura, Y. A review on the renewable energy development in Algeria: Current perspective, energy scenario and sustainability issues. Renew. Sustain. Energy Rev. 2012, 16, 4445–4460.
- Petinrin, J.O.; Shaaban, M. Renewable energy for continuous energy sustainability in Malaysia. Renew. Sustain. Energy Rev. 2015, 50, 967–981.
- Calisto Friant, M.; Vermeulen, W.J.V.; Salomone, R. Analysing European Union circular economy policies: Words versus actions. Sustain. Prod. Consum. 2021, 27, 337–353.
- Wittmaier, M.; Langer, S.; Sawilla, B. Possibilities and limitations of life cycle assessment (LCA) in the development of waste utilization systems—Applied examples for a region in Northern Germany. Waste Manag. 2009, 29, 1732–1738.
- Brook Lyndhurst. WR1204 Household Waste Prevention Evidence Review: L1 m1—Executive Report, a Report for Defra’s Waste and Resources Evidence Programme; Technical Report; Brook Lyndhurst: London, UK, 2009.
- Shi, Y.; Ge, X.; Yuan, X.; Wang, Q.; Kellett, J.; Li, F.; Ba, K. An Integrated Indicator System and Evaluation Model for Regional Sustainable Development. Sustainability 2019, 11, 2183.
- Strzebkowski, R.; Gehrmann, T.; Siegel, J.E.; Politopoulos, K.; Christodoulides, C.; Pappas, G. AR/VR/Game-based Edutainment Applications and Real-Time Data Visualisation Technologies for Discovery Learning in the Industry and Distance Education; OEB: Berlin, Germany, 2018.
- Avraamidou, A.; Lambis, S.; Pappas, G.; Christodoulides, C. Enhancing Distance Education Students’ Learning Experience Through Emerging Technologies. In Proceedings of the INTED2019 Proceedings, Valencia, Spain, 11–13 March 2019; Volume 1, pp. 3022–3029.
- Pappas, G.; Peratikou, P.; Siegel, J.E.; Politopoulos, K.; Christodoulides, C.; Stavrou, S. Cyber Escape Room: An educational 3D escape room game within a cyber range training realm. In Proceedings of the INTED2020 Proceedings, 14th International Technology, Education and Development Conference, Valencia, Spain, 2–4 March 2020; pp. 2621–2627.
- Pappas, G.; Siegel, J.E.; Vogiatzakis, I.; Politopoulos, K. Gamification and the Internet of Things in Education. In Handbook of Intelligent Techniques in Educational Process; Springer: Berlin/Heidelberg, Germany, 2022.
- Pappas, G.; Siegel, J.E.; Politopoulos, K. VirtualCar: Virtual Mirroring of IoT-Enabled Avacars in AR, VR and Desktop Applications. 2018. Available online: https://diglib.eg.org/handle/10.2312/egve20181381 (accessed on 24 October 2021).
- Pappas, G.; Siegel, J.E.; Politopoulos, K.; Sun, Y. A Gamified Simulator and Physical Platform for Self-Driving Algorithm Training and Validation. Electronics 2021, 10, 1112.
- Siegel, J.E. Cloudthink and the Avacar: Embedded Design to Create Virtual Vehicles for Cloud-Based Informatics, Telematics, and Infotainment. S.M. Thesis, Massachusetts Institute of Technology, Cambridge, MA, USA, 2013.
- Wilhelm, E.; Siegel, J.E.; Mayer, S.; Sadamori, L.; Dsouza, S.; Chau, C.K.; Sarma, S.E. Cloudthink: A scalable secure platform for mirroring transportation systems in the cloud. Transport 2015, 30, 320–329.
- Siegel, J.E. Data Proxies, the Cognitive Layer, and Application Locality: Enablers of Cloud-Connected Vehicles and Next,Generation Internet of Things. Ph.D. Thesis, Massachusetts Institute of Technology, Cambridge, MA, USA, 2016.
- Siegel, J.E.; Bhattacharyya, R.; Deshpande, A.; Sarma, S.E. Vehicular engine oil service life characterization using on-board diagnostic (OBD) sensor data. In Proceedings of the IEEE Sensors 2014, Valencia, Spain, 2–5 November 2014; pp. 1722–1725.
- Siegel, J.E.; Bhattacharyya, R.; Deshpande, A.; Sarma, S.E. Smartphone-Based Wheel Imbalance Detection. In Proceedings of the Dynamic Systems and Control Conference, Columbus, OH, USA, 28–30 October 2015.
- Siegel, J.E.; Kumar, S.; Ehrenberg, I.; Sarma, S.E. Engine misfire detection with pervasive mobile audio. In Proceedings of the Joint European Conference on Machine Learning and Knowledge Discovery in Databases, Riva del Garda, Italy, 19–23 September 2016; Springer: Cham, Switzerland, 2016; pp. 226–241.
- Siegel, J.E.; Bhattacharyya, R.; Deshpande, A.; Sarma, S.E. Smartphone-Based Vehicular Tire Pressure and Condition Monitoring. In Proceedings of the SAI Intelligent Systems Conference, London, UK, 21–22 September 2016; pp. 446–455.
- Siegel, J.E.; Bhattacharyya, R.; Kumar, S.; Sarma, S.E. Air filter particulate loading detection using smartphone audio and optimized ensemble classification. Eng. Appl. Artif. Intell. 2017, 66, 104–112.
- Siegel, J.E.; Sun, Y.; Sarma, S.E. Automotive Diagnostics as a Service: An Artificially Intelligent Mobile Application for Tire Condition Assessment. In Proceedings of the International Conference on AI and Mobile Services, Seattle, WA, USA, 25– 30 June 2018.
- Siegel, J.E.; Coda, U.; Terwilliger, A. Surveying Off-Board and Extra-Vehicular Monitoring and Progress Towards Pervasive Diagnostics. arXiv 2021, arXiv:2007.03759.
- Pappas, G.; Siegel, J.E.; Rutkowski, J.; Schaaf, A. Game and Simulation Design for Studying Pedestrian-Automated Vehicle Interactions. arXiv 2021, arXiv:2109.15205.
- Siegel, J.E.; Kumar, S.; Sarma, S.E. The Future Internet of Things: Secure, Efficient, and Model-Based. IEEE Internet Things J. 2017, 5, 2386–2398.
- Kumaravel, B.T.; Bhattacharyya, R.; Siegel, J.E.; Sarma, S.E.; Arunachalam, N. Development of an Internet of Things enabled manufacturing system for tool wear characterization. In Proceedings of the 2017 IEEE 3rd International Symposium in Robotics and Manufacturing Automation (ROMA), Kuala Lumpur, Malaysia, 19–21 September 2017; pp. 1–6.
- Siegel, J.E.; Beemer, M.F.; Shepard, S.M. Automated non-destructive inspection of fused filament fabrication components using thermographic signal reconstruction. Addit. Manuf. 2020, 31, 100923.
- Sen, P.; Kantareddy, S.N.R.; Bhattacharyya, R.; Sarma, S.E.; Siegel, J.E. Low-cost diaper wetness detection using hydrogel-based RFID tags. IEEE Sens. J. 2020, 20, 3293–3302.