Submitted Successfully!
To reward your contribution, here is a gift for you: A free trial for our video production service.
Thank you for your contribution! You can also upload a video entry or images related to this topic.
Version Summary Created by Modification Content Size Created at Operation
1 + 2715 word(s) 2715 2021-08-18 12:39:14 |
2 format corrected. + 396 word(s) 3111 2021-08-27 11:35:25 |

Video Upload Options

Do you have a full video?

Confirm

Are you sure to Delete?
Cite
If you have any further questions, please contact Encyclopedia Editorial Office.
Abdulahi, E.W. Container Operational Risk management. Encyclopedia. Available online: https://encyclopedia.pub/entry/13631 (accessed on 17 April 2024).
Abdulahi EW. Container Operational Risk management. Encyclopedia. Available at: https://encyclopedia.pub/entry/13631. Accessed April 17, 2024.
Abdulahi, Efrah Wozir. "Container Operational Risk management" Encyclopedia, https://encyclopedia.pub/entry/13631 (accessed April 17, 2024).
Abdulahi, E.W. (2021, August 27). Container Operational Risk management. In Encyclopedia. https://encyclopedia.pub/entry/13631
Abdulahi, Efrah Wozir. "Container Operational Risk management." Encyclopedia. Web. 27 August, 2021.
Container Operational Risk management
Edit

The risk associated with container shipping has been a major concern in recent decades. This study presents three major risk frameworks to systematically and inclusively explore and validate container operational risk scales based on risk factors derived from the extant literature. The three risk frameworks identified are risks related to information flow, risks related to physical flow, and risks related to payment flow. Each risk factor is grouped into sub-factors (dimensions), three factors for information flow, two factors for physical flow, and two factors for payment flow. The study uses Ethiopia as a case study and employed both qualitative and quantitative research methods. An interview survey was conducted to explore additional risk factors and validate the identified risk factors in container shipping, and a questionnaire survey was then accompanied to collect the relevant data. A pairwise comparison chart (PCC) was employed to rank the risk dimensions. The results showed that the container operational risk model is satisfactory by employing exploratory and confirmatory factor analysis. Furthermore, the PCC result indicates that risk of loss or damage of goods/assets, payment delay, and decrease in or total loss of payment were ranked first, second, and third, respectively, and consequently the most significant dimensions of the risk factors. This study provides a reliable and valid scale for measuring container operational risk in container shipping companies. It also unlocks future works for using the identified risk factors as guidelines for researchers and experts to design and develop container operational risk dimensions. 

container operational risk information risk physical risk payment risk container shipping

1. Introduction

In the global economy, container shipping has become the foundation of maritime conveyance and logistics systems [1][2]. As they gain prominence in diverse areas, container shipping companies have to deal with uncertainties and interruptions. As recognized in the literature, “risk” has continuously been debated as a major impelling factor in maritime transportation [3][4]. Risks associated with shipment management are classified as one of the leading possible accident risks in container docks, as stated by some port safety authorities such as Health and Safety Executive UK [5] and Hong Kong Marine Department [6]. In the case of Ethiopia, the Ethiopian Shipping and Logistics Service Enterprise (ESLSE) is an international shipping industry known for its volatility and high risks associated with its container shipping system [7]. Many studies in risk management have gained attention in logistics risk in general and container operational risk in particular [8][9][10][11][12][13][14]. However, they have not come to a common consensus on container operational risk dimensions [11]. The extant literature shows that the lack of management commitment of the shipping company to container handling is a typical dimension for container operational risk [15][16][17]. Drewry [18] indicated that the risk factors related to container logistics operations dimensions could be categorized into seven themes: booking and invoicing errors, documentation, errors in customs regulatory compliance and security compliance, theft and cargo loss or damage, strikes and transport congestions, piracy, and terrorist attack. In their study, Fu et al. [19] found that piracy has been a significant threat to container liners. It was also found by [20][21] that the risk related to container operational risk such as ‘‘delay in information transmission by parties involved’’ and ‘‘delay in the processing of document by government authorities (e.g., customs)’’ had a significant adverse effect on Taiwan’s shipping industry. This present study concentrates on risks in container shipping operations but endeavors to contribute to the research in this field by exploring additional risk factors. To further enrich the contribution, the paper validates and ranks the dimensions of the identified risk factors that could serve as a platform for researchers interested in this field.
To successfully achieve container safety risk management, the shipping companies are responsible for understanding how to explore the container operational risk dimensions for risk management purposes and for knowing the dimensions of container operational risks for port operation. To better understand how best to explore the container operational risk dimensions for risk management, the first step is to understand the experts’ and port employees’ perspectives and perceptions of the container operational risk dimensions. Additionally, to help container shipping companies to differentiate among the risk factors, the risk factors will be ranked to reveal which risks factors would have a more serious impact than the others and which ones would be the most significant among all other risks factors. Experts’ and employees’ perspectives and perceptions of container operational risk factors could provide the information needed for container shipping companies and maritime managers to make better decisions regarding the risk factors for successful container operational risk management.

2. Data Analysis and Results

2.1. Interview Results

In the interview exercise, all the identified risk factors from the extant literature presented in the research framework were confirmed. Two new risk factors were recommended and added to the existing ones, which sum up 37 risk factors.
One suggested risk factor during the interviews is “Exchange rate fluctuation during payment process”. It was recommended as a risk factor as it results in an increase in cost, which has the tendency to delay the payment process. Similarly, “Unexpected rise in operational cost” was also recommended as a risk factor. Table A1 in the Appendix A summarizes all the risk factors identified in this research, two of which were identified through interviews (i.e., DPL1 and DLP3, highlighted in bold). The code of each item is listed in the second column in Table A1. The interviewees further confirmed the validity of the scale being identified.
Eighteen interviewees participated in the content and the face validity analyses of the container shipping scale. As shown in Table 1, the majority of the university faculty members (66.67%) and ESLSE experts (58.33%) were male. The age pattern revealed that most respondents of the two groups of the participants were aged 50–59 years. Most of the ESLSE experts had more than 20 years of working experience, and most of the university faculty members (50%) had more than 20 years of working experience. The majority (61.11%) of the interviewees who participated in the reliability analysis were male. Most of these interviewees were aged 50–59 years, and 44.44% of them had >20 years of working experience.
Table 1. Demographics of the interviewees in the content validity and the reliability analyses.
Variables   Validity Analysis  
  University Faculty Members
(n = 6)
ESLSE Experts
(n = 12)
Reliability Analysis
(n = 18)
Gender      
Male 4 (66.67) 7 (58.33) 11 (61.11)
Female 2 (33.33) 5 (41.67) 7 (38.89)
Age (y) 50.6 (8.3) * 50.7 (10.2) * 50.7 (9.3) *
<30 - - -
30–39 1 (16.67) 2 (16.67) 3 (16.67)
40–49 2 (33.33) 3 (25.00) 5 (27.78)
50–59 3 (50.00) 6 (50.00) 9 (50.00)
≥60 - 1 (8.33) 1 (5.56)
Working experience (y) 18.7 (9.4) * 19.3 (6.07) * 19.0 (7.52) *
<1 - - -
1–5 - - -
6–10 - 2 (16.67) 2 (11.11)
11–15 1 (16.67) 2 (16.67) 3 (16.67)
16–20 2 (33.33) 3 (25.00) 5 (27.78)
>20 3 (50.00) 5 (41.67) 8 (44.44)
* Mean and standard deviation in years provided for age and working experience of the participants.
The analysis of the content validity of the scales, which were rated by the university faculty members and ESLSE experts, showed that all the 37 items had an excellent content validity. The acceptable level of CVR for the 18 interviewees is >0.38 [22]. Consequently, the 37 items were retained.

2.2. Questionnaire Results

This paper conducted the questionnaire data analysis through descriptive analysis, reliability and validity analysis, and exploratory factor analysis (EFA) to explore and validate the risk factors based on experts’ and employees’ perceptions.
However, before the EFA, we established the demographic characteristics of the survey participants. As shown in Table 1, the largest category of the participants at ESLSE who participated in the questionnaire survey was those between 36 and 40 years of age (32.28%), followed by those in the 31 to 35 years of the age range (20.75%). There were only seven respondents who were 20 years or below in age. Regarding the genders of the participants, male participants were higher in frequency than female participants at percentages of 61.28 and 38.62, respectively. Most participants had 11–15 years of working experience (34.29%), followed by those with 6–10 years of working experience (32.85%). The demographic information of the survey respondents is summarized in Table 2.
Table 2. Demographic characteristics of the participant.
Items Options Frequency Percentage (%)
Employee at ESLSE Yes 347 100.00
No 0 0.00
Gender Male 213 61.38
Female 134 38.62
Age ≤20 7 2.02
21–25 38 10.95
26–30 67 19.31
31–35 72 20.75
36–40 112 32.28
>40 51 14.70
Education Bachelor 158 45.53
Masters 63 18.16
PhD 13 3.75
Others 113 32.56
Experience 1–5 73 21.04
6–10 114 32.85
11–15 119 34.29
>15 41 11.82

2.3. Descriptive Analysis

Descriptive statistics analysis was done for all items for their mean, standard deviation, skewness, and kurtosis to test the normality of the data. According to Hair et al. [23], normality refers to the “degree to which the distribution of the sample data corresponds to a normal distribution”. The data can be assessed for normality statistically by obtaining skewness and kurtosis. Skewness is the measure of the symmetry of the data distribution [24], while kurtosis measures the peak or flatness of the distribution [23]. The distribution is normal when the values of skewness and kurtosis range between −1 and +1 
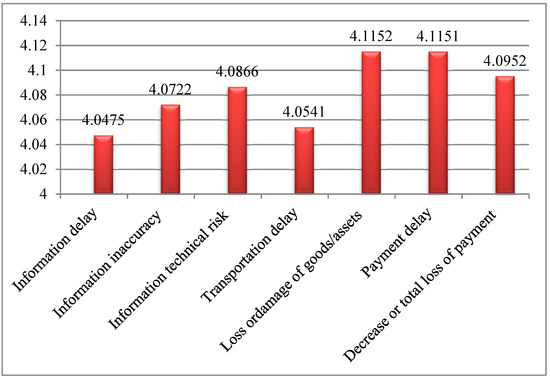
[25]. The results show that the values of mean ranged from 4.04 to 4.11 on a five-point scale, which indicates that most of the respondents had an agreement with the items of risk factors associated with container shipping, as displayed in Figure 1
Figure 1. Mean values of risk factors.
Furthermore, we presented the results of the descriptive statistics in Table 3 for each item. The results showed that the standard deviations range between 0.082 and 0.971, which implied that the values were acceptable. The normality distribution of the data was adequate because the values ranged between −1 and +1 according to the assumption of skewness and kurtosis.
Table 3. Descriptive Analysis.
Factors Items Mean Std. Skewness Kurtosis
Information delay (ID) ID1 4.11 0.898 −0.964 0.408
ID2 4.08 0.706 −0.791 0.070
ID3 3.93 0.536 −0.789 0.066
ID4 4.05 0.871 −0.795 0.104
Information inaccuracy (II) II1 3.97 0.868 −0.949 0.459
II2 3.99 0.786 −0.925 0.462
II3 4.07 0.849 −0.852 0.031
II4 4.12 0.852 −0.912 0.387
II5 4.20 0.815 −0.853 0.114
Information technical risk (ITR) ITR1 3.94 0.803 −0.850 0.124
ITR2 4.13 0.875 −0.853 0.125
ITR3 4.19 0.897 −0.851 0.254
Transportation delay(TD) TD1 3.90 0.786 −0.814 0.136
TD2 3.94 0.849 −0.963 0.516
TD3 4.15 0.773 −0.917 0.272
TD4 4.08 0.780 −0.912 0.287
TD5 4.25 0.693 −0.922 0.259
TD6 4.03 0.572 −0.958 0.525
TD7 4.18 0.705 −0.903 0.465
TD8 3.95 0.692 −0.862 0.540
TD9 4.01 0.669 −0.917 0.691
Loss ordamage of goods/assets (LDG) LDG1 3.93 0.735 −0.843 0.462
LDG2 3.97 0.199 −0.954 0.481
LDG3 4.17 0.082 −0.936 0.411
LDG4 3.87 0.168 −0.921 0.397
LDG5 4.41 0.694 −0.951 0.439
LDG6 4.34 0.548 −0.972 0.480
Payment delay (PD) PD1 4.14 0.920 −0.962 0.634
PD2 4.16 0.837 −0.989 0.674
PD3 4.09 0.749 −0.983 0.578
PD4 4.07 0.538 −0.921 0.401
Decrease or total loss of payment (DLP) DPL1 4.25 0.357 −0.993 0.600
DLP2 3.97 0.648 −0.795 0.104
DLP3 4.01 0.488 −0.798 0.114
DLP4 4.09 0.849 −0.912 0.287
DLP5 4.11 0.748 −0.983 0.578
DLP6 4.14 0.392 −0.843 0.462

2.4. Exploratory Factor Analysis

To evaluate the dimensions of the three models, an EFA was employed to ascertain an initial set of dimensions through varimax rotation. Seven dimensions were achieved, explaining 71.26% of the variance. The values of the Cronbach alpha for all dimensions were greater than 0.80, satisfying the threshold value of 0.70 recommended by [26], thus establishing internal consistency reliability of the scales. The computed Kaiser–Meyer–Olkin value of 0.937 established that the sample for the analysis was adequate. Moreover, Bartlett’s test for sphericity with a significance level (χ2 = 4157.178, p < 0.01) verified the homogeneity of the variances [23]. Table 4 provides the results of the rotated component matrix of the EFA for the seven dimensions of the container shipping risk factors, along with their corresponding coefficient alpha scores.
Table 4. Exploratory Factor Analysis Rotated Component Matrix.
Measurement Items Information Delay (α = 0.935) Information Inaccuracy (α = 0.921) Information Technical Risk (α = 0.910) Transportation Delay (α = 0.879) Loss or Damage of Goods/Assets (α = 0.854) Payment Delay (α = 0.916) Decrease or Total Loss of Payment (α = 0.930)
ID3 0.857            
ID1 0.849            
ID4 0.826            
ID2 0.803            
II2   0.831          
II1   0.821          
II4   0.818          
II3   0.809          
II5   0.794          
ITR3     0.854        
ITR1     0.847        
ITR2     0.839        
TD7       0.842      
TD3       0.835      
TD2       0.819      
TD9       0.724      
TD5       0.717      
TD6       0.701      
TD1       0.699      
TD8       0.696      
TD4       0.692      
LDG3         0.844    
LDG2         0.826    
LDG5         0.794    
LDG6         0.716    
LDG1         0.708    
LDG4         0.698    
PD3           0.796  
PD2           0.789  
PD3           0.766  
PD4           0.765  
DPL1             0.837
DLP2             0.826
DLP6             0.804
DLP4             0.781
DLP5             0.738
DLP3             0.667

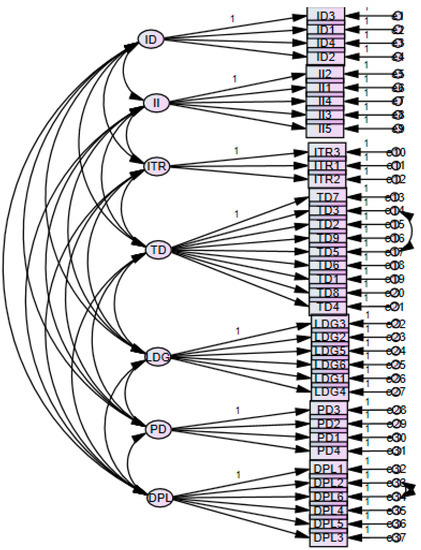
2.5. Measurement Model

As illustrated in Figure 2, the risk factor measurements were considered as latent constructs in confirmatory factor analysis (CFA). The result of CFA confirmed that the model that EFA initially established is acceptable. The chi-square minimum discrepancy (CMIN) divided by its degrees of freedom (df) or CMIN/df is less than the suggested 3.0 value, and the overall chi-square statistic for the measurement model was significant (χ2 = 315.070, df = 176, CMIN/df = 1.790, p < 0.001).
Figure 2. Confirmatory factor analysis of container shipping risk factor scale.
We followed the process outlined by [27] to complete the factor analysis, all individual items in each construct load at a statistically significant level (p < 0.001), with the standardized loadings for all items spanning from 0.794 to 0.923, as presented in Table 5. The standardized loadings met both the minimum (0.50) and preferred (0.70) guideline suggested by [28] for all 37 items. The AVE value was 0.745, and each construct’s AVE exceeded 0.703, reaching the benchmark of 0.50 for convergent validity recommended by [29].Table 5 shows the standardized factor loadings of the measurement model. Table 6 shows the results for discriminant validity, where construct values for MSV, ASV, and AVE were compared to confirm MSV < AVE and ASV < AVE for all constructs. The discriminant validity of the constructs was also established by comparing the square root of the AVE with their paired correlations as shown in the diagonal of the matrix in Table 7.
Table 5. Standardized Factor Loadings of Measurement Model.
Factors Items Standardized Loadings (>0.7) p-Value Items Removed
Information delay (ID) ID3 0.874 0.001 No item
ID1 0.855 0.001
ID4 0.865 0.001
ID2 0.872 0.001
Information inaccuracy (II) II2 0.879 0.001 No item
II1 0.841 0.001
II4 0.818 0.001
II3 0.859 0.001
II5 0.794 0.001
Information technical risk (ITR) ITR3 0.870 0.001 No item
ITR1 0.865 0.001
ITR2 0.862 0.001
Transportation delay (TD) TD7 0.884 0.001 No item
TD3 0.795 0.001
TD2 0.867 0.001
TD9 0.857 0.001
TD5 0.855 0.001
TD6 0.856 0.001
TD1 0.878 0.001
TD8 0.903 0.001
TD4 0.865 0.001
Loss or damage of goods/assets (LDG) LDG3 0.899 0.001 No item
LDG2 0.897 0.001
LDG5 0.879 0.001
LDG6 0.874 0.001
LDG1 0.871 0.001
LDG4 0.846 0.001
Payment delay (PD) PD3 0.861 0.001 No item
PD2 0.857 0.001
PD3 0.851 0.001
PD4 0.853 0.001
Decrease or total loss of payment (DLP) DPL1 0.920 0.001 No item
DLP2 0.799 0.001
DLP6 0.823 0.001
DLP4 0.922 0.001
DLP5 0.914 0.001
DLP3 0.851 0.001
Table 6. Scale Reliability and Validity Statistics for Measurement Model.
Construct α AVE MSV ASV
Information delay 0.935 0.751 0.454 0.279
Information inaccuracy 0.921 0.703 0.524 0.315
Information technical risk 0.910 0.749 0.351 0.208
Transportation delay 0.879 0.744 0.417 0.251
Loss or damage of goods/assets 0.854 0.771 0.531 0.382
Payment delay 0.916 0.732 0.419 0.266
Decrease or total loss of payment 0.930 0.762 0.282 0.249
Note. χ2 = 315.070; df = 176; GFI = 0.953; AGFI = 0.937; IFI = 0.951 CFI = 0.986; NFI = 0.968; RMSEA = 0.047. AVE = average variance extracted; MSV = maximum shared variance; ASV = average shared variance.
Table 7. Factor correlation matrix with square root of the AVE on the diagonal.
  ID II ITR TD LDG PD DLP
ID 0.867            
II 0.284 ** 0.839          
ITR 0.453 ** 0.503 ** 0.866        
TD 0.590 ** 0.563 ** 0.417 ** 0.863      
LDG 0.248 ** 0.194 * 0.299 ** 0.476 ** 0.878    
PD 0.378 ** 0.138 * 0.539 ** 0.526 ** 0.425 ** 0.856  
DLP 0.415 ** 0.189 * 0.485 ** 0.576 ** 0.521 ** 0.468 ** 0.873
Note. ** p < 0.01; * p < 0.05.
Moreover, other goodness of fit measures show that the model is satisfactory and hence acceptable. The GFI (0.953), AGFI (0.937), IFI (0.951), CFI (0.986), and NFI (0.968) were all greater than the 0.90 threshold value recommended by [30]. Furthermore, the RMSEA (0.047) computed value is far below the 0.08 threshold value recommended by [23]. Lastly, the calculated CFI value of 0.985 is above the recommended threshold value of 0.95 by [31]. (See bottom of Table 6.)
In order to rank the risks, pair-wise ranking was performed using the pairwise comparison chart (PCC) to help rank the risk dimensions as experienced by the experts based on their impact on container shipment (Table 8). In this way, the study also reveals which risks have a more serious impact than others and consequently which ones are the most significant among all other risks.
Table 8. Pairwise comparison chart (PCC).
  ID II ITR TD LDG PD DLP Score Rank
ID …. 7 5 10 4 7 6 39 7th
II 11 …. 8 11 5 5 7 47 5th
ITR 13 10 …. 7 6 6 7 49 4th
TD 8 7 11 …. 6 7 6 45 6th
LDG 14 13 12 12 …. 10 11 72 1st
PD 11 13 12 11 8 …. 9 64 2nd
DLP 12 11 11 12 7 9 …. 62 3rd
We rank the risk dimensions based on the perceptions and perspectives of the interviewees using the five-step procedure of the pairwise comparison chart (PCC) as follows: In the first step, we listed down the risk dimensions along the top row of the table and along the left hand side of the table. In the second step, we put dashes diagonally downwards in the chart. In the third step, we moved to the whole chart comparing two risk dimensions at a time to determine which one is more or less important based on the experts’ perspectives and perceptions. We recorded 1 in the row for the risk dimension that was more important and 0 in the row for the risk dimension that was less important. In the fourth step, we added across each row to determine the total. Finally, in the fifth step, we ranked the risk dimensions and reflect on the results.
From the results in Table 8, the ranking shows that risk of loss or damage of goods/assets ranks number one among the seven dimensions of the risk factors with a total score of 72. The second-ranked risk is the risk of payment delay with a score of 64 followed by a decrease in or total loss of payment with a score of 62 that ranks third. The fourth, fifth sixth, and seventh are information technical risk, information inaccuracy, transportation delay, and information delay with scores of 49, 47, 45, and 39 respectively.

3. Discussions and Conclusions

The main objectives of this study were the exploration, validation, and ranking of the container shipping risk factor scale. Inclusive literature was reviewed in identifying the risk factors, and an exploratory factor analysis was employed to validate the identified risk factors. After assembling all the container operational risk factor scales, a qualitative evaluation exercise was first done by a group of experts and university faculty members to evaluate the content validity of the scales as suggested by Seo et al. [32]. After that, we applied EFA and CFA to assess the construct validity of the scales. Moreover, the internal consistency reliability of the scales via the Cronbach alpha was also adequate as the results showed values above 0.80, meeting the threshold of 0.70 [26]. Hence, the scales were discovered to be a valid and reliable instrument to measure the container operational risk dimensions.
The EFA was done to explore the dimensions of the container operational risk factors in the three frameworks. The risk factor dimensions were categorized as information delay, information inaccuracy, information technical risk, transportation delay, loss or damage of goods/assets, payment delay, and decrease or total loss of payment. These results are consistent with the findings of the previous studies that stated the information delay, information inaccuracy, information technical risk [9][33][34], transportation delay, loss or damage of goods/assets [10][18][33][35], payment delay [13][33], and decrease or total loss of payment [13][33][35] as container operational risk dimensions. Furthermore, CFA’s findings support the application of the seven-dimension model of the three frameworks for measuring the container operational risk factors. The assessment of the major fit indices revealed that the dimensional structure of the container operational risk scale was satisfactory. The outcome of the Chi-square test for the examination of the CFA model showed a statistically significant result. The Chi-square test is one indicator of good model fit; however, it is more sensitive to minor misspecifications in the structure of the model [36]. Previous studies used other indices to verify the model fit when the Chi-square result was significant [36][37][38]. Tharaldsen et al. [39] also employed other fit indices, but they did not report the Chi-square result. We therefore used GFI, AGFI, CFI, NFI, goodness of fit, and RMSEA to evaluate the CFA model fit. Furthermore, the risk dimensions were also ranked via the PCC approach; the PCC result indicates that risk of loss or damage of goods/assets, payment delay, and decrease in or total loss of payment were ranked first, second, and third respectively, and consequently the most significant dimensions of the risk factors.
The qualitative evaluation of the container operational risk scales by a group of experts is a common approach to assess the content validity of the scales [32]. The application of a quantitative method for conducting such analysis facilitates the decision-making process regarding retention or rejection of the items of the scale. The authors employed experts and a Likert-type scale for rating the items (risk factors) in the validation process. These were conducted to consider the recommendations given by Wynd et al. [40] for overcoming the limitations of only relying on qualitative validation.
In summary, the results of this study showed that the validity and the reliability of the explored scale were satisfactory. The scale was developed in response to a need for a container operational risk dimension scale in the shipping industry in Ethiopia. It can be used to investigate the perception of experts and container shipping employees about risk factors associated with container shipping operations.

References

  1. Lam, J.S.L. Benefits and barriers of supply chain integration: Empirical analysis of liner shipping. Int. J. Shipp. Transp. Logist. 2013, 5, 13.
  2. Guerrero, D.; Rodrigue, J.-P. The waves of containerization: Shifts in global maritime transportation. J. Transp. Geogr. 2014, 34, 151–164.
  3. Karahalios, H.; Yang, Z.L.; Wang, J. A risk appraisal system regarding the implementation of maritime regulations by a ship operator. Marit. Policy Manag. 2015, 42, 389–413.
  4. Ozbas, B. Safety risk analysis of maritime transportation: Review of the literature. Transp. Rec. Res. J. Transp. Res. Board 2013, 2326, 32–38.
  5. UK. Health and Safety Executive, Health and Safety in Port and Docks. Available online: http://www.hse.gov.uk/ports (accessed on 26 July 2016).
  6. Hong Kong Marine Department. Marine Industrial Accident Statistics; Report of Marine Deprtment; Hong Kong Marine Department: Hong Kong, China, 2016.
  7. ESLSE. Enterprise Performance. Addis Ababa, Ethiopia. Available online: https://www.portstrategy.com/directory-entries/ethiopian-shipping-and-logistics-services-enterprise (accessed on 12 March 2021).
  8. Lee, H.L.; Padmanabhan, V.; Whang, S. Information distortion in a supply chain: The bullwhip effect. Manag. Sci. 1997, 43, 546–558.
  9. Angulo, A.; Nachtmann, H.; Waller, M.A. Supply chain information sharing in a vendor managed inventory partnership. J. Bus. Logist. 2004, 25, 101–120.
  10. Husdal, J.; Bråthen, S. Bad locations, bad logistics? How Norwegian freight carriers handle transportation disruptions. In Proceedings of the World Conference for Transportation Research, Lisbon, Portugal, 11–15 July 2020.
  11. Mitra, S.; Karathanasopoulos, A.; Sermpinis, G.; Dunis, C.; Hood, J. Operational risk: Emerging markets, sectors and measurement. Eur. J. Oper. Res. 2015, 241, 122–132.
  12. Goerlandt, F.; Montewka, J. Maritime transportation risk analysis: Review and analysis in light of some foundational issues. Reliab. Eng. Syst. Saf. 2015, 138, 115–134.
  13. Chang, C.-H.; Xu, J.; Song, D.-P. Risk analysis for container shipping: From a logistics perspective. Int. J. Logist. Manag. 2015, 26, 147–171.
  14. Chang, C.-H.; Xu, J.; Song, D.-P. Impact of different factors on the risk perceptions of employees in container shipping companies: A case study of Taiwan. Int. J. Shipp. Transp. Logist. 2016, 8, 361.
  15. Bearzotti, L.; Gonzalez, R.; Miranda, P. The Event Management Problem in a Container Terminal. J. Appl. Res. Technol. 2013, 11, 95–102.
  16. Pallis, P.L. Port Risk Management in Container Terminals. Transp. Res. Procedia 2017, 25, 4411–4421.
  17. Nguyen, S.; Wang, H.Y. Prioritizing operational risks in container shipping systems by using cognitive assessment technique. Marit. Bus. Rev. 2018, 3, 185–206.
  18. Drewry. Risk Management in International Transport and Logistics; Drewry Shipping Consultants Ltd.: London, UK, 2009.
  19. Fu, X.; Ng, A.K.Y.; Lau, Y.Y. The impacts of maritime piracy on global economic development: The case of Somalia. Marit. Policy Manag. 2010, 37, 677–697.
  20. Yang, Y.C. Impact of the container security initiative on Taiwan’s shipping industry. Marit. Policy Manag. 2010, 37, 699–722.
  21. Yang, Y.C. Risk management of Taiwan’s maritime supply chain security. Saf. Sci. 2011, 49, 382–393.
  22. Lawshe, C.H. A quantitative approach to content validity. Pers. Psychol. 1975, 28, 563–575.
  23. Hair, J.F.; Black, W.C.; Babin, B.J.; Anderson, R.E. Multivariate Data Analysis, 7th ed.; Prentice Hall: Upper Saddle River, NJ, USA, 2010.
  24. Tabachnick, B.G.; Fidell, L.S. Using Multivariate Statistics; Pearson Education, Inc.: Boston, MA, USA, 2007.
  25. Curran, J.M.; Lennon, R. Participating in the conversation: Exploring usage of social media networking sites. Acad. Mark. Stud. J. 2011, 15, 21–38.
  26. Nunnally, J.C. Psychometric Theory, 2nd ed.; McGraw-Hill: New York, NY, USA, 1978.
  27. Mathwick, C.; Rigdon, E. Play, flow, and the online search experience. J. Consum. Res. 2004, 31, 324–332.
  28. Cortina, J.M. What is coefficient alpha? An examination of theory and applications. J. Appl. Psychol. 1993, 78, 98–104.
  29. Fornell, C.; Larcker, D.F. Structural equation models with unobservable variables and measurement error: Algebra and statistics. J. Mark. Res. 1981, 18, 39–50.
  30. Bentler, P.M.; Bonett, D.G. Significance tests and goodness of fit in the analysis of covariance structures. Psychol. Bull. 1980, 88, 588–606.
  31. Hu, L.; Bentler, P. Cutoff criteria for fit indexes in covariance structure analysis: Conventional criteria versus new alternatives. Struct. Equ. Modeling 2009, 6, 1–55.
  32. Seo, D.C.; Torabi, M.R.; Blair, E.H.; Ellis, N.T. A cross-validation of safety climate scale using confirmatory factor analytic approach. J. Saf. Res. 2004, 35, 427e45.
  33. Tummala, R.; Xie, C.; Schoenherr, T. Assessing and managing risks using the supply chain risk management process (SCRMP). Supply Chain Manag. 2011, 16, 474–483.
  34. Qi, Y.; Zhang, Q. Research on Information Sharing Risk in Supply Chain Management. In Proceedings of the 2008 4th International Conference on Wireless Communications, Networking and Mobile Computing, Dalian, China, 12–14 October 2008; pp. 1–6.
  35. Notteboom, T.E. The time factor in liner shipping services. Marit. Econ. Logist. 2006, 8, 19–39.
  36. Sexton, J.; Helmreich, R.; Neilands, T.; Rowan, K.; Vella, K.; Boyden, J.; Roberts, P.R.; Thomas, E. The Safety Attitudes Questionnaire: Psychometric properties, benchmarking data, and emerging research. BMC Health Serv. Res. 2006, 6, 44.
  37. Fernández-Muñiz, B.; Montes-Peón, J.M.; Vázquez-Ordás, C.J. Safety climate in OHSAS 18001-certified organisations: Antecedents and consequences of safety behaviour. Accid. Anal. Prev. 2012, 45, 745–758.
  38. Leach, C.W.; van Zomeren, M.; Zebel, S.; Vliek, M.L.; Pennekamp, S.F.; Doosje, B.; Ouwerkerk, J.W.; Spears, R. Group-level self-definition and self-investment: A hierarchical (multicomponent) model of in-group identification. J. Pers. Soc. Psychol. 2008, 95, 144–165.
  39. Tharaldsen, J.; Olsen, E.; Rundmo, T. A longitudinal study of safety climate on the Norwegian continental shelf. Saf. Sci. 2008, 46, 427–439.
  40. Wynd, C.A.; Schmidt, B.; Schaefer, M.A. Two quantitative approaches for estimating content validity. West. J. Nurs. Res. 2003, 25, 508–518.
More
Information
Subjects: Management
Contributor MDPI registered users' name will be linked to their SciProfiles pages. To register with us, please refer to https://encyclopedia.pub/register :
View Times: 660
Revisions: 2 times (View History)
Update Date: 27 Aug 2021
1000/1000