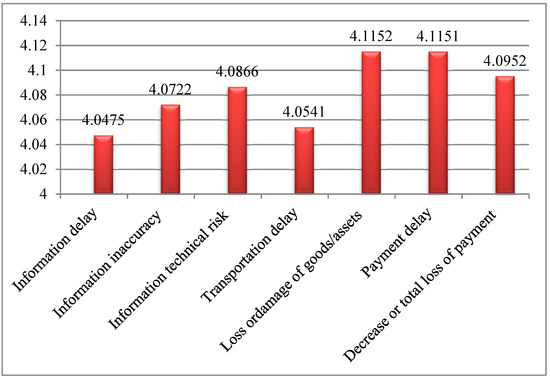
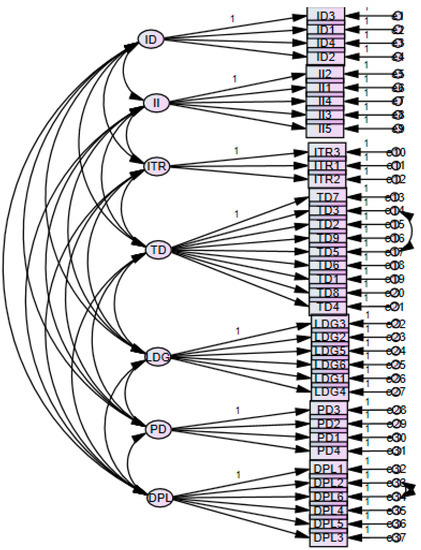
The risk associated with container shipping has been a major concern in recent decades. This study presents three major risk frameworks to systematically and inclusively explore and validate container operational risk scales based on risk factors derived from the extant literature. The three risk frameworks identified are risks related to information flow, risks related to physical flow, and risks related to payment flow. Each risk factor is grouped into sub-factors (dimensions), three factors for information flow, two factors for physical flow, and two factors for payment flow. The study uses Ethiopia as a case study and employed both qualitative and quantitative research methods. An interview survey was conducted to explore additional risk factors and validate the identified risk factors in container shipping, and a questionnaire survey was then accompanied to collect the relevant data. A pairwise comparison chart (PCC) was employed to rank the risk dimensions. The results showed that the container operational risk model is satisfactory by employing exploratory and confirmatory factor analysis. Furthermore, the PCC result indicates that risk of loss or damage of goods/assets, payment delay, and decrease in or total loss of payment were ranked first, second, and third, respectively, and consequently the most significant dimensions of the risk factors. This study provides a reliable and valid scale for measuring container operational risk in container shipping companies. It also unlocks future works for using the identified risk factors as guidelines for researchers and experts to design and develop container operational risk dimensions.
Variables | Validity Analysis |
---|
Construct | α | AVE | MSV | ASV |
---|---|---|---|---|
University Faculty Members (n = 6) |
ESLSE Experts (n = 12) |
|||
ID2 | ||||
0.762 | ||||
0.282 | ||||
0.249 | ||||
ID | II | ITR | TD | LDG | PD | DLP | ||||
---|---|---|---|---|---|---|---|---|---|---|
Reliability Analysis | ||||||||||
Information delay | (n = 18) | |||||||||
0.935 | Gender | |||||||||
0.751 | 0.454 | 0.279 | ||||||||
ID | …. | 7 | 5 | 10 | 4 | 7 | 6 | 39 | 7th | |
II | 11 | …. | 8 | 11 | 5 | 5 | Male | 4 (66.67) | 7 (58.33) | 11 (61.11) |
Female | 2 (33.33) | 5 (41.67) | 7 (38.89) | |||||||
0.872 | 0.001 | Age (y) | 50.6 (8.3) * | 50.7 (10.2) * | 50.7 (9.3) * | |||||
Information inaccuracy (II) | II2 | 0.879 | 0.001 | No item | <30 | |||||
II1- | ||||||||||
2 (33.33) | ||||||||||
3 (25.00) | 5 (27.78) | |||||||||
>20 | 3 (50.00) | 5 (41.67) | 8 (44.44) |
Items | Options | Frequency | Percentage (%) | ||||||||||
---|---|---|---|---|---|---|---|---|---|---|---|---|---|
Employee at ESLSE | Yes | 347 | 100.00 | ||||||||||
No | 0 | 0.00 | |||||||||||
7 | 47 | 5th | Gender | Male | 213 | 61.38 | |||||||
ITR | 13 | 10 | …. | 7 | 6 | 6 | 7 | 49 | 4th | Female | 134 | 38.62 | |
Age | |||||||||||||
TD | 8 | 7 | 11 | …. | 6 | 7 | 6 | 45 | 6th | ≤20 | |||
LDG | 7 | 2.02 | 14 | 13 | 12 | 12 | …. | 10 | 11 | 72 | 1st | - | - |
21–25 | 38 | 10.95 | 0.841 | 0.001 | 30–39 | 1 (16.67) | 2 (16.67) | 3 (16.67) | |||||
26–30 | 67 | 19.31 | |||||||||||
II4 | 0.818 | 0.001 | 40–49 | 2 (33.33) | |||||||||
31–353 (25.00) | 5 (27.78) | ||||||||||||
72 | 20.75 | 50–59 | 3 (50.00) | 6 (50.00) | 9 (50.00) | ||||||||
II5 | 0.794 | ||||||||||||
II3 | 0.859 | 0.001 | 36–40 | 112 | 32.28 | ≥60 | - | 1 (8.33) | 1 (5.56) | ||||
>40 | 51 | 14.70 | Working experience (y) | 18.7 (9.4) * | 19.3 (6.07) * | ||||||||
ITR3 | |||||||||||||
II5 | 0.794 | 0.001 | |||||||||||
Information technical risk (ITR) | ITR3 | 0.8700.854 | |||||||||||
0.001 | No item | 19.0 (7.52) * | |||||||||||
ITR1 | 0.847 | <1 | - | - | - | ||||||||
1–5 | - | ||||||||||||
Education | Bachelor | 158 | 45.53 | ||||||||||
ITR1 | Masters | - | - | ||||||||||
63 | 18.16 | ||||||||||||
PhD | 13 | 3.75 | 6–10 | - | |||||||||
Others | 2 (16.67) | 2 (11.11) | |||||||||||
113 | 32.56 | 11–15 | 1 (16.67) | 2 (16.67) | 3 (16.67) | ||||||||
Experience | 1–5 | 73 | 21.04 | 16–20 | |||||||||
6–10 | 114 | 32.85 | |||||||||||
11–15 | 119 | 34.29 | |||||||||||
>15 | 41 | 11.82 |
Factors | Items | Mean | Std. | Skewness | Kurtosis | ||||||||
---|---|---|---|---|---|---|---|---|---|---|---|---|---|
Information delay (ID) | ID1 | 4.11 | 0.898 | −0.964 | 0.408 | ||||||||
ID2 | 4.08 | 0.706 | −0.791 | 0.070 | |||||||||
ID3 | 3.93 | 0.536 | −0.789 | 0.066 | |||||||||
ID4 | 4.05 | 0.871 | −0.795 | 0.104 | |||||||||
Information inaccuracy (II) | II1 | 3.97 | 0.868 | −0.949 | 0.459 | ||||||||
II2 | 3.99 | 0.786 | −0.925 | 0.462 | |||||||||
PD | 11 | 13 | 12 | 11 | 8 | …. | 9 | 64 | 2nd | ||||
DLP | 12 | 11 | 11 | 12 | 7 | 9 | …. | 62 | 3rd | 0.865 | |||
0.001 | ITR2 | ||||||||||||
ITR2 | 0.839 | 0.862 | 0.001 | ||||||||||
0.920 | |||||||||||||
−0.962 | |||||||||||||
0.634 | |||||||||||||
TD7 | PD2 | 4.16 | 0.837 | −0.989 | 0.674 | ||||||||
PD3 | 4.09 | 0.749 | −0.983 | 0.578 | |||||||||
PD4 | 4.07 | 0.538 | −0.921 | 0.401 | |||||||||
Decrease or total loss of payment (DLP) | DPL1 | 4.25 | 0.357 | −0.993 | 0.600 | ||||||||
DLP2 | 3.97 | 0.648 | −0.795 | 0.104 | |||||||||
DLP3 | 4.01 | 0.488 | −0.798 | 0.114 | |||||||||
DLP4 | 4.09 | 0.849 | −0.912 | 0.287 | |||||||||
DLP5 | 4.11 | 0.748 | −0.983 | 0.578 | |||||||||
DLP6 | 4.14 | 0.392 | −0.843 | 0.462 |
Measurement Items | Information Delay (α = 0.935) | Information Inaccuracy (α = 0.921) | Information Technical Risk (α = 0.910) | Transportation Delay (α = 0.879) | Loss or Damage of Goods/Assets (α = 0.854) | Payment Delay (α = 0.916) | Decrease or Total Loss of Payment (α = 0.930) | |||||
---|---|---|---|---|---|---|---|---|---|---|---|---|
ID3 | 0.857 | |||||||||||
ID1 | 0.849 | |||||||||||
ID4 | 0.826 | |||||||||||
ID2 | 0.803 | |||||||||||
II2 | 0.831 | |||||||||||
II1 | 0.821 | II3 | 4.07 | 0.849 | −0.852 | 0.031 | ||||||
II4 | 0.818 | II4 | 4.12 | 0.852 | −0.912 | 0.387 | ||||||
II3 | 0.809 | II5 | ||||||||||
Transportation delay (TD) | TD7 | |||||||||||
Information inaccuracy | 4.20 | 0.815 | −0.853 | 0.114 | ||||||||
Information technical risk (ITR) | ITR1 | 3.94 | 0.803 | −0.850 | 0.124 | |||||||
ITR2 | 4.13 | 0.875 | −0.853 | 0.125 | ||||||||
ITR3 | 4.19 | 0.897 | −0.851 | 0.254 | ||||||||
Transportation delay(TD) | TD1 | 3.90 | 0.786 | −0.814 | 0.136 | |||||||
0.842 | ||||||||||||
0.884 | 0.001 | TD3 | 0.835 | |||||||||
TD2 | ||||||||||||
ID | ||||||||||||
0.819 | ||||||||||||
0.867 | TD9 | 0.724 | ||||||||||
TD5 | 0.717 | |||||||||||
TD6 | 0.701 | |||||||||||
TD1 | 0.699 | |||||||||||
TD8 | 0.696 | |||||||||||
TD4 | ||||||||||||
LDG4 | 0.698 |
Factors | Items | Standardized Loadings (>0.7) | p-Value | Items Removed | ||||||||||
---|---|---|---|---|---|---|---|---|---|---|---|---|---|---|
Information delay (ID) | ID3 | 0.874 | 0.001 | No item | ||||||||||
ID1 | 0.855 | 0.001 | ||||||||||||
ID4 | 0.865 | 0.001 | ||||||||||||
No item | ||||||||||||||
TD2 | ||||||||||||||
3.94 | ||||||||||||||
0.849 | −0.963 | 0.516 | ||||||||||||
TD3 | 4.15 | 0.773 | −0.917 | 0.272 | ||||||||||
TD4 | 4.08 | 0.780 | −0.912 | 0.287 | ||||||||||
TD5 | 4.25 | 0.693 | −0.922 | 0.259 | ||||||||||
TD6 | 4.03 | 0.572 | −0.958 | 0.525 | ||||||||||
TD7 | 4.18 | 0.705 | −0.903 | 0.465 | ||||||||||
TD8 | 3.95 | 0.692 | −0.862 | 0.540 | ||||||||||
TD9 | 4.01 | 0.669 | −0.917 | 0.691 | ||||||||||
0.692 | Loss ordamage of goods/assets (LDG) | LDG1 | 3.93 | |||||||||||
LDG3 | 0.844 | |||||||||||||
LDG2 | 0.826 | |||||||||||||
LDG5 | 0.794 | |||||||||||||
LDG6 | 0.716 | |||||||||||||
LDG1 | 0.708 | PD3 | 0.796 | |||||||||||
PD2 | 0.789 | |||||||||||||
PD3 | ||||||||||||||
TD3 | 0.795 | 0.001 | ||||||||||||
TD2 | 0.867 | 0.001 | ||||||||||||
TD9 | 0.857 | 0.001 | ||||||||||||
TD5 | 0.855 | 0.001 | ||||||||||||
TD6 | 0.856 | 0.001 | ||||||||||||
TD1 | 0.878 | 0.001 | ||||||||||||
TD8 | 0.903 | 0.001 | ||||||||||||
TD4 | 0.865 | 0.001 | ||||||||||||
Loss or damage of goods/assets (LDG) | LDG3 | 0.899 | 0.001 | No item | ||||||||||
LDG2 | 0.897 | 0.001 | ||||||||||||
LDG5 | 0.879 | 0.001 | ||||||||||||
LDG6 | 0.874 | 0.001 | ||||||||||||
LDG1 | 0.871 | 0.001 | ||||||||||||
LDG4 | 0.846 | 0.001 | ||||||||||||
Payment delay (PD) | PD3 | 0.861 | 0.001 | No item | ||||||||||
0.921 | 0.703 | 0.524 | 0.315 | |||||||||||
II | 0.284 ** | 0.839 | Information technical risk | 0.910 | 0.749 | 0.351 | 0.208 | |||||||
ITR | 0.453 ** | 0.503 ** | 0.866 | Transportation delay | 0.879 | 0.744 | 0.417 | 0.251 | ||||||
TD | 0.590 ** | 0.563 ** | 0.417 ** | 0.863 | Loss or damage of goods/assets | 0.854 | 0.771 | 0.531 | 0.382 | |||||
LDG | 0.248 ** | 0.194 * | 0.299 ** | 0.476 ** | 0.878 | Payment delay | 0.916 | 0.732 | 0.419 | 0.266 | ||||
PD | 0.378 ** | 0.138 * | 0.539 ** | 0.526 ** | 0.425 ** | 0.856 | Decrease or total loss of payment | 0.930 | 0.735 | |||||
DLP | 0.415 ** | 0.189 * | 0.485 ** | 0.576 ** | 0.521 ** | 0.468 ** | 0.873 | −0.843 | 0.462 | |||||
LDG2 | 3.97 | 0.199 | −0.954 | 0.481 | ||||||||||
LDG3 | 4.17 | 0.082 | −0.936 | 0.411 | ||||||||||
LDG4 | 3.87 | 0.168 | −0.921 | 0.397 | ||||||||||
LDG5 | 4.41 | 0.694 | −0.951 | 0.439 | ||||||||||
LDG6 | 4.34 | 0.548 | −0.972 | 0.480 | ||||||||||
Payment delay (PD) | PD1 | 4.14 | ||||||||||||
PD2 | 0.857 | 0.001 | 0.766 | |||||||||||
PD3 | 0.851 | 0.001 | PD4 | 0.765 | ||||||||||
PD4 | 0.853 | 0.001 | DPL1 | |||||||||||
Decrease or total loss of payment (DLP) | 0.837 | |||||||||||||
DPL1 | 0.920 | 0.001 | No item | DLP2 | ||||||||||
DLP2 | 0.826 | |||||||||||||
0.799 | 0.001 | DLP6 | 0.804 | |||||||||||
DLP6 | 0.823 | 0.001 | DLP4 | 0.781 | ||||||||||
DLP4 | 0.922 | 0.001 | DLP5 | 0.738 | ||||||||||
DLP3 | 0.667 |
DLP5 |
0.914 |
0.001 |
DLP3 |
0.851 |
0.001 |
ID | II | ITR | TD | LDG | PD | DLP | Score | Rank |
---|