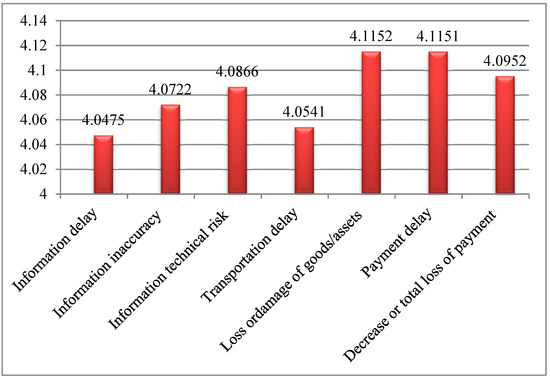
The risk associated with container shipping has been a major concern in recent decades. This study presents three major risk frameworks to systematically and inclusively explore and validate container operational risk scales based on risk factors derived from the extant literature. The three risk frameworks identified are risks related to information flow, risks related to physical flow, and risks related to payment flow. Each risk factor is grouped into sub-factors (dimensions), three factors for information flow, two factors for physical flow, and two factors for payment flow. The study uses Ethiopia as a case study and employed both qualitative and quantitative research methods. An interview survey was conducted to explore additional risk factors and validate the identified risk factors in container shipping, and a questionnaire survey was then accompanied to collect the relevant data. A pairwise comparison chart (PCC) was employed to rank the risk dimensions. The results showed that the container operational risk model is satisfactory by employing exploratory and confirmatory factor analysis. Furthermore, the PCC result indicates that risk of loss or damage of goods/assets, payment delay, and decrease in or total loss of payment were ranked first, second, and third, respectively, and consequently the most significant dimensions of the risk factors. This study provides a reliable and valid scale for measuring container operational risk in container shipping companies. It also unlocks future works for using the identified risk factors as guidelines for researchers and experts to design and develop container operational risk dimensions.
- container operational risk
- information risk
- physical risk
- payment risk
- container shipping
1. Introduction
2. Data Analysis and Results
2.1. Interview Results
| Variables | Validity Analysis | ||||
|---|---|---|---|---|---|
| Information Inaccuracy (α = 0.921) | Information Technical Risk (α = 0.910) | Transportation Delay (α = 0.879) | Loss or Damage of Goods/Assets (α = 0.854) | Payment Delay (α = 0.916) | Decrease or Total Loss of Payment (α = 0.930) |
| Rank | |||||
| University Faculty Members |
| Construct | α | AVE | MSV | ASV | |||||||||
|---|---|---|---|---|---|---|---|---|---|---|---|---|---|
| (n = 6) | ESLSE Experts (n = 12) |
Reliability Analysis (n = 18) |
|||||||||||
| ID | …. | 7 | 5 | 10 | 4 | 7 | 6 | 39 | 7th | Gender | |||
| Male | 4 (66.67) | 7 (58.33) | 11 (61.11) | ||||||||||
| Female | 2 (33.33) | 5 (41.67) | 7 (38.89) | ||||||||||
| Age (y) | 50.6 (8.3) * | 50.7 (10.2) * | 50.7 (9.3) * | ||||||||||
| 2 (33.33) | |||||||||||||
| 3 (25.00) | |||||||||||||
| 5 (27.78) | |||||||||||||
| >20 | 3 (50.00) | 5 (41.67) | 8 (44.44) |
2.2. Questionnaire Results
| Items | Options | Frequency | Percentage (%) | |||||||||||
|---|---|---|---|---|---|---|---|---|---|---|---|---|---|---|
| Employee at ESLSE | Yes | 347 | 100.00 | |||||||||||
| No | 0 | 0.00 | ||||||||||||
| II | 11 | …. | 8 | 11 | 5 | 5 | 7 | 47 | 5th | Gender | Male | |||
| ITR | 13213 | 61.38 | ||||||||||||
| 10 | …. | 7 | 6 | 6 | 7 | 49 | 4th | Female | 134 | 38.62 | ||||
| TD | 8 | 7 | 11 | …. | 6 | 7 | 6 | 45 | 6th | Age | ≤20 | 7 | 2.02 | |
| LDG | 14 | 13 | 12 | 12 | …. | 10 | 11 | 72 | 1st | <30 | - | - | - | |
| 21–25 | 38 | 10.95 | ||||||||||||
| PD | 11 | 13 | 12 | 11 | 8 | …. | 9 | 64 | 2nd | 30–39 | 1 (16.67) | 2 (16.67) | ||
| 26–30 | 3 (16.67) | |||||||||||||
| 67 | 19.31 | 40–49 | 2 (33.33) | |||||||||||
| DLP | 12 | 11 | 11 | 12 | 7 | 9 | …. | 62 | 3rd | 3 (25.00) | 5 (27.78) | |||
| 31–35 | 72 | 20.75 | 50–59 | 3 (50.00) | 6 (50.00) | 9 (50.00) | ||||||||
| 36–40 | 112 | II5 | 32.28 | 0.794 | ≥60 | - | 1 (8.33) | 1 (5.56) | ||||||
| >40 | 51 | |||||||||||||
| ITR3 | 14.70 | 0.854 | Working experience (y) | 18.7 (9.4) * | 19.3 (6.07) * | 19.0 (7.52) * | ||||||||
| Education | Bachelor | 158 | 45.53 | |||||||||||
| ITR1<1 | - | - | - | |||||||||||
| Masters | 63 | 18.16 | 1–5 | - | - | |||||||||
| PhD | - | |||||||||||||
| 13 | 3.75 | 6–10 | - | 2 (16.67) | 2 (11.11) | |||||||||
| 0.847 | ||||||||||||||
| ITR2 | 0.839 | |||||||||||||
| TD7 | 0.842 | Others | 113 | 32.56 | 11–15 | 1 (16.67) | 2 (16.67) | 3 (16.67) | ||||||
| Experience | 1–5 | 73 | 21.04 | 16–20 | ||||||||||
| 6–10 | 114 | 32.85 | ||||||||||||
| 11–15 | 119 | 34.29 | ||||||||||||
| >15 | 41 | 11.82 |
2.3. Descriptive Analysis
| Factors | Items | Mean | Std. | Skewness | Kurtosis | ||||||||
|---|---|---|---|---|---|---|---|---|---|---|---|---|---|
| Information delay (ID) | ID1 | 4.11 | 0.898 | −0.964 | 0.408 | ||||||||
| ID3 | 0.857 | ID2 | −0.791 | 0.070 | |||||||||
| ID14.08 | 0.8490.706 | ID3 | 3.93 | 0.536 | −0.789 | 0.066 | |||||||
| ID4 | 4.05 | 0.871 | −0.795 | 0.104 | |||||||||
| ID4 | 0.826 | Information inaccuracy (II) | II1 | 3.97 | 0.868 | −0.949 | 0.459 | ||||||
| II2 | 3.99 | 0.786 | |||||||||||
| ID2 | 0.803 | −0.925 | |||||||||||
| II2 | 0.831 | 0.462 | |||||||||||
| II1 | 0.821 | II3 | 4.07 | 0.849 | −0.852 | 0.031 | |||||||
| II4 | 0.818 | II4 | 4.12 | 0.852 | −0.912 | 0.387 | |||||||
| II3 | 0.809 | II5 | 4.20 | 0.815 | −0.853 | 0.114 | |||||||
| Information technical risk (ITR) | ITR1 | 3.94 | 0.803 | −0.850 | 0.124 | ||||||||
| ITR2 | 4.13 | 0.875 | −0.853 | 0.125 | |||||||||
| ITR3 | 4.19 | 0.897 | −0.851 | 0.254 | |||||||||
| Transportation delay(TD) | TD1 | 3.90 | 0.786 | −0.814 | 0.136 | ||||||||
| TD2 | 3.94 | 0.849 | −0.963 | 0.516 | |||||||||
| TD3 | 0.835 | TD3 | 4.15 | 0.773 | −0.917 | 0.272 | |||||||
| TD2 | 0.819 | TD4 | 4.08 | ||||||||||
| TD9 | 0.780 | −0.912 | 0.287 | ||||||||||
| 0.724 | TD5 | 4.25 | 0.693 | −0.922 | 0.259 | ||||||||
| TD6 | 4.03 | 0.572 | −0.958 | 0.525 | |||||||||
| TD7 | 4.18 | 0.705 | −0.903 | 0.465 | |||||||||
| TD8 | 3.95 | 0.692 | −0.862 | 0.540 | |||||||||
| TD9 | 4.01 | 0.669 | −0.917 | 0.691 | |||||||||
| TD5 | 0.717 | Loss ordamage of goods/assets (LDG) | LDG1 | 3.93 | 0.735 | −0.843 | 0.462 | ||||||
| LDG2 | 3.97 | 0.199 | −0.954 | 0.481 | |||||||||
| LDG3 | 4.17 | 0.082 | −0.936 | 0.411 | |||||||||
| LDG4 | 3.87 | 0.168 | −0.921 | 0.397 | |||||||||
| LDG5 | 4.41 | 0.694 | −0.951 | 0.439 | |||||||||
| LDG4 | 0.698 | ||||||||||||
| PD3 | 0.796 | ||||||||||||
| PD2 | 0.789 | ||||||||||||
| PD3 | 0.766 | ||||||||||||
| PD4 | 0.781 | ||||||||||||
| Factors | Items | Standardized Loadings (>0.7) | p-Value | Items Removed | ||||||||
|---|---|---|---|---|---|---|---|---|---|---|---|---|
| Information delay (ID) | ID3 | 0.874 | 0.001 | No item | ||||||||
| ID1 | 0.855 | 0.001 | ||||||||||
| 0.762 | ||||||||||||
| 0.282 | ||||||||||||
| 0.249 | ||||||||||||
| TD6 | ||||||||||||
| 0.701 | ||||||||||||
| TD1 | 0.699 | |||||||||||
| TD8 | 0.696 | |||||||||||
| TD4 | 0.692 | |||||||||||
| LDG3 | 0.844 | |||||||||||
| LDG2 | 0.826 | |||||||||||
| LDG5 | 0.794 | LDG6 | 4.34 | 0.548 | −0.972 | 0.480 | ||||||
| Payment delay (PD) | PD1 | 4.14 | 0.920 |
| ID | II | ITR | TD | LDG | PD | DLP | |||||||
|---|---|---|---|---|---|---|---|---|---|---|---|---|---|
| Information delay | 0.935 | 0.751 | 0.454 | 0.279 | |||||||||
| ID | 0.867 | Information inaccuracy | 0.921 | 0.703 | 0.524 | 0.315 | |||||||
| ID2 | 0.872 | 0.001 | |||||||||||
| LDG6 | |||||||||||||
| 0.716 | |||||||||||||
| LDG1 | |||||||||||||
| 0.708 | |||||||||||||
| −0.962 | 0.634 | ||||||||||||
| 0.765 | |||||||||||||
| DPL1 | 0.837 | ||||||||||||
| DLP2 | |||||||||||||
| II | 0.284 ** | 0.839 | Information technical risk | Information inaccuracy (II) | II2 | 0.879 | 0.001 | No item | |||||
| II1 | 0.841 | 0.001 | |||||||||||
| 0.910 | II4 | 0.818 | 0.001 | ||||||||||
| 0.749 | II3 | 0.859 | 0.001 | ||||||||||
| II5 | 0.794 | 0.001 | |||||||||||
| Information technical risk (ITR) | ITR3 | 0.870 | 0.001 | No item | |||||||||
| ITR1 | 0.865 | 0.001 | |||||||||||
| ITR2 | 0.862 | 0.001 | |||||||||||
| Transportation delay (TD) | TD7 | 0.884 | 0.001 | No item | |||||||||
| TD3 | 0.795 | 0.001 | |||||||||||
| TD2 | 0.867 | 0.001 | |||||||||||
| TD9 | 0.857 | 0.001 | |||||||||||
| TD5 | 0.855 | 0.001 | |||||||||||
| TD6 | 0.856 | 0.001 | |||||||||||
| TD1 | 0.878 | 0.001 | |||||||||||
| TD8 | 0.903 | 0.001 | |||||||||||
| TD4 | 0.865 | 0.001 | |||||||||||
| Loss or damage of goods/assets (LDG) | LDG3 | 0.899 | 0.001 | No item | |||||||||
| LDG2 | 0.897 | 0.001 | |||||||||||
| LDG5 | 0.879 | 0.001 | |||||||||||
| 0.351 | 0.208 | ||||||||||||
| ITR | 0.453 ** | 0.503 ** | 0.866 | Transportation delay | 0.879 | 0.744 | 0.417 | 0.251 | |||||
| Loss or damage of goods/assets | 0.854 | 0.771 | 0.531 | 0.382 | PD2 | 4.16 | 0.837 | ||||||
| TD | 0.590 ** | 0.563 ** | 0.417 ** | 0.863−0.989 | 0.674 | ||||||||
| PD3 | 4.09 | 0.749 | −0.983 | 0.578 | |||||||||
| PD4 | 4.07 | 0.538 | −0.921 | 0.401 | |||||||||
| Decrease or total loss of payment (DLP) | DPL1 | 4.25 | 0.357 | −0.993 | 0.600 | ||||||||
| LDG6 | 0.874 | 0.001 | |||||||||||
| LDG1 | 0.871 | 0.001 | |||||||||||
| LDG | 0.248 ** | 0.194 * | 0.299 ** | 0.476 ** | 0.878 | Payment delay | 0.916 | 0.732 | 0.419 | 0.266 | |||
| PD | 0.378 ** | 0.138 * | 0.539 ** | 0.526 ** | 0.425 ** | 0.856 | Decrease or total loss of payment | ||||||
| DLP0.930 | 0.415 ** | 0.189 * | 0.485 ** | 0.576 ** | 0.521 ** | 0.468 ** | 0.873 | LDG4 | 0.846 | 0.001 | |||
| Payment delay (PD) | PD3 | 0.861 | 0.001 | No item | |||||||||
| PD2 | 0.857 | 0.001 | |||||||||||
| PD3 | 0.851 | 0.001 | DLP2 | 3.97 | |||||||||
| PD4 | 0.853 | 0.001 | |||||||||||
| Decrease or total loss of payment (DLP) | DPL10.648 | 0.826 | |||||||||||
| 0.920 | 0.001 | No item | −0.795 | 0.104 | |||||||||
| DLP3 | DLP6 | 0.804 | |||||||||||
| DLP4 | |||||||||||||
| DLP2 | 0.799 | 0.001 | 4.01 | 0.488 | −0.798 | 0.114 | |||||||
| DLP6 | 0.823 | 0.001 | DLP4 | 4.09 | 0.849 | −0.912 | 0.287 | ||||||
| DLP4 | 0.922 | DLP5 | 4.11 | 0.748 | −0.983 | 0.578 | |||||||
| DLP6 | 4.14 | 0.392 | −0.843 | 0.462 |
2.4. Exploratory Factor Analysis
| Measurement Items | Information Delay (α = 0.935) |
|---|---|
| 0.001 | |
| DLP5 | |
| 0.738 | |
| DLP3 | |
| 0.667 |
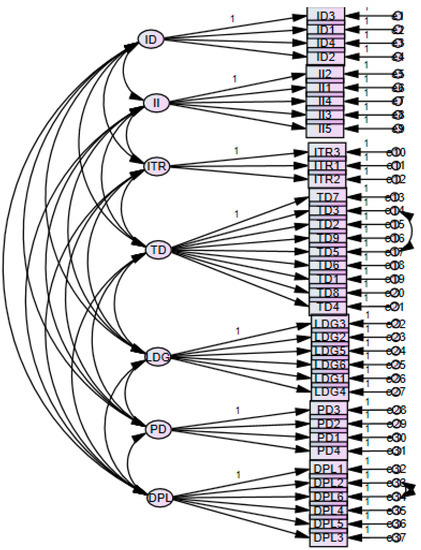
2.5. Measurement Model
| ID4 | |
| 0.865 | 0.001 |
| DLP5 | |
| 0.914 | |
| 0.001 | |
| DLP3 | |
| 0.851 | |
| 0.001 | |
| ID | II | ITR | TD | LDG | PD | DLP | Score |
|---|
3. Discussions and Conclusions
References
- Lam, J.S.L. Benefits and barriers of supply chain integration: Empirical analysis of liner shipping. Int. J. Shipp. Transp. Logist. 2013, 5, 13.
- Guerrero, D.; Rodrigue, J.-P. The waves of containerization: Shifts in global maritime transportation. J. Transp. Geogr. 2014, 34, 151–164.
- Karahalios, H.; Yang, Z.L.; Wang, J. A risk appraisal system regarding the implementation of maritime regulations by a ship operator. Marit. Policy Manag. 2015, 42, 389–413.
- Ozbas, B. Safety risk analysis of maritime transportation: Review of the literature. Transp. Rec. Res. J. Transp. Res. Board 2013, 2326, 32–38.
- UK. Health and Safety Executive, Health and Safety in Port and Docks. Available online: http://www.hse.gov.uk/ports (accessed on 26 July 2016).
- Hong Kong Marine Department. Marine Industrial Accident Statistics; Report of Marine Deprtment; Hong Kong Marine Department: Hong Kong, China, 2016.
- ESLSE. Enterprise Performance. Addis Ababa, Ethiopia. Available online: https://www.portstrategy.com/directory-entries/ethiopian-shipping-and-logistics-services-enterprise (accessed on 12 March 2021).
- Lee, H.L.; Padmanabhan, V.; Whang, S. Information distortion in a supply chain: The bullwhip effect. Manag. Sci. 1997, 43, 546–558.
- Angulo, A.; Nachtmann, H.; Waller, M.A. Supply chain information sharing in a vendor managed inventory partnership. J. Bus. Logist. 2004, 25, 101–120.
- Husdal, J.; Bråthen, S. Bad locations, bad logistics? How Norwegian freight carriers handle transportation disruptions. In Proceedings of the World Conference for Transportation Research, Lisbon, Portugal, 11–15 July 2020.
- Mitra, S.; Karathanasopoulos, A.; Sermpinis, G.; Dunis, C.; Hood, J. Operational risk: Emerging markets, sectors and measurement. Eur. J. Oper. Res. 2015, 241, 122–132.
- Goerlandt, F.; Montewka, J. Maritime transportation risk analysis: Review and analysis in light of some foundational issues. Reliab. Eng. Syst. Saf. 2015, 138, 115–134.
- Chang, C.-H.; Xu, J.; Song, D.-P. Risk analysis for container shipping: From a logistics perspective. Int. J. Logist. Manag. 2015, 26, 147–171.
- Chang, C.-H.; Xu, J.; Song, D.-P. Impact of different factors on the risk perceptions of employees in container shipping companies: A case study of Taiwan. Int. J. Shipp. Transp. Logist. 2016, 8, 361.
- Bearzotti, L.; Gonzalez, R.; Miranda, P. The Event Management Problem in a Container Terminal. J. Appl. Res. Technol. 2013, 11, 95–102.
- Pallis, P.L. Port Risk Management in Container Terminals. Transp. Res. Procedia 2017, 25, 4411–4421.
- Nguyen, S.; Wang, H.Y. Prioritizing operational risks in container shipping systems by using cognitive assessment technique. Marit. Bus. Rev. 2018, 3, 185–206.
- Drewry. Risk Management in International Transport and Logistics; Drewry Shipping Consultants Ltd.: London, UK, 2009.
- Fu, X.; Ng, A.K.Y.; Lau, Y.Y. The impacts of maritime piracy on global economic development: The case of Somalia. Marit. Policy Manag. 2010, 37, 677–697.
- Yang, Y.C. Impact of the container security initiative on Taiwan’s shipping industry. Marit. Policy Manag. 2010, 37, 699–722.
- Yang, Y.C. Risk management of Taiwan’s maritime supply chain security. Saf. Sci. 2011, 49, 382–393.
- Lawshe, C.H. A quantitative approach to content validity. Pers. Psychol. 1975, 28, 563–575.
- Hair, J.F.; Black, W.C.; Babin, B.J.; Anderson, R.E. Multivariate Data Analysis, 7th ed.; Prentice Hall: Upper Saddle River, NJ, USA, 2010.
- Tabachnick, B.G.; Fidell, L.S. Using Multivariate Statistics; Pearson Education, Inc.: Boston, MA, USA, 2007.
- Curran, J.M.; Lennon, R. Participating in the conversation: Exploring usage of social media networking sites. Acad. Mark. Stud. J. 2011, 15, 21–38.
- Nunnally, J.C. Psychometric Theory, 2nd ed.; McGraw-Hill: New York, NY, USA, 1978.
- Mathwick, C.; Rigdon, E. Play, flow, and the online search experience. J. Consum. Res. 2004, 31, 324–332.
- Cortina, J.M. What is coefficient alpha? An examination of theory and applications. J. Appl. Psychol. 1993, 78, 98–104.
- Fornell, C.; Larcker, D.F. Structural equation models with unobservable variables and measurement error: Algebra and statistics. J. Mark. Res. 1981, 18, 39–50.
- Bentler, P.M.; Bonett, D.G. Significance tests and goodness of fit in the analysis of covariance structures. Psychol. Bull. 1980, 88, 588–606.
- Hu, L.; Bentler, P. Cutoff criteria for fit indexes in covariance structure analysis: Conventional criteria versus new alternatives. Struct. Equ. Modeling 2009, 6, 1–55.
- Seo, D.C.; Torabi, M.R.; Blair, E.H.; Ellis, N.T. A cross-validation of safety climate scale using confirmatory factor analytic approach. J. Saf. Res. 2004, 35, 427e45.
- Tummala, R.; Xie, C.; Schoenherr, T. Assessing and managing risks using the supply chain risk management process (SCRMP). Supply Chain Manag. 2011, 16, 474–483.
- Qi, Y.; Zhang, Q. Research on Information Sharing Risk in Supply Chain Management. In Proceedings of the 2008 4th International Conference on Wireless Communications, Networking and Mobile Computing, Dalian, China, 12–14 October 2008; pp. 1–6.
- Notteboom, T.E. The time factor in liner shipping services. Marit. Econ. Logist. 2006, 8, 19–39.
- Sexton, J.; Helmreich, R.; Neilands, T.; Rowan, K.; Vella, K.; Boyden, J.; Roberts, P.R.; Thomas, E. The Safety Attitudes Questionnaire: Psychometric properties, benchmarking data, and emerging research. BMC Health Serv. Res. 2006, 6, 44.
- Fernández-Muñiz, B.; Montes-Peón, J.M.; Vázquez-Ordás, C.J. Safety climate in OHSAS 18001-certified organisations: Antecedents and consequences of safety behaviour. Accid. Anal. Prev. 2012, 45, 745–758.
- Leach, C.W.; van Zomeren, M.; Zebel, S.; Vliek, M.L.; Pennekamp, S.F.; Doosje, B.; Ouwerkerk, J.W.; Spears, R. Group-level self-definition and self-investment: A hierarchical (multicomponent) model of in-group identification. J. Pers. Soc. Psychol. 2008, 95, 144–165.
- Tharaldsen, J.; Olsen, E.; Rundmo, T. A longitudinal study of safety climate on the Norwegian continental shelf. Saf. Sci. 2008, 46, 427–439.
- Wynd, C.A.; Schmidt, B.; Schaefer, M.A. Two quantitative approaches for estimating content validity. West. J. Nurs. Res. 2003, 25, 508–518.