2.1. Interview Results
In the interview exercise, all the identified risk factors from the extant literature presented in the research framework were confirmed. Two new risk factors were recommended and added to the existing ones, which sum up 37 risk factors.
One suggested risk factor during the interviews is “Exchange rate fluctuation during payment process”. It was recommended as a risk factor as it results in an increase in cost, which has the tendency to delay the payment process. Similarly, “Unexpected rise in operational cost” was also recommended as a risk factor.
Table A1 in the
Appendix A summarizes all the risk factors identified in this research, two of which were identified through interviews (i.e., DPL1 and DLP3, highlighted in bold). The code of each item is listed in the second column in
Table A1. The interviewees further confirmed the validity of the scale being identified.
Eighteen interviewees participated in the content and the face validity analyses of the container shipping scale. As shown in Table 1, the majority of the university faculty members (66.67%) and ESLSE experts (58.33%) were male. The age pattern revealed that most respondents of the two groups of the participants were aged 50–59 years. Most of the ESLSE experts had more than 20 years of working experience, and most of the university faculty members (50%) had more than 20 years of working experience. The majority (61.11%) of the interviewees who participated in the reliability analysis were male. Most of these interviewees were aged 50–59 years, and 44.44% of them had >20 years of working experience.
The analysis of the content validity of the scales, which were rated by the university faculty members and ESLSE experts, showed that all the 37 items had an excellent content validity. The acceptable level of CVR for the 18 interviewees is >0.38 [
61]. Consequently, the 37 items were retained.
2.2. Questionnaire Results
This paper conducted the questionnaire data analysis through descriptive analysis, reliability and validity analysis, and exploratory factor analysis (EFA) to explore and validate the risk factors based on experts’ and employees’ perceptions.
However, before the EFA, we established the demographic characteristics of the survey participants. As shown in Table 1, the largest category of the participants at ESLSE who participated in the questionnaire survey was those between 36 and 40 years of age (32.28%), followed by those in the 31 to 35 years of the age range (20.75%). There were only seven respondents who were 20 years or below in age. Regarding the genders of the participants, male participants were higher in frequency than female participants at percentages of 61.28 and 38.62, respectively. Most participants had 11–15 years of working experience (34.29%), followed by those with 6–10 years of working experience (32.85%). The demographic information of the survey respondents is summarized in Table 2.
Table 2. Demographic characteristics of the participant.
2.3. Descriptive Analysis
Descriptive statistics analysis was done for all items for their mean, standard deviation, skewness, and kurtosis to test the normality of the data. According to Hair et al. [
62], normality refers to the “degree to which the distribution of the sample data corresponds to a normal distribution”. The data can be assessed for normality statistically by obtaining skewness and kurtosis. Skewness is the measure of the symmetry of the data distribution [
63], while kurtosis measures the peak or flatness of the distribution [
62]. The distribution is normal when the values of skewness and kurtosis range between −1 and +1 [
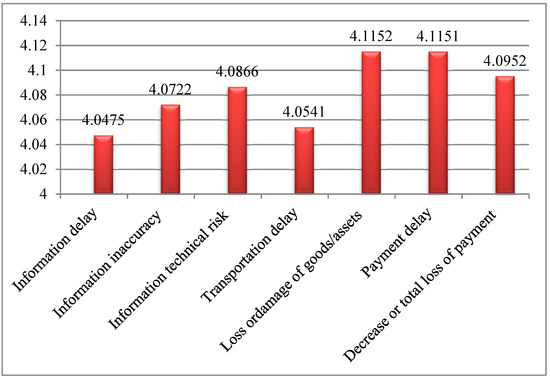
64]. The results show that the values of mean ranged from 4.04 to 4.11 on a five-point scale, which indicates that most of the respondents had an agreement with the items of risk factors associated with container shipping, as displayed in
Figure 4
Figure 4. Mean values of risk factors.
Furthermore, we presented the results of the descriptive statistics in Table 3 for each item. The results showed that the standard deviations range between 0.082 and 0.971, which implied that the values were acceptable. The normality distribution of the data was adequate because the values ranged between −1 and +1 according to the assumption of skewness and kurtosis.
Table 3. Descriptive Analysis.
2.5. Measurement Model
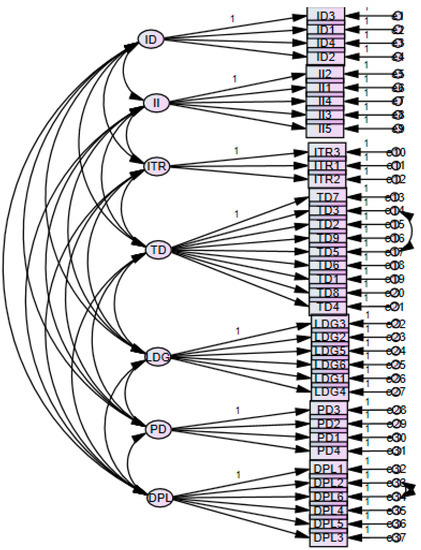
As illustrated in Figure 5, the risk factor measurements were considered as latent constructs in confirmatory factor analysis (CFA). The result of CFA confirmed that the model that EFA initially established is acceptable. The chi-square minimum discrepancy (CMIN) divided by its degrees of freedom (df) or CMIN/df is less than the suggested 3.0 value, and the overall chi-square statistic for the measurement model was significant (χ2 = 315.070, df = 176, CMIN/df = 1.790, p < 0.001).
Figure 5. Confirmatory factor analysis of container shipping risk factor scale.
We followed the process outlined by [
66] to complete the factor analysis, all individual items in each construct load at a statistically significant level (
p < 0.001), with the standardized loadings for all items spanning from 0.794 to 0.923, as presented in
Table 5. The standardized loadings met both the minimum (0.50) and preferred (0.70) guideline suggested by [
67] for all 37 items. The AVE value was 0.745, and each construct’s AVE exceeded 0.703, reaching the benchmark of 0.50 for convergent validity recommended by [
68].
Table 5 shows the standardized factor loadings of the measurement model.
Table 6 shows the results for discriminant validity, where construct values for MSV, ASV, and AVE were compared to confirm MSV < AVE and ASV < AVE for all constructs. The discriminant validity of the constructs was also established by comparing the square root of the AVE with their paired correlations as shown in the diagonal of the matrix in
Table 7.
Table 5. Standardized Factor Loadings of Measurement Model.
Table 6. Scale Reliability and Validity Statistics for Measurement Model.
Table 7. Factor correlation matrix with square root of the AVE on the diagonal.
Moreover, other goodness of fit measures show that the model is satisfactory and hence acceptable. The GFI (0.953), AGFI (0.937), IFI (0.951), CFI (0.986), and NFI (0.968) were all greater than the 0.90 threshold value recommended by [
69]. Furthermore, the RMSEA (0.047) computed value is far below the 0.08 threshold value recommended by [
62]. Lastly, the calculated CFI value of 0.985 is above the recommended threshold value of 0.95 by [
70]. (See bottom of
Table 6.)
In order to rank the risks, pair-wise ranking was performed using the pairwise comparison chart (PCC) to help rank the risk dimensions as experienced by the experts based on their impact on container shipment (Table 8). In this way, the study also reveals which risks have a more serious impact than others and consequently which ones are the most significant among all other risks.
Table 8. Pairwise comparison chart (PCC).
We rank the risk dimensions based on the perceptions and perspectives of the interviewees using the five-step procedure of the pairwise comparison chart (PCC) as follows: In the first step, we listed down the risk dimensions along the top row of the table and along the left hand side of the table. In the second step, we put dashes diagonally downwards in the chart. In the third step, we moved to the whole chart comparing two risk dimensions at a time to determine which one is more or less important based on the experts’ perspectives and perceptions. We recorded 1 in the row for the risk dimension that was more important and 0 in the row for the risk dimension that was less important. In the fourth step, we added across each row to determine the total. Finally, in the fifth step, we ranked the risk dimensions and reflect on the results.
From the results in Table 8, the ranking shows that risk of loss or damage of goods/assets ranks number one among the seven dimensions of the risk factors with a total score of 72. The second-ranked risk is the risk of payment delay with a score of 64 followed by a decrease in or total loss of payment with a score of 62 that ranks third. The fourth, fifth sixth, and seventh are information technical risk, information inaccuracy, transportation delay, and information delay with scores of 49, 47, 45, and 39 respectively.


