Your browser does not fully support modern features. Please upgrade for a smoother experience.
Submitted Successfully!
 +1 credit
Thank you for your contribution! You can also upload a video entry or images related to this topic.
For video creation, please contact our Academic Video Service.
| Version | Summary | Created by | Modification | Content Size | Created at | Operation |
|---|---|---|---|---|---|---|
| 1 | Chuanrong Zhang | -- | 4293 | 2022-10-14 15:37:35 | | | |
| 2 | Vivi Li | -11 word(s) | 4282 | 2022-10-17 02:51:36 | | |
Video Upload Options
We provide professional Academic Video Service to translate complex research into visually appealing presentations. Would you like to try it?
Cite
If you have any further questions, please contact Encyclopedia Editorial Office.
Zhang, C.; Li, X. Land Use and Land Cover Mapping. Encyclopedia. Available online: https://encyclopedia.pub/entry/29436 (accessed on 18 July 2026).
Zhang C, Li X. Land Use and Land Cover Mapping. Encyclopedia. Available at: https://encyclopedia.pub/entry/29436. Accessed July 18, 2026.
Zhang, Chuanrong, Xinba Li. "Land Use and Land Cover Mapping" Encyclopedia, https://encyclopedia.pub/entry/29436 (accessed July 18, 2026).
Zhang, C., & Li, X. (2022, October 14). Land Use and Land Cover Mapping. In Encyclopedia. https://encyclopedia.pub/entry/29436
Zhang, Chuanrong and Xinba Li. "Land Use and Land Cover Mapping." Encyclopedia. Web. 14 October, 2022.
Copy Citation
The volume of collected or archived geospatial data for land use and land cover (LULC) mapping including remotely sensed satellite imagery and auxiliary geospatial datasets is increasing. Innovative machine learning, deep learning algorithms, and cutting-edge cloud computing have also been developed. While new opportunities are provided by these geospatial big data and advanced computer technologies for LULC mapping, challenges also emerge for LULC mapping from using these geospatial big data.
land use and land cover mapping
remote sensing
machine learning
deep learning
geospatial big data
1. Introduction
Accurate and timely land use and land cover (LULC) maps are important for a variety of applications such as urban and regional planning, disasters and hazards monitoring, natural resources and environmental management, and food security [1][2][3]. LULC mapping may help tackle many significant large-scale challenges, such as global warming, the accelerating loss of species habitat, unprecedented population migration, increasing urbanization, and growing inequalities within and between nations [4][5]. Therefore, it is important to produce accurate LULC maps.
The land use concept and the land cover concept, though related, are distinctly different [6]. Land cover mainly refers to direct observations of terrestrial ecosystems, natural resources, and habitats on the Earth’s surface, while land use generally describes a certain land type produced, changed or maintained by the arrangements, activities, and inputs of people. Land use relates to the purpose for which land is utilized by people, but land cover specifies landscape patterns and characteristics. Examples of land use may include multi-family residential homes, state parks, reservoirs, and shopping centers. In contrast, examples of land cover may include forests, wetlands, built areas, water, and grasslands. However, land use and land cover are often used as interchangeable terms in existing research literature.
Remotely sensed satellite imagery is a valuable source for LULC mapping [7][8][9]. Many studies have attempted to extract LULC information from remotely sensed imagery [2][10]. Advances in remote sensing technologies have resulted in improvements in spectral, spatial, and temporal resolutions of satellite imagery, all of which benefit LULC mapping. LULC mapping is currently experiencing a transformation from the coarse and moderate scales to much finer scales in order to provide more precise land knowledge. Although remotely sensed imagery has been used in LULC mapping since the launch of Landsat 1 in 1972 [11], it is still difficult to capture complex and diverse LULC information and patterns by using remotely sensed imagery alone [12]. Ancillary data are typically needed as a supplement to remotely sensed imagery in order to accurately identify LULC information, especially the land use information related to socioeconomic aspects [13].
With the development of GPS and data acquisition techniques, the merging of big data with spatial location information—such as social media data, mobile phone tracking data, public transport smart card data, Wi-Fi access point data, wireless sensor networks, and other sensing information generated by Internet of Things devices—may provide useful ancillary data for LULC mapping [14]. Compared to traditional geospatial data acquisition, these geospatial big data are normally obtained at a lower cost and have different coverages and better spatio-temporal resolutions. They contain abundant human activity information and may thus be used to compensate for the lack of socioeconomic attributes of the remotely sensed imagery data for accurate LULC mapping [15]. In fact, the aforementioned geospatial big data were integrated with remotely sensed imagery and other source data for accurate LULC mapping in many studies [16][17].
Human are currently living in the era of big data. The volume of collected or archived geospatial data, including remotely sensed data, is increasing from terabytes to petabytes and even to exabytes [18]. For example, the European Space Agency (ESA), the National Aeronautics and Space Administration (NASA), the United States Geological Survey (USGS), and the National Oceanic and Atmospheric Administration (NOAA) provide a huge amount of freely available remotely sensed data and other Geographic Information System (GIS) data for LULC mapping. Social media sites, such as Facebook, Twitter, and Instagram, are generating an enormous volume of data with geospatial location information that can be used for LULC mapping nowadays [19]. Progress in data access and algorithm development in the era of big data provides opportunities for developing improved LULC maps [20]. Figure 1 illustrates the major opportunities of LULC mapping in the era of big data. Databases that offer free access to LULC maps at the global scale have emerged. For example, as a free search engine, “Collect Earth” developed by the Food and Agriculture Organization (FAO) can help derive past and present LULC change information [21].
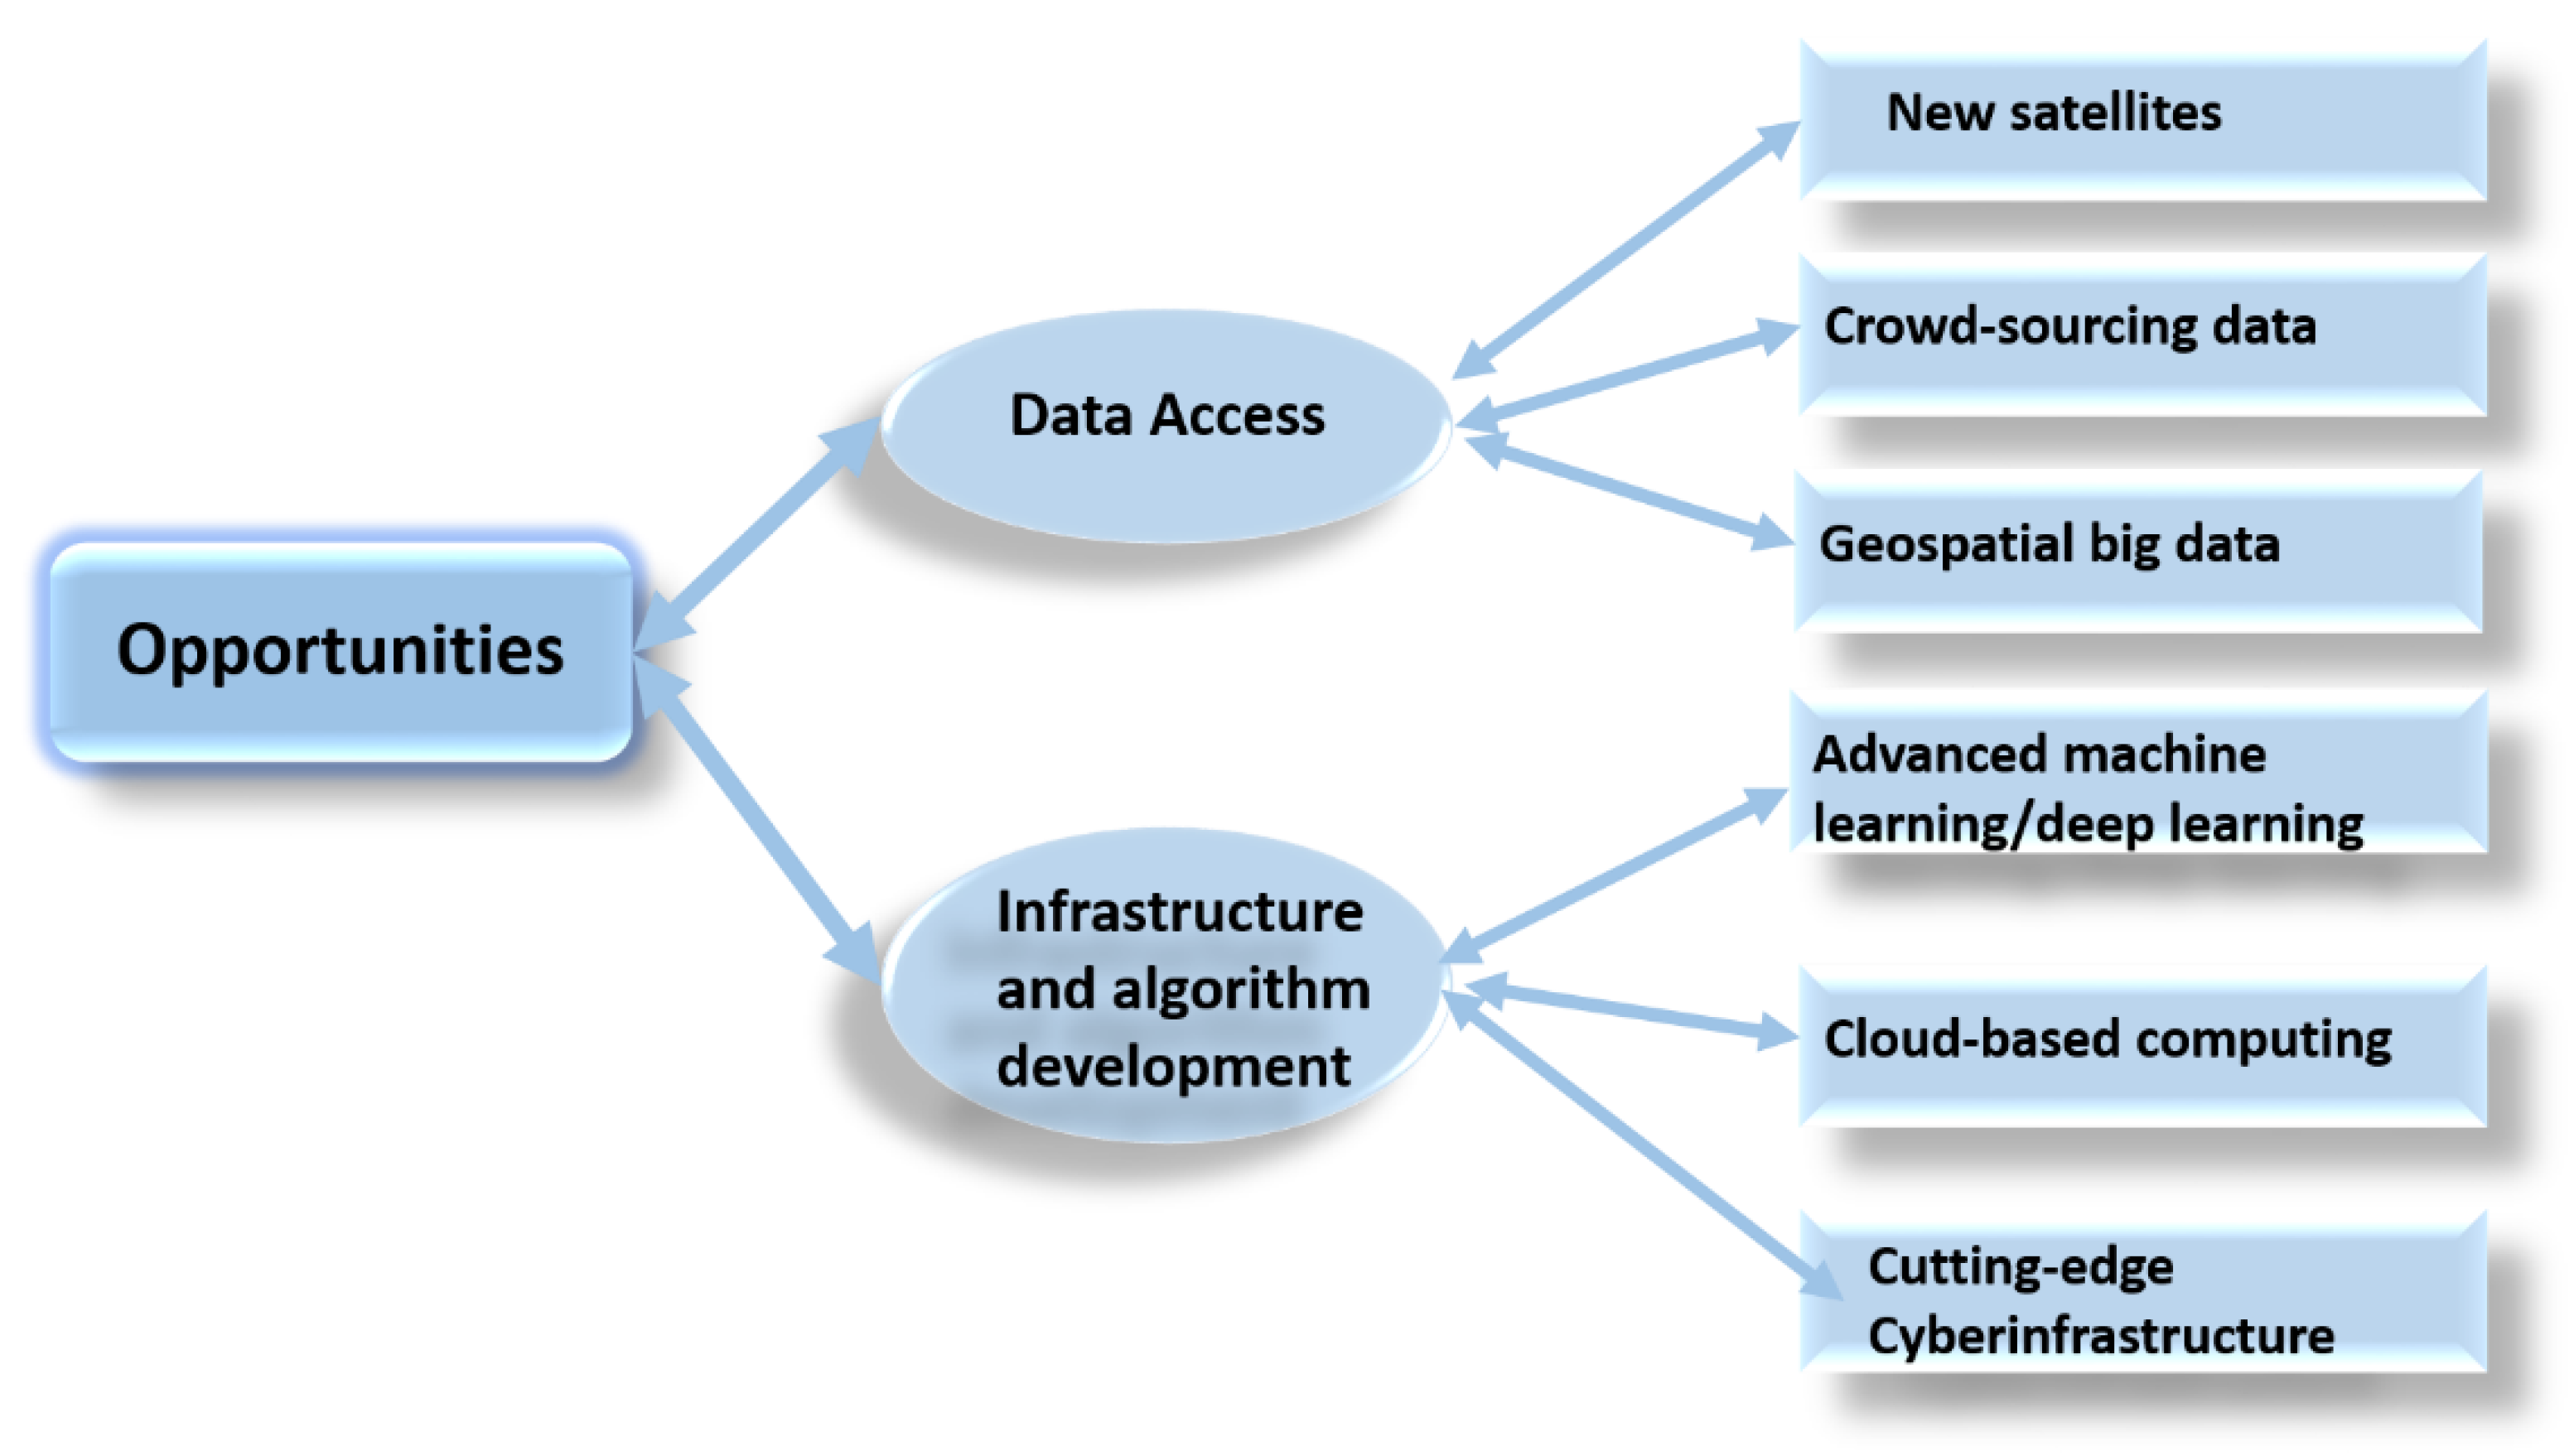
Figure 1. Major opportunities of LULC mapping in the era of big data.
While these geospatial big data provide new opportunities, challenges remain in storing, managing, analyzing, and visualizing these data for LULC mapping [22]. Geospatial big data not only have various forms but are also often associated with unstructured data that are difficult to manage [23]. It is extremely difficult to integrate, analyze, and transform these heterogeneous geospatial big data from different sources into useful values for LULC mapping. Traditional LULC classification or mapping solutions and software face excessive challenges in dealing with these large and complex geospatial big data. New approaches are needed to efficiently process and analyze these data to reveal patterns, trends, and associations related to LULC mapping [24].
Lately, advanced machine learning techniques, especially deep learning (DL), have been developed for large-scale LULC mapping based on multispectral and hyperspectral satellite images or the integration of satellite imagery with other geospatial big data [25]. Deep learning has demonstrated better performance compared to traditional methods, such as random forest (RF) and support vector machine (SVM), e.g., [26][27][28]. Nevertheless, there are still many issues in applying advanced machine learning or deep learning for accurate LULC mapping using geospatial big data.
2. LULC Mapping from Remotely Sensed Imagery Data
As mentioned previously, remote sensing has become one of the most important methods for LULC mapping [29][30]. Many existing LULC maps were made by the classification of remotely sensed satellite imagery data [31]. Remotely sensed data have multi-source, multi-scale, high-dimension, and non-linear characteristics [32]. Since the advent of remote sensing technology, many satellites have been launched. Every day, a large set of spaceborne and airborne sensors provide a massive amount of remotely sensed data. At present, there are more than 200 on-orbit satellite sensors capturing a large amount of multi-temporal and multi-scale remotely sensed data. For example, NASA’s Earth Observing System Data and Information System (EOSDIS) managed more than 7.5 petabytes of archived remotely sensed data and archived a daily data increase of four TB in 2013 [33]. Many satellite imagery data providers release timely remotely sensed data to the public without any cost. USGS, NASA, NOAA, IPMUS Terra, NEO, and Copernicus open access hubs are among the most popular open access remotely sensed data providers.
In the past, many LULC maps were made from coarse spatial resolution satellite imagery data such as advanced very-high-resolution radiometer (AVHRR) and moderate-resolution imaging spectroradiometer (MODIS) [34]. Advances in remote sensing technology and the launch of sensors with moderate spatial resolutions, such as Landsat, Satellite Pour l’Observation de la Terre (SPOT), and Advanced Spaceborne Thermal Emission and Reflection Radiometer (ASTER), have contributed to enhanced LULC mapping, e.g., [35][36]. Lately, detailed LULC maps have been produced from high-resolution imagery data such as QuickBird, IKONOS, and WorldView, which can provide more detailed spatial and spectral information for LULC mapping, e.g., [37][38][39]. With these high-resolution remotely sensed data, it is possible to identify the detailed geometries, textures, sizes, locations, and adjacent information of ground objects at a much finer scale for LULC mapping [40].
In addition to the different spatial resolutions, the remotely sensed data for LULC mapping also have different spectral and temporal resolutions. Many satellite sensors produce imagery data with very-high spectral resolutions [41]. For example, the Hyperion sensor consists of 220 spectral bands, the AVIRIS system provides 224 spectral bands, the WIS instrument has 812 bands, and the hyperspectral imager equipped in HJ-1A has 128 bands. Furthermore, remotely sensed data may come from different types of satellites. Some satellites use optical sensors such as SPOT, Landsat, and IKONOS; some use microwave synthetic aperture radar (SAR) sensors such as TerraSAR, Envisat, and RADARSAT; while others use multi-mode sensors such as MODIS. While the optical satellite imagery data face challenges in producing LULC maps under cloudy weather conditions, microwave SAR data allow LULC mapping under all weather conditions, including the constantly cloudy weather situation [42][43][44]. From a temporal resolution perspective, these satellites also have different capabilities to revisit an observation area. Some satellites have a short revisit period of one day (e.g., MODIS and WorldView), while other satellites have a long revisit period of 16 days (e.g., Landsat). Figure 2 shows different types of remotely sensed satellite imagery for LULC mapping. Teeuw et al. [45], Navin and Agilandeeswari [46], and Pandey et al. [47] provided detailed tables for the characteristics of different types of remotely sensed data.
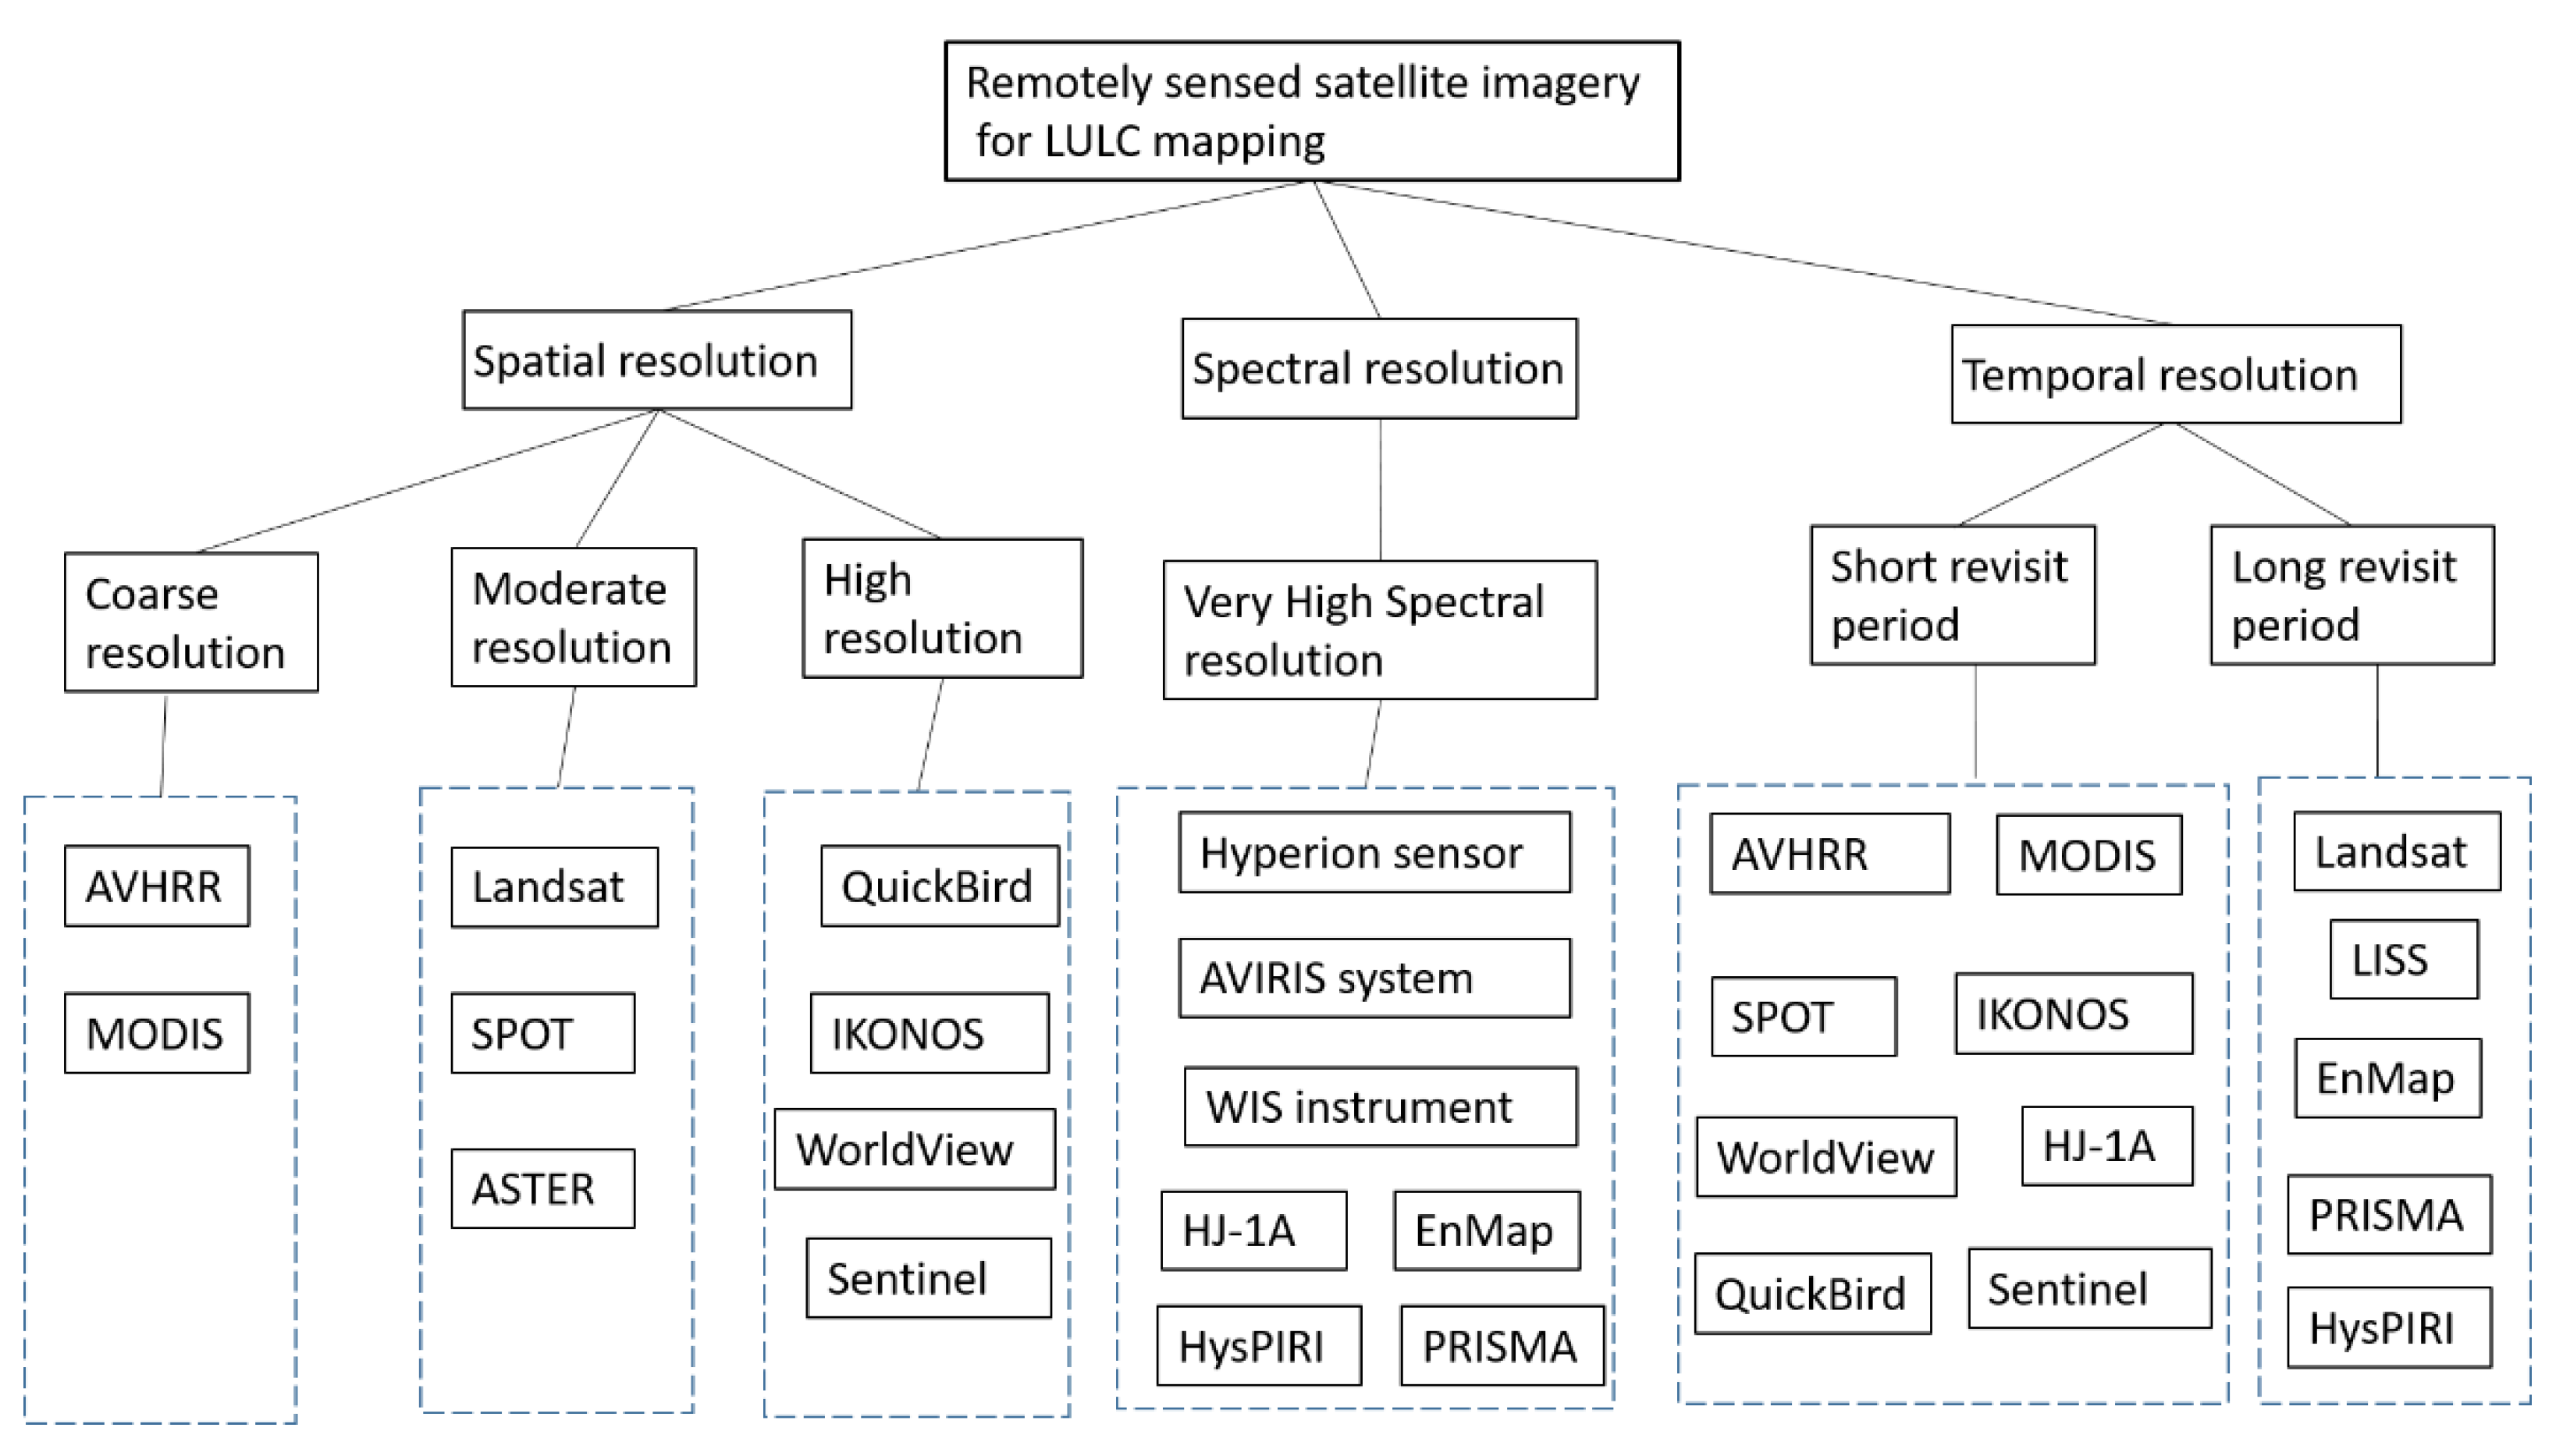
Figure 2. Different types of remotely sensed satellite imagery for LULC mapping.
As illustrated in Figure 3, more types of remotely sensed data have emerged to provide additional observations for LULC mapping [32]. These remotely sensed data provide observations to differentiate LULC types with complex structures, which are difficult to differentiate in the past. For example, as a unique measure of human activities and socio-economic attributes, remote sensing-based nighttime lights (NTL) imagery is especially useful for urban LULC mapping at different spatial and temporal scales, e.g., [48][49]. Light detection and ranging (Lidar) is another type of remotely sensed data for detailed LULC mapping, e.g., [50]. Unlike optical data, airborne Lidar data can capture highly accurate structural information to differentiate LULC types with different structures, components, and compositions [51]. In addition, street-view imagery from Google, Baidu, and Tencent also functions as an additional type of remotely sensed data for LULC mapping, e.g., [52][53]. In contrast to the overhead view captured by most other remote sensing methods, street-view imagery data provide street-level or eye-level observations along the road networks. By providing information about what people typically see at street level on ground, street-view imagery data provide crucial information on the functions of objects conventionally hidden from the view above, e.g., [54]. For example, street-view imagery data have been used for level II or III land use classification (e.g., differentiation of commercial buildings and residential buildings by using text information on buildings from street-view imagery data [55]. Street-view imagery can also be used for ground truth purposes. Recently, unoccupied aerial system (UAS) platforms with small-sized and high-detection-precision sensors have also started producing massive high-resolution images as well, and have been extensively used for high-resolution LULC mapping, e.g., [56][57]. Currently, the amount of data collected by UAS is about to explode.
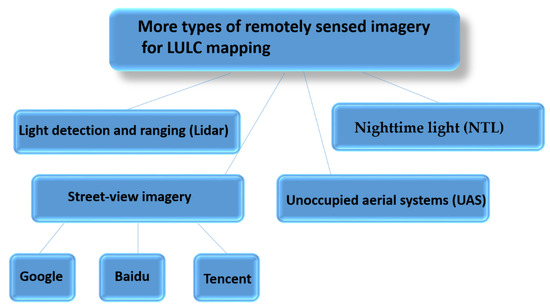
Figure 3. More types of remotely sensed imagery for LULC mapping.
Because of the diversity and high dimensionality of remotely sensed data, LULC mapping from remotely sensed big data becomes complex. It is challenging to identify the right datasets and combine them to make detailed LULC maps at large scales. Although the multi-source optical and microwave remotely sensed data allow people to obtain LULC information from multiple viewpoints, they sometimes cause confusion in deciding which type is the most appropriate for particular LULC mapping. In addition, because of the data representation challenge, it is difficult to integrate the various remotely sensed data with different features (e.g., spectral signatures in optical imagery and electromagnetic radiations in microwave imagery) from various sources. Traditional pixel-level, feature-level, and decision-level fusion cannot be used to integrate remotely sensed imagery with different scales and/or formats [18]. New approaches need to be developed to fuse remotely sensed imagery with other geospatial big data, such as photos from a social network and crowdsourcing spatial data, for LULC mapping.
3. LULC Mapping from Integration of Geospatial Big Data and Remotely Sensed Imagery Data
Although remotely sensed data have become one of the most important data sources for LULC mapping, these have limitations [58][59]. Remotely sensed data are valuable to extract natural and physical land cover information based on spectrum, texture, geometry, context, and temporal information, but they have limitations in capturing the patterns of human activities and socioeconomic environments and describing indirect anthropogenic differences among different land use classes [13]. For example, while the spectral information of remotely sensed imagery data is effective to extract land cover information such as water area, forest land, and built-up area, it is almost impossible to distinguish some land use classes such as some industrial land, residential land, and commercial land using the spectral information of remotely sensed data alone [55].
With the development of mobile positioning techniques, wireless communication, and the Internet of Things, new emerging types of social sensing big data are providing complementary information to differentiate some land use classes caused by human activities and socioeconomic environments [9]. Examples of these emerging social sensing big data include mobile phone data, geo-tagged photos, social media data, traffic trajectories, and volunteered geographic information (VGI) data [60]. These emerging social sensing big data are able to more effectively capture human activities and dynamic socioeconomic environments, and are regarded as complements of remotely sensed imagery data for effectively LULC mapping [61][62]. For example, Geo-Wiki is a crowdsourcing platform for LULC mapping and other tasks, which was used to derive the global LULC reference data via four campaigns [63]. Flickr offers online services for the sharing of digital photos with geographic locations based on social networks, which was used to identify socioeconomic and human activities in LULC mapping [19]. OpenStreetMap (OSM) (as a VGI database) allows the adding, editing, and updating of basic geographic map information with users’ experience and knowledge, which was also used to uncover some land use types and patterns, e.g., [64][65]. The points of interest (POIs), as one of the most common categories of crowdsourced data, were explored for land use classification by many scholars, e.g., [66][67][68]. In addition, a large amount of GPS traffic trajectory data also further enriched the remotely sensed data in excavating human activities at a fine scale for accurate LULC mapping [69].
These emerging social sensing big data improved the existing LULC maps by providing more detailed socioeconomic information and finer spatio-temporal resolutions [70]. Many studies have been conducted to integrate the social sensing big data with remotely sensed data for LULC mapping at different scales and locations, e.g., [71][72][73]. For example, Hu et al. [74] developed a protocol to identify urban land use functions over large areas using satellite images and open social data. Yin et al. [75] employed both the decision-level integration and feature-level integration of remotely sensed data with social sensing big data for urban land use mapping. Integrating data from these social sensing big data with remotely sensed data may provide a more comprehensive picture of LULC patterns, as shown in Figure 4.
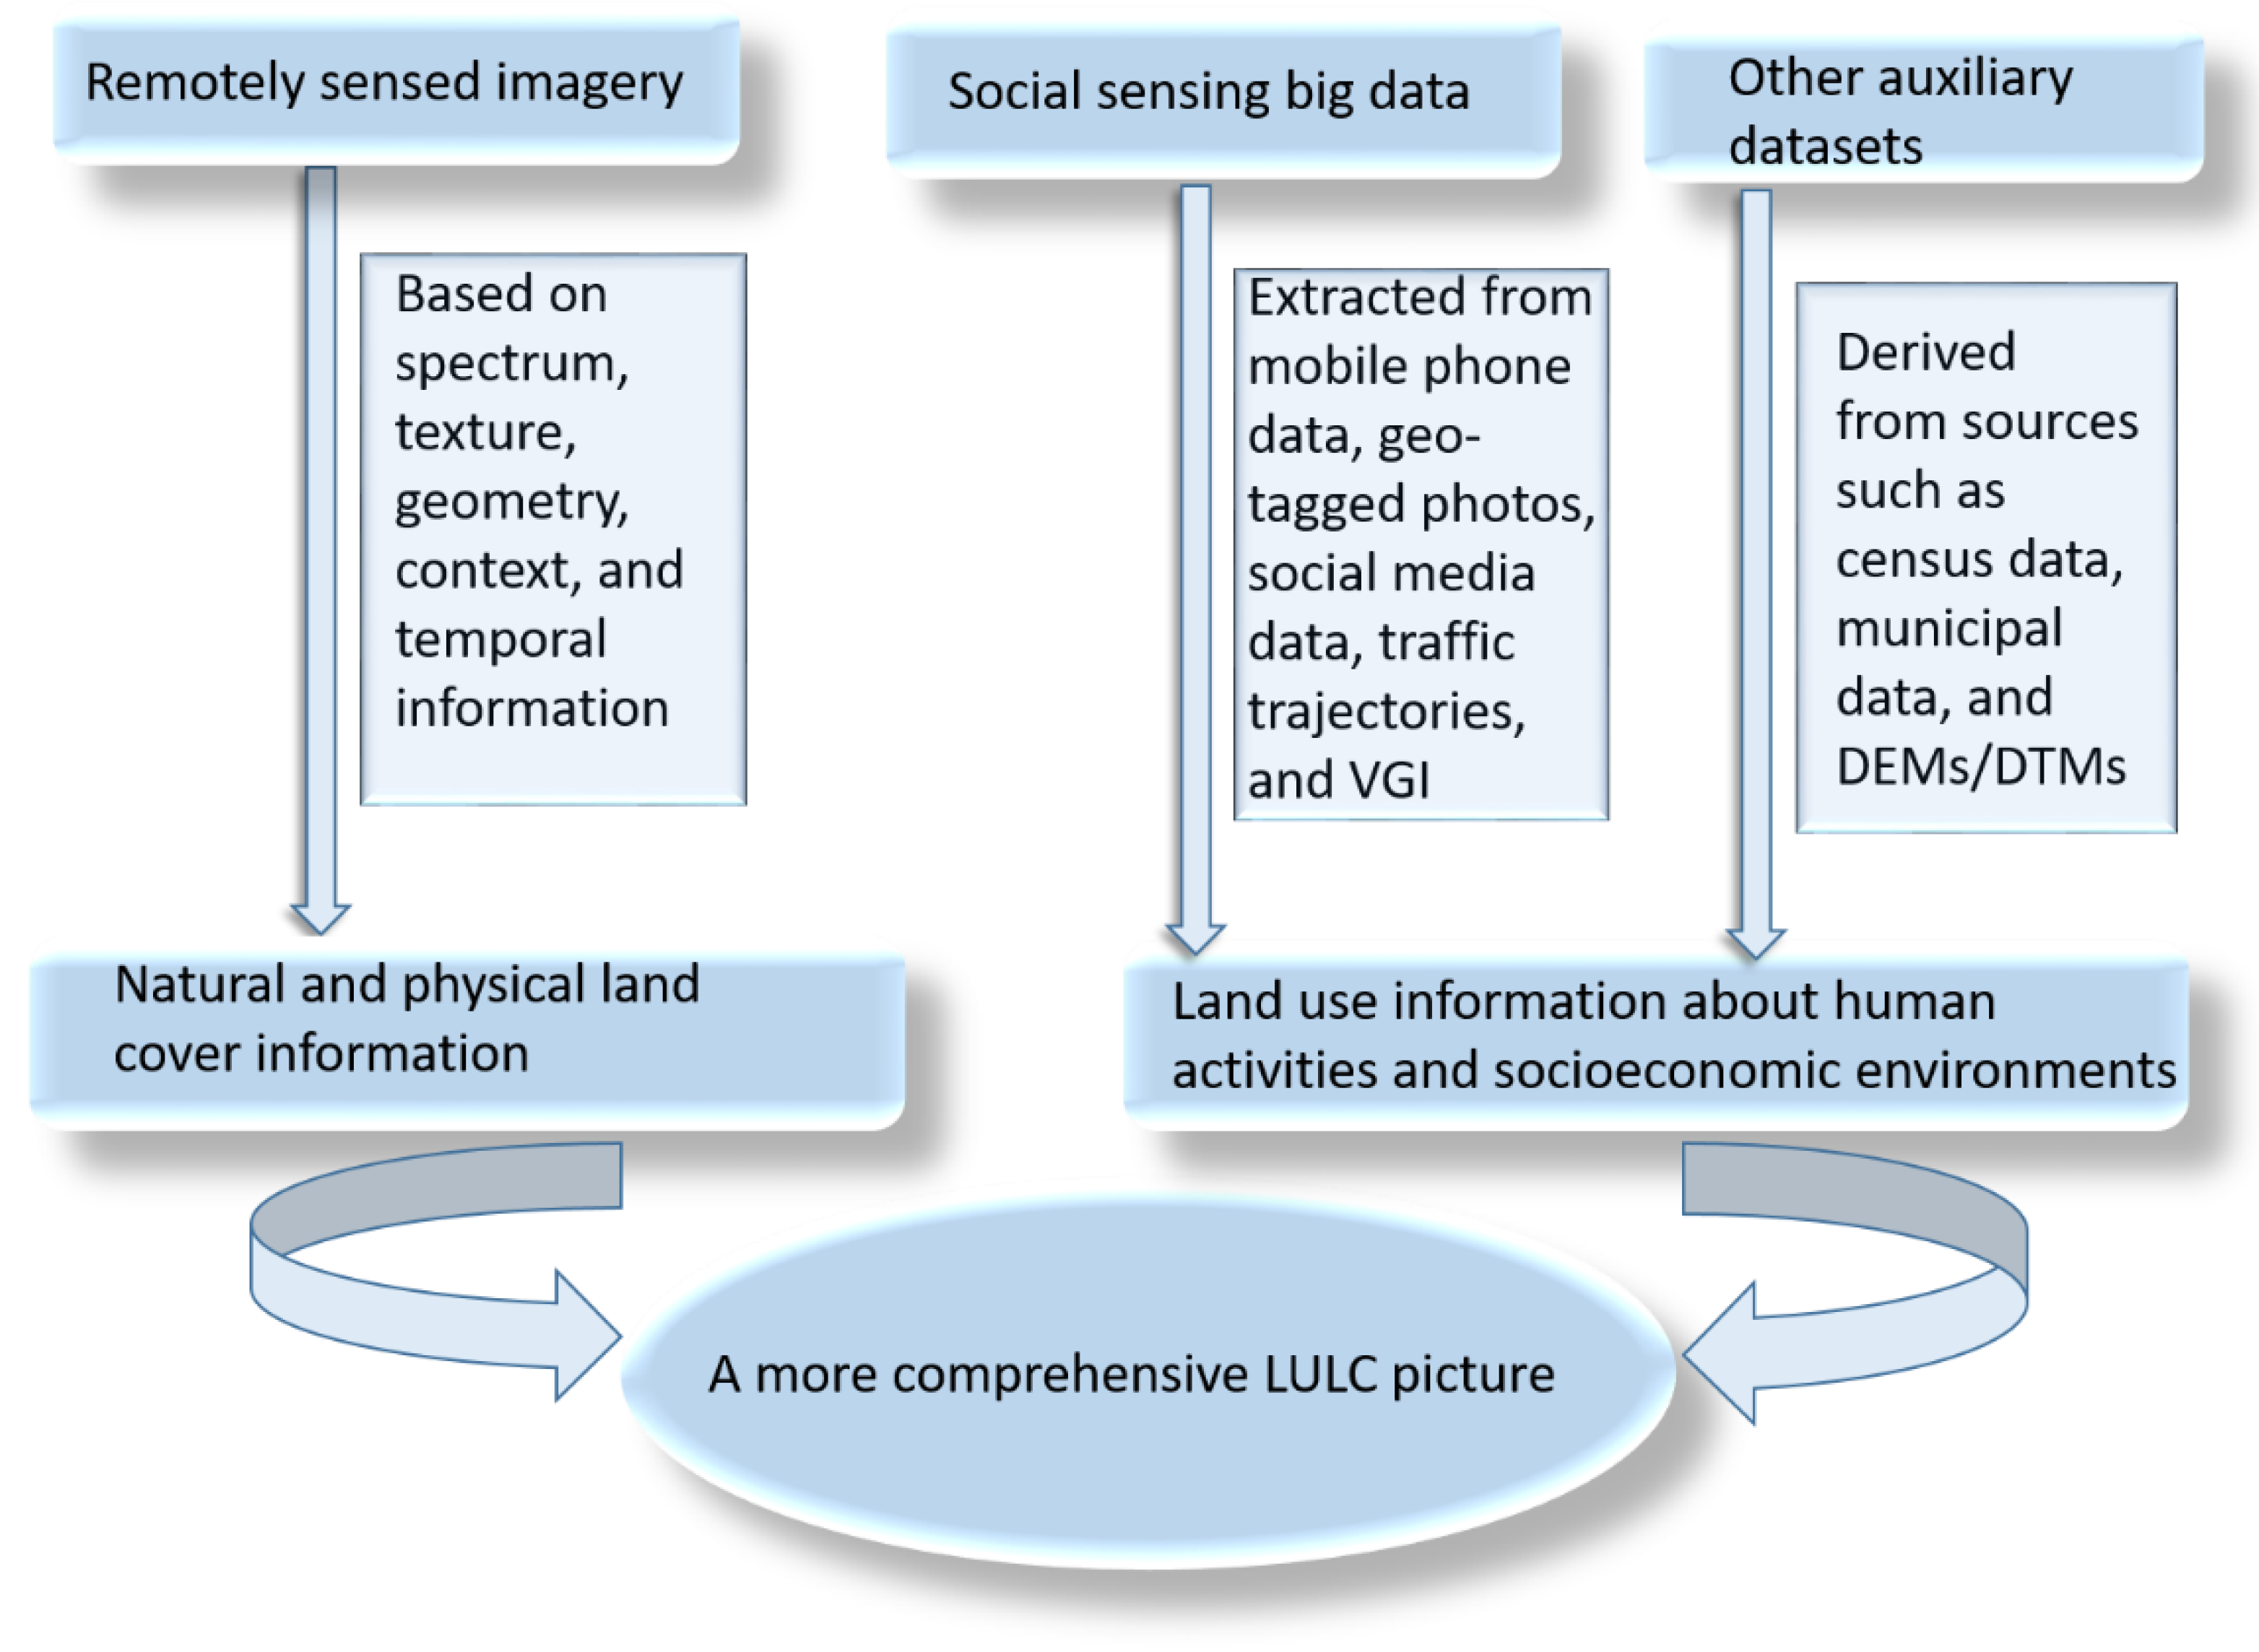
Figure 4. LULC mapping from the integration of geospatial big data and remotely sensed data.
In addition to the integration of remotely sensed data and social sensing big data for LULC mapping, other auxiliary datasets may also be used for LULC mapping [76]. For example, census data including demography, employment, education, housing, and income information may provide valuable information to reveal spatial differences in socioeconomic statures across different land use types, e.g., [24]. Municipal data such as water consumption data may offer important information to identify the socioeconomic functions of land uses and help classify mixed patterns of land uses [77]. In addition, topographic information such as elevation, slope, and aspect information extracted from digital elevation or digital terrain models (DEMs/DTMs) may also be combined with remotely sensed data to increase the accuracy of urban land use classification, e.g., [78].
Ubiquitous sensor networks can constantly obtain spatio-temporal data in days, hours, minutes, seconds, or even milliseconds. These spatio-temporal data allow people to acquire multi-dimensional dynamic information about various land entities and human activities, which may be used for making or updating LULC maps. LULC mapping is expanding from professional aspects to public aspects with the development of The Internet of Things (IoT) and Volunteered Geographic Information (VGI), as evidenced by Geo-Wiki and My Maps feature in Google Maps. However, the non-professional characteristics of IoT and VGI often make the data obtained from them contain data uncertainty such as data loss, noise, inconsistency, and ambiguity [79]. Therefore, it is important to develop quality assurance procedures such as data cleaning and quality inspection for high-quality LULC mapping.
It is still challenging to integrate multi-source remotely sensed data, social sensing big data, and other auxiliary datasets for LULC mapping because of intensive computing and the heterogeneity in spatial data structures, formats, resolutions, scales, and data quality. Novel machine learning including deep learning and cloud computing approaches are urgently needed for LULC mapping.
4. Machine Learning and Cloud Computing for LULC Mapping
Machine learning is a data analysis method and a subset of artificial intelligence based on the idea that computer systems can learn from data to identify patterns and make decisions with minimal human intervention. There are many different machine learning approaches for LULC mapping [80][81], such as support vector machine (SVM), random forest (RF), and K-nearest neighborhood (KNN). The strengths of machine learning include the capacity to handle data of high dimensionality and to map LULC classes with very complex characteristics. With growing volumes and varieties of the available aforementioned remotely sensed imagery and geospatial big data, cheaper and more powerful computational processing tools, and affordable data storage, machine learning has become more popular than ever for analyzing bigger and more complex data and delivering more accurate LULC mapping results at larger scales [10]. Machine learning provides the foundation for autonomously solving data-based LULC mapping problems [82].
Supervised learning, unsupervised learning, and semi-supervised learning are the three main types of machine learning methods for LULC mapping, as shown in Figure 5. Supervised learning algorithms are trained using labeled LULC examples and apply what has been learned in the labeled LULC example data to predict the labels of new LULC data. By inferring methods such as regression and gradient boosting, supervised learning methods use patterns to predict the values of the labels on unlabeled LULC data [83]. Popular supervised learning methods include support vector machine (SVM), random forest (RF), classification and regression tree (CART), radial basis function (RBF), decision tree (DT), multilayer perception (MLP), naive Bayes (NB), maximum likelihood classifier (MLC), and fuzzy logic. Unsupervised learning algorithms are used with data that have no historical LULC labels and computers infer a function to describe a hidden structure from unlabeled LULC data. Unsupervised learning methods are used when it is unclear what the LULC mapping results will look like and computers need to dig through hidden layers of LULC data and cluster data together based on the similarities or differences of LULC classes. Popular unsupervised learning methods include self-organizing maps, k-means clustering, nearest-neighbor mapping, affinity propagation (AP) cluster algorithm, ISODATA (iterative self-organizing data), and fuzzy c-means algorithms. Semi-supervised learning is similar to supervised learning. However, it uses both labeled and unlabeled data for training—usually a small amount of labeled data with a large amount of unlabeled data.
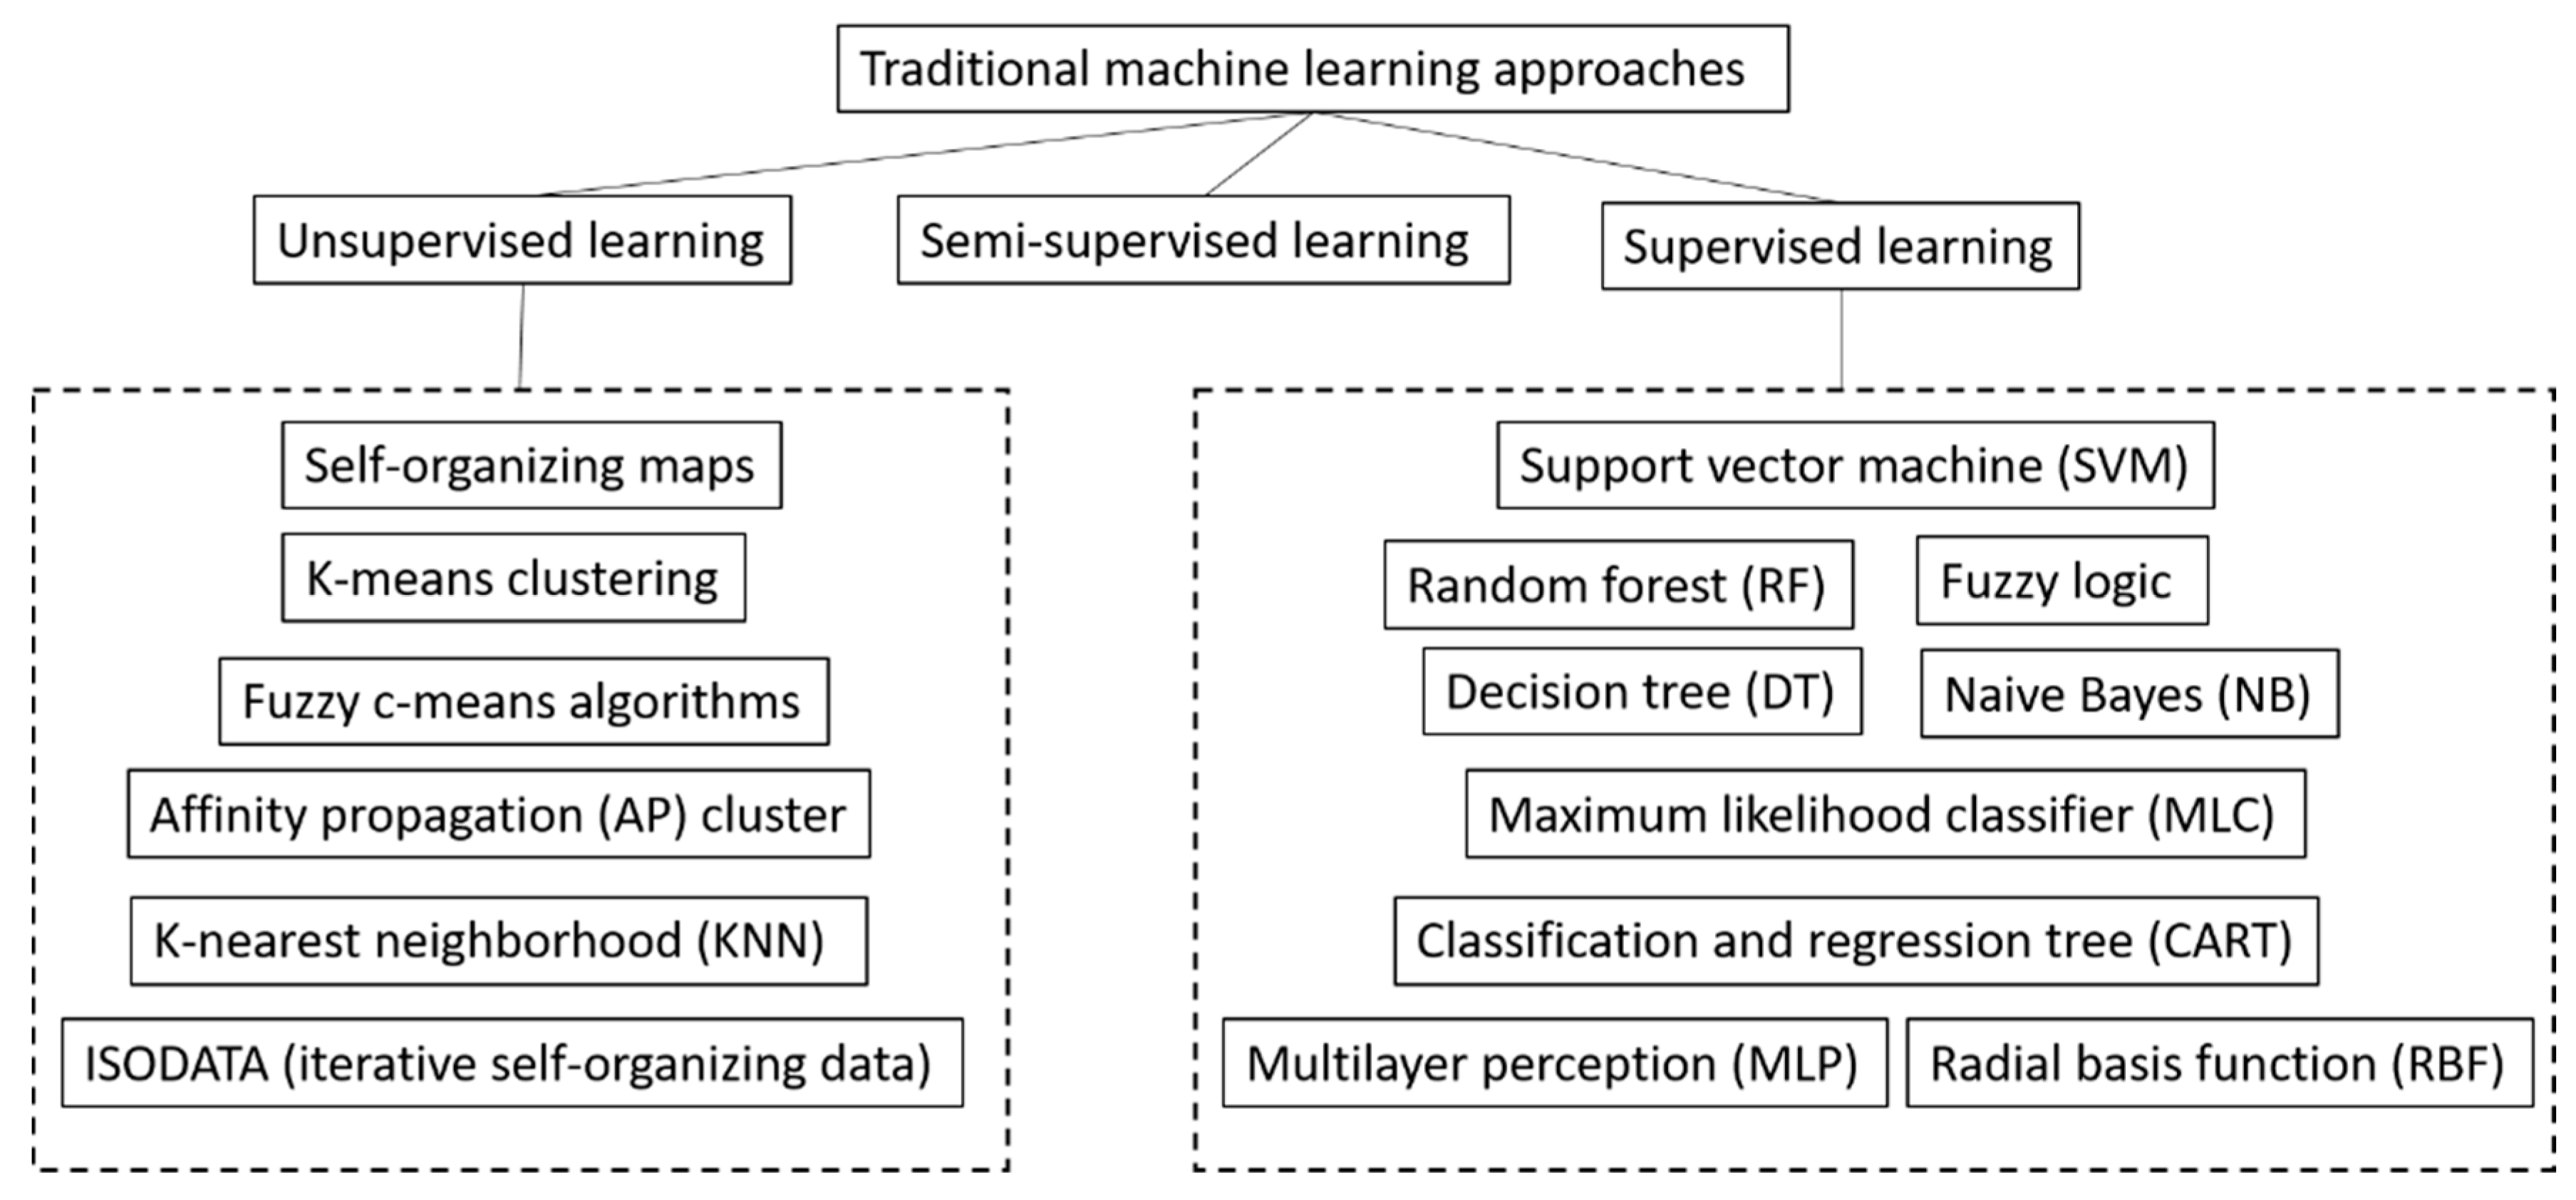
Figure 5. Types of traditional machine learning approaches for LULC mapping.
Recent advances in machine learning for LULC mapping have been accomplished via deep learning approaches [84][85]. As illustrated in Figure 6, deep learning is a subfield of machine learning. All deep learning is machine learning, but not all machine learning is deep learning. Deep learning emerged because shallow machine learning cannot successfully analyze big data for LULC mapping. While basic machine learning models do become progressively better at performing their specific functions as they take in new emergent data, they still need some human intervention. Deep learning algorithms in layers can build an “artificial neural network” (Figure 7) that is able to learn and make intelligent classification decisions on its own [86]. Figure 8 illustrates the differences between traditional machine learning and deep learning. For traditional machine learning, feature extraction and classification are separate processes and humans are needed to perform feature extraction. With a deep learning model, feature extraction is integrated with classification and a classification algorithm can determine whether a class prediction is accurate through its own neural network—beyond the training data and without requiring human help. Deep learning algorithms can be considered as a both sophisticated and mathematically complex evolution of machine learning algorithms [87]. Deep learning algorithms analyze data with a logic structure similar to how a human would draw LULC mapping conclusions. When fed training data, deep learning algorithms would eventually learn from their own errors whether a LULC class prediction is good or whether it needs to adjust.
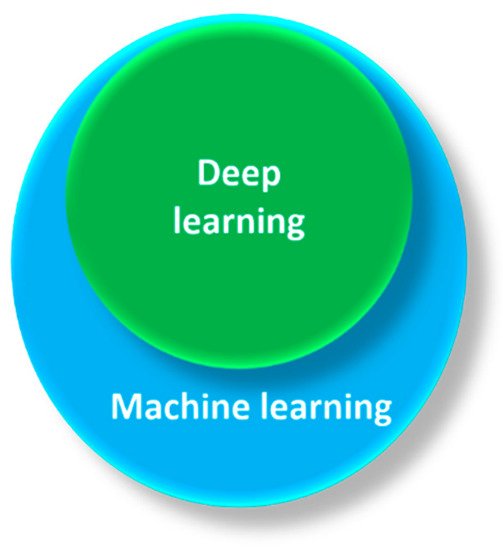
Figure 6. Deep learning is a subfield of machine learning.
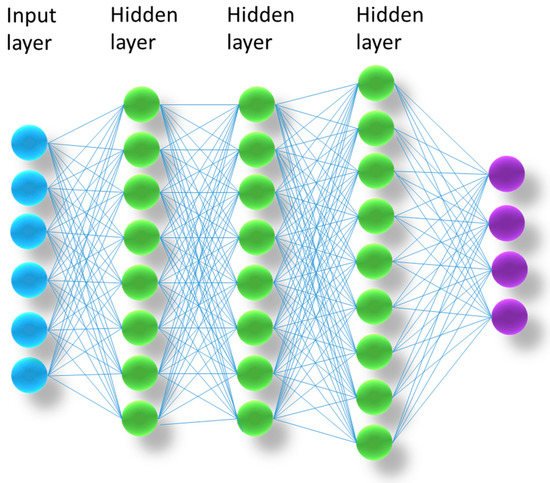
Figure 7. A simple artificial neural network.
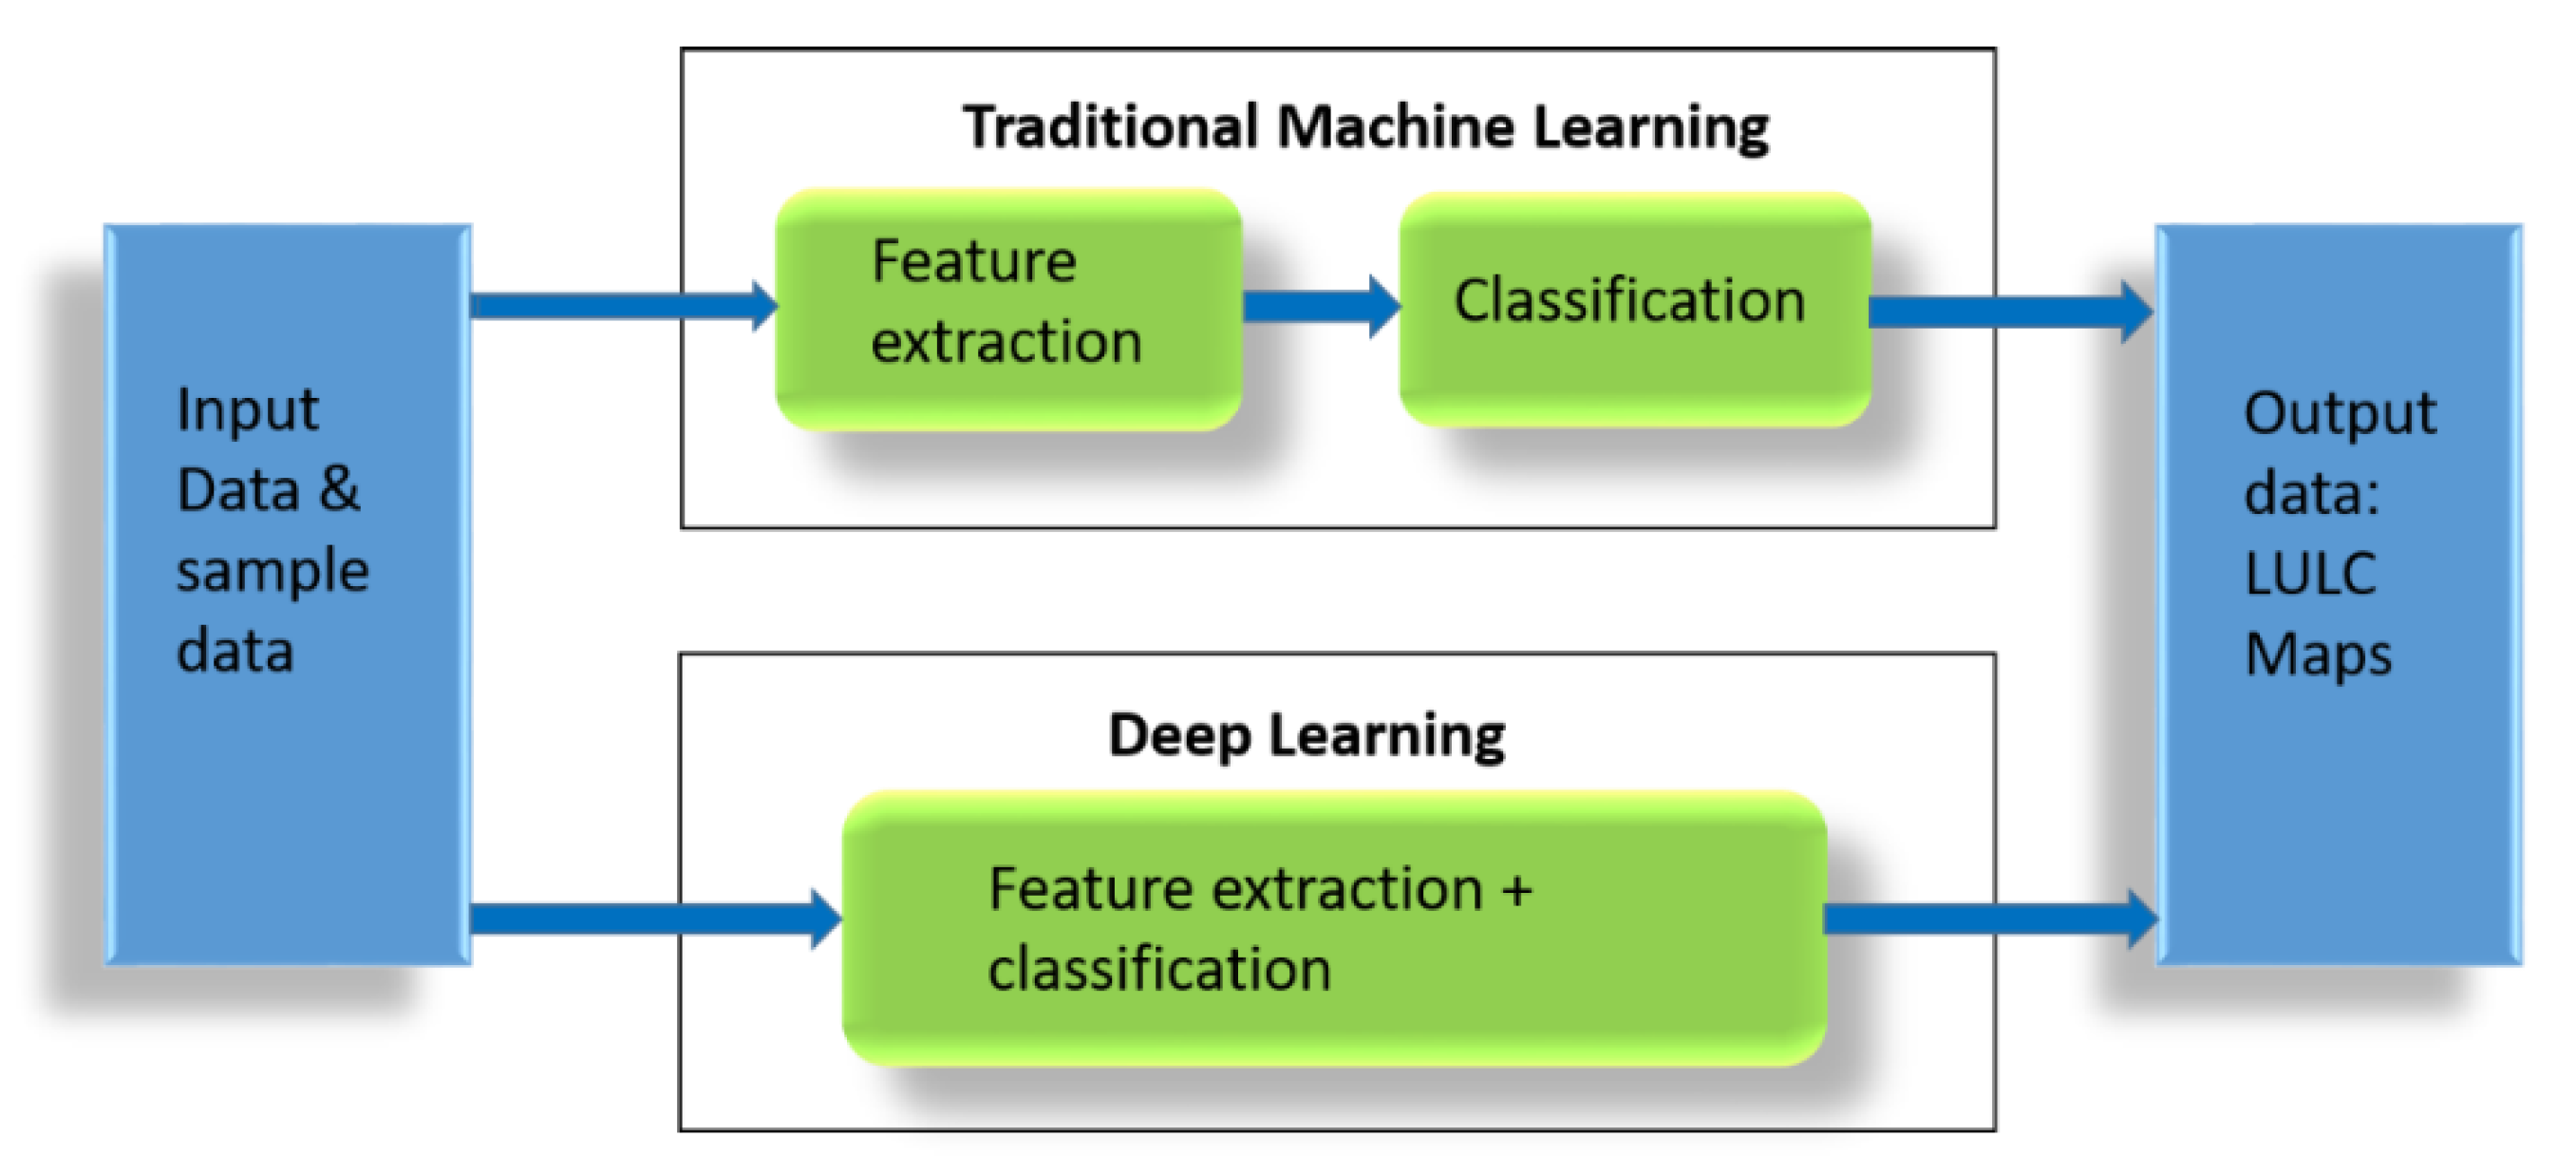
Figure 8. Differences between traditional machine learning and deep learning.
In recent studies, deep learning outperformed other machine learning algorithms in some LULC mapping problems, particularly in detecting fine-scale types such as small artificial objects [88][89][90]. Deep learning algorithms have been used to automatically extract spatial features from very-high-resolution satellite images such as IKONOS, WorldView-3, and SPOT-5, e.g., [85].
There are several different types of deep learning algorithms for LULC mapping, among which the most popular algorithms include convolutional neural networks (CNNs) and recurrent neural networks (RNNs). CNNs are some of the most popular neural network architectures because they can extract low-level features with a high-frequency spectrum, such as the edges, angles, and outlines of LULC objects, whatever the shape, size, or color of the objects are. Therefore, CNNs are well suited for LULC mapping [91]. Some popular CNN architectures used in the literature are LeNet5, AlexNet, VGGNet, CaffeNet, GoogLeNet, and ResNet models. RNNs have built-in feedback loops that allow the algorithms to “remember” past data points. RNNs can use this memory of past events to inform their understanding of current events or even predict the future. RNNs are mainly designed to process time series data and are suitable to detect LULC changes [88].
By performing complex abstractions over data through a hierarchical learning process, deep leaning algorithms have shown great potential for analyzing big datasets for LULC mapping [16]. The hidden layers in deep leaning approaches can discover class structures and patterns in big data and extract valuable class knowledge. Deep learning is also able to handle nonlinear and highly complex big data more effectively than conventional machine learning methods [84][92]. However, compared to traditional machine learning approaches, deep learning requires a vast amount of training data and substantial computing power [27]. A deep learning algorithm requires much more data than a traditional machine learning algorithm to properly conduct LULC mapping. Due to the complex multi-layer structure, a deep learning system needs a large training dataset to eliminate fluctuations and make high-quality class interpretations [92]. Without a large set of training data, deep learning may show a similar or worse performance than classical machine learning techniques such as SVM [93].
The emergence of cloud computing infrastructure and high-performance GPUs (graphic processing units, used for faster calculations) helped to solve the expensive computational problem faced by deep learning [94]. The storage and processing requirements of big data for LULC mapping are greater than that available in traditional computer systems and technologies [95]. The existing cluster-based high-performance computing (HPC) with plenty of computational capacities can be used for storing large remotely sensed data and other big data for LULC mapping. However, it is still challenging to process these big remotely sensed data and other big data for large-scale LULC mapping because system architectures and the tools of the existing cluster-based HPC have not been optimized to process such data. The cluster systems or peta-scale supercomputers are not good at loading, transferring, and processing extremely big remotely sensed data and other data for LULC mapping. A potential solution to this problem is cloud computing. Cloud computing satisfies the two main requirements of LULC mapping using big data analytics solutions: (1) scalable storage that can accommodate growing data; and (2) a high processing capability that can run complex LULC mapping tasks in a timely manner. Cloud computing makes deep learning more accessible, making it easier to manage large datasets and train algorithms for distributed hardware, and deploy them efficiently [96]. It provides access to special hardware configures, including GPUs, field-programmable gate arrays (FPGAs), TensorFlow processing units (TPUs), and massively parallel high-performance computing (HPC) systems.
Cloud computing has been used for storing big remotely sensed data and other data for LULC mapping with good scalability [97]. Three main types of cloud computing services have been used [98]: (1) infrastructure-as-a-service (IaaS), which allows renting IT infrastructures. Servers, virtual machines with storages, networks, and operating systems are completely provided and managed by a cloud provider. Users can pay for what they use; (2) platforms-as-a-service (PaaS): this service is an on-demand style of service where users can obtain a complete development environment required for software applications; (3) software-as-a-service (SaaS): using SaaS, it is possible to deliver software applications over the Internet, such as the ‘on demand’ or ‘subscription’ services.
Google AppEngine, Microsoft Azure, and Amazon EC2 are the most popular cloud providers and offer pay-as-you-go clouding computing for storing, processing, and visualizing big remotely sensed data and other data for LULC mapping. GoogleTM developed a geospatial data analysis platform—Google Earth Engine (GEE)—capable of storing and analyzing vast amounts of remotely sensed data for rapid LULC mapping at large scales [99][100]. GEE provides users with free access to numerous remotely sensed datasets including Landsat, Sentinel, and MODIS images. GEE has already proven its capacities for LULC classification and change detection, e.g., [101][102][103][104][105][106][107][108][109][110]. Microsoft Azure Cloud Services and Amazon Web Services (AWS) have also been used to improve LULC mapping and monitoring [111]. Microsoft Azure Cloud Services have established artificial intelligence (AI) for an Earth initiative to address environmental challenges. However, Azure only offers Landsat and Sentinel-2 products for North America and MODIS imagery. Amazon Web Services offer open data from more satellites such as Sentinel-1, Sentinel-2, Landsat-8, and China–Brazil Earth Resources Satellite program (CBERS-4), NOAA image datasets, as well as global model outputs.
In addition to machine learning and cloud computing approaches, other advanced cyberinfrastructure techniques, such as novel scalable parallel file systems capable of storing and managing massive data, and NoSQL (Not Only SQL) databases for managing big unstructured or non-relational data have also been developed for LULC mapping with complex characteristics [112].
References
- Treitz, P.; Rogan, J. Remote sensing for mapping and monitoring land-cover and land-use change-an introduction. Prog. Plan. 2004, 61, 269–279.
- Rogan, J.; Chen, D. Remote sensing technology for mapping and monitoring land-cover and land-use change. Prog. Plan. 2004, 61, 301–325.
- Mora, B.; Tsendbazar, N.E.; Herold, M.; Arino, O. Global land cover mapping: Current status and future trends. In Land Use and Land Cover Mapping in Europe; Manakos, I., Braun, M., Eds.; Springer: Dordrecht, The Netherland, 2014; Volume 18, pp. 11–30.
- Meyer, W.B.; Turner, B.L. Human population growth and global land-use/cover change. Annu. Rev. Ecol. Syst. 1992, 23, 39–61.
- Hasan, S.S.; Zhen, L.; Miah, M.G.; Ahamed, T.; Samie, A. Impact of land use change on ecosystem services: A review. Environ. Dev. 2020, 34, 100527.
- Nedd, R.; Light, K.; Owens, M.; James, N.; Johnson, E.; Anandhi, A. A synthesis of land use/land cover studies: Definitions, classification systems, meta-studies, challenges and knowledge gaps on a global landscape. Land 2021, 10, 994.
- Parece, T.E.; Campbell, J.B. Land use/land cover monitoring and geospatial technologies: An overview. In Advances in Watershed Science and Assessment; Younos, T., Parece, T., Eds.; Springer: Cham, Switzerland, 2015; Volume 33, pp. 1–32.
- Joshi, N.; Baumann, M.; Ehammer, A.; Fensholt, R.; Grogan, K.; Hostert, P.; Jepsen, M.R.; Kuemmerle, T.; Meyfroidt, P.; Mitchard, E.T.; et al. A review of the application of optical and radar remote sensing data fusion to land use mapping and monitoring. Remote Sens. 2016, 8, 70.
- Chen, B.; Tu, Y.; Song, Y.; Theobald, D.M.; Zhang, T.; Ren, Z.; Li, X.; Yang, J.; Wang, J.; Wang, X.; et al. Mapping essential urban land use categories with open big data: Results for five metropolitan areas in the United States of America. ISPRS J. Photogramm. Remote Sens. 2021, 178, 203–218.
- Alqurashi, A.; Kumar, L. Investigating the use of remote sensing and GIS techniques to detect land use and land cover change: A review. Adv. Remote Sens. 2013, 2, 193–204.
- Phiri, D.; Morgenroth, J. Developments in Landsat land cover classification methods: A review. Remote Sens. 2017, 9, 967.
- MohanRajan, S.N.; Loganathan, A.; Manoharan, P. Survey on Land Use/Land Cover (LU/LC) change analysis in remote sensing and GIS environment: Techniques and Challenges. Environ. Sci. Pollut. Res. 2020, 27, 29900–29926.
- Yin, J.; Dong, J.; Hamm, N.A.; Li, Z.; Wang, J.; Xing, H.; Fu, P. Integrating remote sensing and geospatial big data for urban land use mapping: A review. Int. J. Appl. Earth Obs. Geoinf. 2021, 103, 102514.
- Lee, J.G.; Kang, M. Geospatial big data: Challenges and opportunities. Big Data Res. 2015, 2, 74–81.
- Deng, X.; Liu, P.; Liu, X.; Wang, R.; Zhang, Y.; He, J.; Yao, Y. Geospatial big data: New paradigm of remote sensing applications. IEEE J. Sel. Top. Appl. Earth Obs. Remote Sens. 2019, 12, 3841–3851.
- He, J.; Li, X.; Liu, P.; Wu, X.; Zhang, J.; Zhang, D.; Liu, X.; Yao, Y. Accurate estimation of the proportion of mixed land use at the street-block level by integrating high spatial resolution images and geospatial big data. IEEE Trans. Geosci. Remote Sens. 2020, 59, 6357–6370.
- Yi, J.; Du, Y.; Liang, F.; Tu, W.; Qi, W.; Ge, Y. Mapping human’s digital footprints on the Tibetan Plateau from multi-source geospatial big data. Sci. Total Environ. 2020, 711, 134540.
- Chi, M.; Plaza, A.; Benediktsson, J.A.; Sun, Z.; Shen, J.; Zhu, Y. Big data for remote sensing: Challenges and opportunities. Proc. IEEE 2016, 104, 2207–2219.
- Shi, Y.; Qi, Z.; Liu, X.; Niu, N.; Zhang, H. Urban land use and land cover classification using multisource remote sensing images and social media data. Remote Sens. 2019, 11, 2719.
- Wulder, M.A.; Coops, N.C.; Roy, D.P.; White, J.C.; Hermosilla, T. Land cover 2.0. Int. J. Remote Sens. 2018, 39, 4254–4284.
- Saah, D.; Johnson, G.; Ashmall, B.; Tondapu, G.; Tenneson, K.; Patterson, M.; Poortinga, A.; Markert, K.; Quyen, N.H.; San Aung, K.; et al. Collect Earth: An online tool for systematic reference data collection in land cover and use applications. Environ. Model. Softw. 2019, 118, 166–171.
- Sitthi, A.; Nagai, M.; Dailey, M.; Ninsawat, S. Exploring land use and land cover of geotagged social-sensing images using naive bayes classifier. Sustainability 2016, 8, 921.
- Zhang, C.; Zhao, T.; Li, W. Geospatial Semantic Web; Springer: Berlin/Heidelberg, Germany, 2015.
- Chen, B.; Xu, B.; Gong, P. Mapping essential urban land use categories (EULUC) using geospatial big data: Progress, challenges, and opportunities. Big Earth Data 2021, 5, 410–441.
- Helber, P.; Bischke, B.; Dengel, A.; Borth, D. Eurosat: A novel dataset and deep learning benchmark for land use and land cover classification. IEEE J. Sel. Top. Appl. Earth Obs. Remote Sens. 2019, 12, 2217–2226.
- Nijhawan, R.; Joshi, D.; Narang, N.; Mittal, A.; Mittal, A. A futuristic deep learning framework approach for land use-land cover classification using remote sensing imagery. In Advanced Computing and Communication Technologies; Springer: Singapore, 2019; pp. 87–96.
- Jozdani, S.E.; Johnson, B.A.; Chen, D. Comparing deep neural networks, ensemble classifiers, and support vector machine algorithms for object-based urban land use/land cover classification. Remote Sens. 2019, 11, 1713.
- Li, W.; Fu, H.; Yu, L.; Gong, P.; Feng, D.; Li, C.; Clinton, N. Stacked Autoencoder-based deep learning for remote-sensing image classification: A case study of African land-cover mapping. Int. J. Remote Sens. 2016, 37, 5632–5646.
- Bartsch, A.; Höfler, A.; Kroisleitner, C.; Trofaier, A.M. Land cover mapping in northern high latitude permafrost regions with satellite data: Achievements and remaining challenges. Remote Sens. 2016, 8, 979.
- Thyagharajan, K.K.; Vignesh, T. Soft computing techniques for land use and land cover monitoring with multispectral remote sensing images: A review. Arch. Comput. Methods Eng. 2019, 26, 275–301.
- Comber, A.; Wulder, M. Considering spatiotemporal processes in big data analysis: Insights from remote sensing of land cover and land use. Trans. GIS 2019, 23, 879–891.
- Liu, P.; Di, L.; Du, Q.; Wang, L. Remote sensing big data: Theory, methods and applications. Remote Sens. 2018, 10, 711.
- Sugumaran, R.; Hegeman, J.W.; Sardeshmukh, V.B.; Armstrong, M.P. Processing remote-sensing data in cloud computing environments. In Remotely Sensed Data Characterization, Classification, and Accuracies; CRC Press: Boca Raton, FL, USA, 2015; pp. 587–596.
- Feng, M.; Li, X. Land cover mapping toward finer scales. Sci. Bull. 2020, 65, 1604–1606.
- Franklin, S.E.; He, Y.; Pape, A.; Guo, X.; McDermid, G.J. Landsat-comparable land cover maps using ASTER and SPOT images: A case study for large-area mapping programmes. Int. J. Remote Sens. 2011, 32, 2185–2205.
- Alphan, H.; Doygun, H.; Unlukaplan, Y.I. Post-classification comparison of land cover using multitemporal Landsat and ASTER imagery: The case of Kahramanmaraş, Turkey. Environ. Monit. Assess. 2009, 151, 327–336.
- de Pinho, C.M.D.; Fonseca, L.M.G.; Korting, T.S.; De Almeida, C.M.; Kux, H.J.H. Land-cover classification of an intra-urban environment using high-resolution images and object-based image analysis. Int. J. Remote Sens. 2012, 33, 5973–5995.
- Novack, T.; Esch, T.; Kux, H.; Stilla, U. Machine learning comparison between WorldView-2 and QuickBird-2-simulated imagery regarding object-based urban land cover classification. Remote Sens. 2011, 3, 2263–2282.
- Toure, S.I.; Stow, D.A.; Shih, H.C.; Weeks, J.; Lopez-Carr, D. Land cover and land use change analysis using multi-spatial resolution data and object-based image analysis. Remote Sens. Environ. 2018, 210, 259–268.
- Malinverni, E.S.; Tassetti, A.N.; Mancini, A.; Zingaretti, P.; Frontoni, E.; Bernardini, A. Hybrid object-based approach for land use/land cover mapping using high spatial resolution imagery. Int. J. Geogr. Inf. Sci. 2011, 25, 1025–1043.
- Ghamisi, P.; Yokoya, N.; Li, J.; Liao, W.; Liu, S.; Plaza, J.; Rasti, B.; Plaza, A. Advances in hyperspectral image and signal processing: A comprehensive overview of the state of the art. IEEE Geosci. Remote Sens. Mag. 2017, 5, 37–78.
- Qi, Z.; Yeh, A.G.O.; Li, X.; Lin, Z. A novel algorithm for land use and land cover classification using RADARSAT-2 polarimetric SAR data. Remote Sens. Environ. 2012, 118, 21–39.
- Lv, Q.; Dou, Y.; Niu, X.; Xu, J.; Xu, J.; Xia, F. Urban land use and land cover classification using remotely sensed SAR data through deep belief networks. J. Sens. 2015, 2015, 538063.
- Zhang, R.; Tang, X.; You, S.; Duan, K.; Xiang, H.; Luo, H. A novel feature-level fusion framework using optical and SAR remote sensing images for land use/land cover (LULC) classification in cloudy mountainous area. Appl. Sci. 2020, 10, 2928.
- Teeuw, R.M.; Leidig, M.; Saunders, C.; Morris, N. Free or low-cost geoinformatics for disaster management: Uses and availability issues. Environ. Hazards 2013, 12, 112–131.
- Navin, M.S.; Agilandeeswari, L. Comprehensive review on land use/land cover change classification in remote sensing. J. Spectr. Imaging 2020, 9, a8.
- Pandey, P.C.; Koutsias, N.; Petropoulos, G.P.; Srivastava, P.K.; Ben Dor, E. Land use/land cover in view of earth observation: Data sources, input dimensions, and classifiers—A review of the state of the art. Geocarto Int. 2021, 36, 957–988.
- Hasan, S.; Shi, W.; Zhu, X.; Abbas, S. Monitoring of land use/land cover and socioeconomic changes in south china over the last three decades using landsat and nighttime light data. Remote Sens. 2019, 11, 1658.
- Zhang, Q.; Seto, K.C. Mapping urbanization dynamics at regional and global scales using multi-temporal DMSP/OLS nighttime light data. Remote Sens. Environ. 2011, 115, 2320–2329.
- Yan, W.Y.; Shaker, A.; El-Ashmawy, N. Urban land cover classification using airborne LiDAR data: A review. Remote Sens. Environ. 2015, 158, 295–310.
- Antonarakis, A.S.; Richards, K.S.; Brasington, J. Object-based land cover classification using airborne LiDAR. Remote Sens. Environ. 2008, 112, 2988–2998.
- Li, X.; Zhang, C.; Li, W. Building block level urban land-use information retrieval based on Google Street View images. GIScience Remote Sens. 2017, 54, 819–835.
- Zhang, W.; Li, W.; Zhang, C.; Hanink, D.M.; Li, X.; Wang, W. Parcel feature data derived from Google Street View images for urban land use classification in Brooklyn, New York City. Data Brief 2017, 12, 175–179.
- Li, X.; Zhang, C.; Li, W.; Ricard, R.; Meng, Q.; Zhang, W. Assessing street-level urban greenery using Google Street View and a modified green view index. Urban For. Urban Green. 2015, 14, 675–685.
- Zhang, W.; Li, W.; Zhang, C.; Hanink, D.M.; Li, X.; Wang, W. Parcel-based urban land use classification in megacity using airborne LiDAR, high resolution orthoimagery, and Google Street View. Comput. Environ. Urban Syst. 2017, 64, 215–228.
- Ma, L.; Fu, T.; Blaschke, T.; Li, M.; Tiede, D.; Zhou, Z.; Ma, X.; Chen, D. Evaluation of feature selection methods for object-based land cover mapping of unmanned aerial vehicle imagery using random forest and support vector machine classifiers. ISPRS Int. J. Geo-Inf. 2017, 6, 51.
- Ahmed, O.S.; Shemrock, A.; Chabot, D.; Dillon, C.; Williams, G.; Wasson, R.; Franklin, S.E. Hierarchical land cover and vegetation classification using multispectral data acquired from an unmanned aerial vehicle. Int. J. Remote Sens. 2017, 38, 2037–2052.
- Talukdar, S.; Singha, P.; Mahato, S.; Pal, S.; Liou, Y.A.; Rahman, A. Land-use land-cover classification by machine learning classifiers for satellite observations—A review. Remote Sens. 2020, 12, 1135.
- Green, K.; Kempka, D.; Lackey, L. Using remote sensing to detect and monitor land-cover and land-use change. Photogramm. Eng. Remote Sens. 1994, 60, 331–337.
- Wu, H.; Gui, Z.; Yang, Z. Geospatial big data for urban planning and urban management. Geo-Spat. Inf. Sci. 2020, 23, 273–274.
- Huang, B.; Wang, J. Big spatial data for urban and environmental sustainability. Geo-Spat. Inf. Sci. 2020, 23, 125–140.
- See, L.; Schepaschenko, D.; Lesiv, M.; McCallum, I.; Fritz, S.; Comber, A.; Perger, C.; Schill, C.; Zhao, Y.; Maus, V.; et al. Building a hybrid land cover map with crowdsourcing and geographically weighted regression. ISPRS J. Photogramm. Remote Sens. 2015, 103, 48–56.
- Fritz, S.; See, L.; Perger, C.; McCallum, I.; Schill, C.; Schepaschenko, D.; Duerauer, M.; Karner, M.; Dresel, C.; Laso-Bayas, J.C.; et al. A global dataset of crowdsourced land cover and land use reference data. Sci. Data 2017, 4, 170075.
- Johnson, B.A.; Iizuka, K. Integrating OpenStreetMap crowdsourced data and Landsat time-series imagery for rapid land use/land cover (LULC) mapping: Case study of the Laguna de Bay area of the Philippines. Appl. Geogr. 2016, 67, 140–149.
- Fonte, C.C.; Minghini, M.; Patriarca, J.; Antoniou, V.; See, L.; Skopeliti, A. Generating up-to-date and detailed land use and land cover maps using OpenStreetMap and GlobeLand30. ISPRS Int. J. Geo-Inf. 2017, 6, 125.
- Andrade, R.; Alves, A.; Bento, C. POI mining for land use classification: A case study. ISPRS Int. J. Geo-Inf. 2020, 9, 493.
- Vargas-Munoz, J.E.; Srivastava, S.; Tuia, D.; Falcao, A.X. OpenStreetMap: Challenges and opportunities in machine learning and remote sensing. IEEE Geosci. Remote Sens. Mag. 2020, 9, 184–199.
- Wu, H.; Lin, A.; Xing, X.; Song, D.; Li, Y. Identifying core driving factors of urban land use change from global land cover products and POI data using the random forest method. Int. J. Appl. Earth Obs. Geoinf. 2021, 103, 102475.
- Ai, T.; Yang, W. The detection of transport land-use data using crowdsourcing taxi trajectory. In Proceedings of the International Archives of the Photogrammetry, Remote Sensing and Spatial Information Sciences, Prague, Czech Republic, 12–19 July 2016; pp. 785–788.
- Liu, W.; Wu, W.; Thakuriah, P.; Wang, J. The geography of human activity and land use: A big data approach. Cities 2020, 97, 102523.
- Schultz, M.; Voss, J.; Auer, M.; Carter, S.; Zipf, A. Open land cover from OpenStreetMap and remote sensing. Int. J. Appl. Earth Obs. Geoinf. 2017, 63, 206–213.
- Xing, J.; Sieber, R.E. A land use/land cover change geospatial cyberinfrastructure to integrate big data and temporal topology. Int. J. Geogr. Inf. Sci. 2016, 30, 573–593.
- Yang, D.; Fu, C.S.; Smith, A.C.; Yu, Q. Open land-use map: A regional land-use mapping strategy for incorporating OpenStreetMap with earth observations. Geo-Spat. Inf. Sci. 2017, 20, 269–281.
- Hu, T.; Yang, J.; Li, X.; Gong, P. Mapping urban land use by using landsat images and open social data. Remote Sens. 2016, 8, 151.
- Yin, J.; Fu, P.; Hamm, N.A.; Li, Z.; You, N.; He, Y.; Cheshmehzangi, A.; Dong, J. Decision-level and feature-level integration of remote sensing and geospatial big data for urban land use mapping. Remote Sens. 2021, 13, 1579.
- Copenhaver, K.L. Combining Tabular and Satellite-Based Datasets to Better Understand Cropland Change. Land 2022, 11, 714.
- Guan, Q.; Cheng, S.; Pan, Y.; Yao, Y.; Zeng, W. Sensing mixed urban land-use patterns using municipal water consumption time series. Ann. Am. Assoc. Geogr. 2021, 111, 68–86.
- Chen, B.; Huang, B.; Xu, B. Multi-source remotely sensed data fusion for improving land cover classification. ISPRS J. Photogramm. Remote Sens. 2017, 124, 27–39.
- Haklay, M. Citizen science and volunteered geographic information: Overview and typology of participation. In Crowdsourcing Geographic Knowledge; Sui, D., Elwood, S., Goodchild, M., Eds.; Springer: Dordrecht, The Netherland, 2013; pp. 105–122.
- Laban, N.; Abdellatif, B.; Ebeid, H.M.; Shedeed, H.A.; Tolba, M.F. Machine Learning for Enhancement Land Cover and Crop Types Classification. In Machine Learning Paradigms: Theory and Application; Springer: Cham, Switzerland, 2019; pp. 71–87.
- Kuras, A.; Brell, M.; Rizzi, J.; Burud, I. Hyperspectral and lidar data applied to the urban land cover machine learning and neural-network-based classification: A review. Remote Sens. 2021, 13, 3393.
- Jamali, A. Land use land cover mapping using advanced machine learning classifiers: A case study of Shiraz city, Iran. Earth Sci. Inform. 2020, 13, 1015–1030.
- Schmitt, M.; Prexl, J.; Ebel, P.; Liebel, L.; Zhu, X.X. Weakly supervised semantic segmentation of satellite images for land cover mapping—Challenges and opportunities. arXiv 2020, arXiv:2002.08254.
- Kussul, N.; Shelestov, A.; Lavreniuk, M.; Butko, I.; Skakun, S. Deep learning approach for large scale land cover mapping based on remote sensing data fusion. In Proceedings of the 2016 IEEE International Geoscience and Remote Sensing Symposium (IGARSS), Beijing, China, 10–15 July 2016; pp. 198–201.
- Zhang, P.; Ke, Y.; Zhang, Z.; Wang, M.; Li, P.; Zhang, S. Urban land use and land cover classification using novel deep learning models based on high spatial resolution satellite imagery. Sensors 2018, 18, 3717.
- Storie, C.D.; Henry, C.J. Deep learning neural networks for land use land cover mapping. In Proceedings of the IGARSS 2018-2018 IEEE International Geoscience and Remote Sensing Symposium, Valencia, Spain, 22–27 July 2018; pp. 3445–3448.
- Srivastava, S.; Vargas-Munoz, J.E.; Tuia, D. Understanding urban landuse from the above and ground perspectives: A deep learning, multimodal solution. Remote Sens. Environ. 2019, 228, 129–143.
- Alem, A.; Kumar, S. Deep learning methods for land cover and land use classification in remote sensing: A review. In Proceedings of the 2020 8th International Conference on Reliability 2020, Infocom Technologies and Optimization (Trends and Future Directions) (ICRITO), Noida, India, 4–5 June 2020; pp. 903–908.
- Feizizadeh, B.; Mohammadzade Alajujeh, K.; Lakes, T.; Blaschke, T.; Omarzadeh, D. A comparison of the integrated fuzzy object-based deep learning approach and three machine learning techniques for land use/cover change monitoring and environmental impacts assessment. GIScience Remote Sens. 2021, 58, 1543–1570.
- Digra, M.; Dhir, R.; Sharma, N. Land use land cover classification of remote sensing images based on the deep learning approaches: A statistical analysis and review. Arab. J. Geosci. 2022, 15, 1003.
- Bhosle, K.; Musande, V. Evaluation of deep learning CNN model for land use land cover classification and crop identification using hyperspectral remote sensing images. J. Indian Soc. Remote Sens. 2019, 47, 1949–1958.
- Vali, A.; Comai, S.; Matteucci, M. Deep learning for land use and land cover classification based on hyperspectral and multispectral earth observation data: A review. Remote Sens. 2020, 12, 2495.
- Abdi, A.M. Land cover and land use classification performance of machine learning algorithms in a boreal landscape using Sentinel-2 data. GIScience Remote Sens. 2020, 57, 1–20.
- Amani, M.; Ghorbanian, A.; Ahmadi, S.A.; Kakooei, M.; Moghimi, A.; Mirmazloumi, S.M.; Moghaddam, S.H.; Mahdavi, S.; Ghahremanloo, M.; Parsian, S.; et al. Google earth engine cloud computing platform for remote sensing big data applications: A comprehensive review. IEEE J. Sel. Top. Appl. Earth Obs. Remote Sens. 2020, 13, 5326–5350.
- Kang, X.; Liu, J.; Dong, C.; Xu, S. Using high-performance computing to address the challenge of land use/land cover change analysis on spatial big data. ISPRS Int. J. Geo-Inf. 2018, 7, 273.
- Karra, K.; Kontgis, C.; Statman-Weil, Z.; Mazzariello, J.C.; Mathis, M.; Brumby, S.P. Global land use/land cover with Sentinel 2 and deep learning. In Proceedings of the 2021 IEEE International Geoscience and Remote Sensing Symposium IGARSS, Brussels, Belgium, 11–16 July 2021; pp. 4704–4707.
- de Sousa, C.; Fatoyinbo, L.; Neigh, C.; Boucka, F.; Angoue, V.; Larsen, T. Cloud-computing and machine learning in support of country-level land cover and ecosystem extent mapping in Liberia and Gabon. PLoS ONE 2020, 15, e0227438.
- Yang, C.; Yu, M.; Hu, F.; Jiang, Y.; Li, Y. Utilizing cloud computing to address big geospatial data challenges. Comput. Environ. Urban Syst. 2017, 61, 120–128.
- Dubertret, F.; Le Tourneau, F.M.; Villarreal, M.L.; Norman, L.M. Monitoring Annual Land Use/Land Cover Change in the Tucson Metropolitan Area with Google Earth Engine (1986–2020). Remote Sens. 2022, 14, 2127.
- Mou, X.; Li, H.; Huang, C.; Liu, Q.; Liu, G. Application progress of Google Earth Engine in land use and land cover remote sensing information extraction. Remote Sens. Land Resour. 2021, 33, 1–10.
- Phan, T.N.; Kuch, V.; Lehnert, L.W. Land Cover Classification using Google Earth Engine and Random Forest Classifier—The Role of Image Composition. Remote Sens. 2020, 12, 2411.
- Gorelick, N.; Hancher, M.; Dixon, M.; Ilyushchenko, S.; Thau, D.; Moore, R. Google Earth Engine: Planetary-scale geospatial analysis for everyone. Remote Sens. Environ. 2017, 202, 18–27.
- Xie, S.; Liu, L.; Zhang, X.; Yang, J.; Chen, X.; Gao, Y. Automatic land-cover mapping using landsat time-series data based on google earth engine. Remote Sens. 2019, 11, 3023.
- Xia, H.; Zhao, J.; Qin, Y.; Yang, J.; Cui, Y.; Song, H.; Ma, L.; Jin, N.; Meng, Q. Changes in water surface area during 1989–2017 in the Huai River Basin using Landsat data and Google earth engine. Remote Sens. 2019, 11, 1824.
- Kumar, L.; Mutanga, O. Google Earth Engine applications since inception: Usage, trends, and potential. Remote Sens. 2018, 10, 1509.
- Wang, L.; Diao, C.; Xian, G.; Yin, D.; Lu, Y.; Zou, S.; Erickson, T.A. A summary of the special issue on remote sensing of land change science with Google earth engine. Remote Sens. Environ. 2020, 248, 112002.
- Liu, X.; Hu, G.; Chen, Y.; Li, X.; Xu, X.; Li, S.; Pei, F.; Wang, S. High-resolution multi-temporal mapping of global urban land using Landsat images based on the Google Earth Engine Platform. Remote Sens. Environ. 2018, 209, 227–239.
- Zhang, X.; Liu, L.; Wu, C.; Chen, X.; Gao, Y.; Xie, S.; Zhang, B. Development of a global 30 m impervious surface map using multisource and multitemporal remote sensing datasets with the Google Earth Engine platform. Earth Syst. Sci. Data 2020, 12, 1625–1648.
- Tang, Z.; Li, Y.; Gu, Y.; Jiang, W.; Xue, Y.; Hu, Q.; LaGrange, T.; Bishop, A.; Drahota, J.; Li, R. Assessing Nebraska playa wetland inundation status during 1985–2015 using Landsat data and Google Earth Engine. Environ. Monit. Assess. 2016, 188, 654.
- Floreano, I.X.; de Moraes, L.A.F. Land use/land cover (LULC) analysis (2009–2019) with Google Earth Engine and 2030 prediction using Markov-CA in the Rondônia State, Brazil. Environ. Monit. Assess. 2021, 193, 239.
- Ferreira, K.R.; Queiroz, G.R.; Camara, G.; Souza, R.C.; Vinhas, L.; Marujo, R.F.; Simoes, R.E.; Noronha, C.A.; Costa, R.W.; Arcanjo, J.S.; et al. Using remote sensing images and cloud services on AWS to improve land use and cover monitoring. In Proceedings of the 2020 IEEE Latin American GRSS & ISPRS Remote Sensing Conference (LAGIRS), Santiago, Chile, 22–26 March 2020; pp. 558–562.
- Tran, B.H.; Aussenac-Gilles, N.; Comparot, C.; Trojahn, C. Semantic integration of raster data for earth observation: An RDF dataset of territorial unit versions with their land cover. ISPRS Int. J. Geo-Inf. 2020, 9, 503.
More
Information
Subjects:
Environmental Sciences
Contributors
MDPI registered users' name will be linked to their SciProfiles pages. To register with us, please refer to https://encyclopedia.pub/register
:
View Times:
4.5K
Entry Collection:
Environmental Sciences
Revisions:
2 times
(View History)
Update Date:
17 Oct 2022
Table of Contents


Notice
You are not a member of the advisory board for this topic. If you want to update advisory board member profile, please contact office@encyclopedia.pub.
OK
Confirm
Only members of the Encyclopedia advisory board for this topic are allowed to note entries. Would you like to become an advisory board member of the Encyclopedia?
Yes
No
${ textCharacter }/${ maxCharacter }
Submit
Cancel
Back
Comments
${ item }
|
${ item.createdUser.fullName }
${ item.createdAt }
${ item.vote }
${ item.reply }
Delete
${ reply.createdUser.fullName }
${ reply.createdAt }
${ reply.vote }
Delete
There is no reply to this comment~
${ item.replyTextCharacter }/${ item.replyMaxCharacter }
Submit
Cancel
More
No more~
There is no comment~
${ textCharacter }/${ maxCharacter }
Submit
Cancel
${ selectedItem.replyTextCharacter }/${ selectedItem.replyMaxCharacter }
Submit
Cancel
Confirm
Are you sure to Delete?
Yes
No