Your browser does not fully support modern features. Please upgrade for a smoother experience.
Submitted Successfully!
 +1 credit
Thank you for your contribution! You can also upload a video entry or images related to this topic.
For video creation, please contact our Academic Video Service.
| Version | Summary | Created by | Modification | Content Size | Created at | Operation |
|---|---|---|---|---|---|---|
| 1 | Vsevolod Yu. Prokofiev | -- | 2493 | 2022-04-30 23:28:42 | | | |
| 2 | Vivi Li | + 291 word(s) | 2784 | 2022-05-05 04:31:22 | | |
Video Upload Options
We provide professional Academic Video Service to translate complex research into visually appealing presentations. Would you like to try it?
Cite
If you have any further questions, please contact Encyclopedia Editorial Office.
Prokofiev, V.; , . Mineralizing Fluids at Porphyry Deposits of Cu−Mo−Au System. Encyclopedia. Available online: https://encyclopedia.pub/entry/22544 (accessed on 18 June 2026).
Prokofiev V, . Mineralizing Fluids at Porphyry Deposits of Cu−Mo−Au System. Encyclopedia. Available at: https://encyclopedia.pub/entry/22544. Accessed June 18, 2026.
Prokofiev, Vsevolod, . "Mineralizing Fluids at Porphyry Deposits of Cu−Mo−Au System" Encyclopedia, https://encyclopedia.pub/entry/22544 (accessed June 18, 2026).
Prokofiev, V., & , . (2022, April 30). Mineralizing Fluids at Porphyry Deposits of Cu−Mo−Au System. In Encyclopedia. https://encyclopedia.pub/entry/22544
Prokofiev, Vsevolod and . "Mineralizing Fluids at Porphyry Deposits of Cu−Mo−Au System." Encyclopedia. Web. 30 April, 2022.
Copy Citation
The porphyry type of hydrothermal mineral deposits is of paramount economic importance because deposits of this type host much of the world’s reserves of Cu, Mo, and Re, as well as much Re and remarkable reserves of critical elements such as Ag, Pd, Te, Se, Bi, Zn, and Pb. Porphyry deposits are conventionally classified into mineralogical–geochemical types according to their dominant valuable components. The most economically important porphyry-type deposits are those of the Cu (Au), Cu–Mo (Au), Mo, and Au types.
porphyry deposits
copper
molybdenum
gold
fluid inclusions
1. Introduction
The porphyry type of hydrothermal mineral deposits is of paramount economic importance because deposits of this type host much of the world’s reserves of Cu, Mo, and Re, as well as much Re and remarkable reserves of critical elements such as Ag, Pd, Te, Se, Bi, Zn, and Pb (e.g., [1][2][3][4]). Porphyry deposits are conventionally classified into mineralogical–geochemical types according to their dominant valuable components, e.g., [3]. The most economically important porphyry-type deposits are those of the Cu (Au), Cu–Mo (Au), Mo, and Au types.
Porphyry deposits have been studied for a long time, and their features have been much discussed in many reviews, e.g., [5]. Detailed reviews were published on the geology and geotectonic settings of porphyry deposits, zoning of the wall-rock metasomatites, and spatiotemporal relations between the ore mineralization and magmatism in porphyry systems, e.g., [3][4][6][7][8][9].
Porphyry deposits contain large reserves of ores with low Cu, Mo, and Au concentrations and are genetically linked to the emplacements and crystallization of melts ranging from diorite to granite in composition. Magma bodies that generate porphyry mineralization are usually constrained to plate margins, e.g., [1][2][3][4][7][8]. Porphyry deposits are usually zonal [10] and are stockworks of disseminated and stringer accumulations of sulfides and oxides hosted in large (up to 10 km3) volumes of hydrothermally altered rocks, which were produced by the large-scale circulation of hydrothermal fluids at upper crustal levels [2][3][4][11][12][13][14]. Porphyry deposits were found in continental magmatic belts worldwide, showing evidence of spatiotemporal and genetic relations to hypabyssal porphyritic diorite and granodiorite intrusions, which were produced by water-rich magmas.
According to the orthomagmatic model [4][10][15][16], porphyry copper mineralized magmas are usually emplaced into upper crustal levels (at depths of approximately 5–10 km). The gradually cooling melts approach their saturation with volatile components [17][18]. As soon as the melt reaches its saturation with volatiles, a phase of aqueous magmatic fluid (whose salinity is not high) is separated from the melt [17][18], and some elements (including sulfur, chlorine, copper, and some other metals) are, therewith, transferred from the melt into the aqueous phase to form mineralized aqueous magmatic fluid [3][19][20][21][22][23][24][25][26][27][28][29][30][31]. Magmatic fluid ascends along fractures and cracks into the already-solid parts of the intrusions, alters host rocks, and comes, due to the pressure decrease, to the field of two-phase equilibrium, in which pressure is lower than 1300 bar (i.e., the region of ore deposition). In this region, the fluid exsolves (heterogenizes) into two phases: chloride brine and a low-density aqueous fluid [32][33]. The heterogenization of the fluid triggers the onset of ore deposition. The fluids then continue cooling, interacting with rocks and diluted meteoric waters, and depositing ore and gangue minerals [4][12][14][16]. Relics of the mineralizing fluids are captured as fluid inclusions, which can provide a record of the evolution of the parameters and composition of the fluids with time [34]. Many researchers have demonstrated that parameters of mineral-hosted fluid inclusions in porphyry hydrothermal systems systematically vary in space and with time, e.g., [26][31][34][35][36][37][38][39]. A model developed for H2O–NaCl fluid is able to realistically describe the distributions of various types of fluid inclusions (halite-bearing brine inclusions, gas inclusions, and liquid-rich two-phase inclusions) over the volumes of porphyry copper deposits [40]. Assemblages of brine and gas fluid inclusions mark domains with high-grade ores. It is important to specify that the fluid inclusion assemblage (FIA) is usually defined as the most finely discriminated group of cogenetic fluid inclusions occupying an individual petrographic feature (e.g., crystal growth-zone or healed fracture), as is unambiguously recognizable by microscopic methods. This model is able to predict the composition and parameters of fluid inclusions captured by minerals when porphyry fluid–magma systems spatiotemporally develop, which enables one to utilize these data for various practical purposes. Although porphyry deposits were studied in much detail, it is still interesting to correlate current understandings of their genesis with the available data on mineral-hosted fluid inclusions in porphyry Cu–Mo–Au systems.
It is pertinent to mention the following reviews of fluid inclusions in the minerals of porphyry systems, e.g., [5][26][34][38][41][42][43][44][45]. Some reviews were devoted to the parameters and composition of fluid inclusions in minerals from porphyry deposits, e.g., [31][46][47]. Fluid inclusions hosted in minerals at porphyry deposits are still actively studied, and extensive newly acquired data were published after the aforementioned reviews. Differences between the physicochemical parameters of fluids that produced all of the four types of porphyry deposits in the Cu–Mo–Au system still have not been adequately analyzed in the literature, likely because of the very broad variations in the homogenization temperature and salinity of the fluid inclusions.
2. Characterization of Fluids at Porphyry Deposits
When fluid inclusions are characterized, their descriptions are, conventionally, begun with descriptions of how these inclusions look like at room temperature. Fluid inclusions hosted in minerals from porphyry deposits can be grouped into the following three types, according to the phase composition of these inclusions at room temperature (Figure 1).
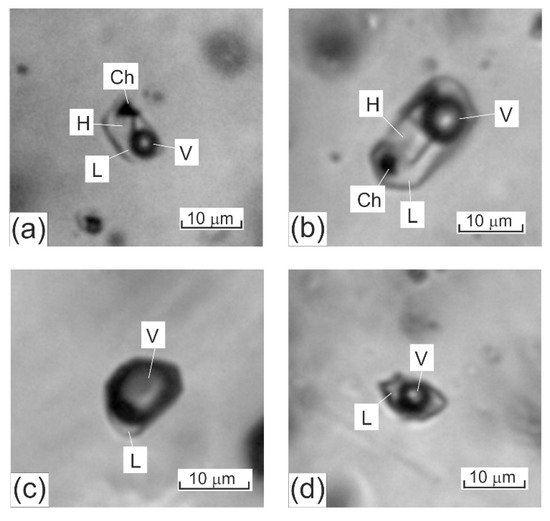
Figure 1. Three major types of fluid inclusions typically hosted in quartz from mineralized veinlets at porphyry deposits: (a,b) fluid inclusions of high-temperature chloride brines (the photos show dark gas bubbles, transparent cubic NaCl crystals, opaque chalcopyrite crystals, and solution); (c) gas fluid inclusions (the photos show a gas phase and a pale rim of aqueous solution; (d) two-phase gas–liquid inclusions of aqueous solutions of intermediate salinity (the photos show a roundish gas phase and pale aqueous salt solution). The scale bars are 10 µm. L–aqueous solution, V–gas phase, H–halite, Ch–chalcopyrite.
Type 1. Fluid inclusions of high-salinity brines: these inclusions contain an aqueous solution of high salinity (>26–30 wt % equiv. NaCl), a vapor bubble, and one or more daughter crystals. Among the latter, halite, sylvite, opaque or transparent red crystals of hematite and anhydrite have been identified [34]. The triangular transparent phases are usually identified as chalcopyrite crystals [26][31][34], which provide evidence of a high Cu concentration in the fluid. Recent Raman spectroscopic studies have identified daughter phases of javorieite KFeCl3 [48] and magnetite [49].
Type 2. Gas-rich fluid inclusions (> 70 ± 10 vol % gas).
Type 3. Aqueous salt two-phase fluid inclusions, whose salinity ranges from low to intermediate, and which contain a gas bubble that occupies 30 ± 10 vol %.
Some authors, [46] and others, distinguish an individual type of gas fluid inclusions of intermediate density, which contains an aqueous solution and vapor in equal proportions (L ≈ V), and which, also, sometimes host a small opaque crystal. It is thought that these fluid inclusions captured magmatic fluid at a high temperature and pressure in the region of homogeneous fluid above the vapor−liquid boundary in the system H2O−NaCl, and sometimes contain CO2 [50][51][52]. Such fluid could be entrapped in fluid inclusions at deeper levels than those where the ore mineralization was deposited. Due to this, such fluid inclusions cannot be numerous, and they cannot significantly modify the general situation. Herein, researchers attribute these inclusions to type 2, if such inclusions are mentioned in publications.
Figure 2 and Table 1 show the variations of parameters of mineralizing fluids collectively for all of the fluid inclusions, without subdividing them into types, but only the general ranges of the homogenization temperatures, salinity, and densities of the fluids. Note that the data on low-density fluid inclusions containing a gas phase can be incomplete due to purely technical reasons, namely, due to the small volumes of aqueous fluids in these inclusions, which often make it impossible to microthermometrically study these inclusions. This shall be taken into account when dealing with the data on fluid inclusions. The gas constituent of mineralizing fluid at porphyry deposits is not discussed in this entry because such information is still insufficient and because this information cannot characterize all types of porphyry deposits.
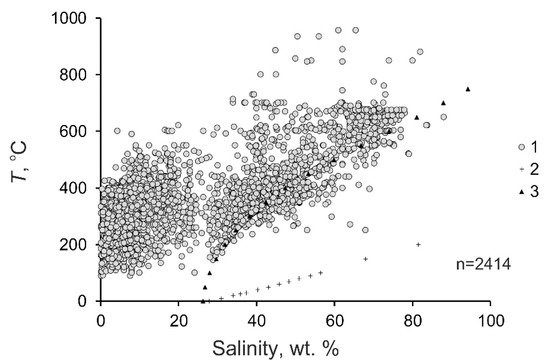
Figure 2. Diagram temperature–salinity for mineralizing fluids at porphyry deposits. 1—fluids at the deposits; 2—saturated KCl solution; 3—saturated NaCl solution.
Table 1. Parameters of mineralizing fluids at porphyry deposits.
| Deposit, Country, or Area | Physical Parameters of Fluid | Type ** of Deposit |
References | |||
|---|---|---|---|---|---|---|
| T, °C | S *, wt % | d, g/cm3 | Р, bar | |||
| Bingham Canyon, USA | 405 (1) | 49.0 | 1.25 | - | 2 | [50] |
| Butte, USA | 275–335 (2) | 1.0 | 0.62–0.76 | - | 2 | [50] |
| Climax, USA | 566 (1) | 69.0 | 1.45 | - | 3 | [50] |
| Copper Canyon, USA | 250–345 (3) | 1.2–40.0 | 0.80–1.06 | - | 1 | [53] |
| Kalmakyr, Uzbekistan | 375–800 (7) | 33.8–69.0 | 0.94–1.20 | 1000–1500 (4) | 2 | [54] |
| Bingham Canyon, USA | 350–616 (17) | 42.0–53.0 | 0.95–1.21 | - | 2 | [55] |
| Coloula, Papua New Guinea | 400–700 (4) | 34.0–62.0 | 0.60–1.30 | 1200 (1) | 1 | [56] |
| Inguaran district, Mexico | 226–360 (17) | 11.9–36.0 | 0.78–1.07 | - | 1 | [57] |
| Red Mountain, USA | 448–576 (6) | 52.0–68.0 | 1.12–1.50 | - | 1 | [58] |
| Washington, Mexico | 364–550 (2) | 34.5 | 0.81–0.98 | - | 2 | [59] |
| Mines Gaspe, Canada | 138-506 (68) | 9.5–56.0 | 0.60–1.25 | - | 1 | [60] |
| Santa Rita, USA | 775 (1) | 70.0 | 1.50 | - | 2 | [61] |
| Cumobabi, Mexico | 235–480 (8) | 2.9–50.0 | 0.63–1.12 | - | 2 | [62] |
| Questa, USA | 150–500 (16) | 2.0–57.0 | - | 800–1400 (8) | 3 | [25] |
| Sungun, Iran | 215–605 (54) | 2.2–59.8 | 0.54–1.12 | - | 1 | [63] |
| Far Southeast, Philippines | 450–550 (2) | 48.5–55.0 | 1.07–1.25 | - | 4 | [64] |
| Shotgun, USA | 270–509 (8) | 28.0–69.0 | 0.76–1.50 | - | 2 | [65] |
| Bajo de la Alumbrera, Argentina | 745–845 (2) | 62.0 | - | - | 1 | [66] |
| Escondida, Chile | 270–680 (10) | 3.0–67.0 | 0.68–1.23 | - | 1 | [67] |
| Bajo de la Alumbrera, Argentina | 615–845 (3) | 45.0–53.0 | - | - | 1 | [68] |
| Rosario, Chile | 237–593 (31) | 0.7–73.0 | 0.58–1.65 | - | 2 | [69] |
| Cerro Colorado, Chile | 90–544 (32) | 0.1–52.0 | 0.60–1.30 | - | 2 | [70] |
| El Teniente Deposit, Chile | 262–515 (49) | 2.1–60.5 | 0.47–1.15 | - | 2 | [71] |
| Bugdainskoe, Russia | 205–576 (11) | 6.9–70.5 | 0.66–1.45 | - | 2 | [72] |
| Fenghuangshan, China | 122–620 (100) | 3.4–71.5 | 0.63–1.40 | 1 | [73] | |
| Talatui, Russia | 133–611 (50) | 0.4–56.3 | 0.47–1.21 | 108–3366 (37) | 4 | [74] |
| Butte, USA | 140–413 (14) | 1.0–48.0 | 0.41–1.14 | - | 2 | [51] |
| Questa, USA | 271–429 (21) | 2/8–50/0 | 0/43–1/12 | - | 3 | [52] |
| La Caridad Antigua, Mexico | 330–470 (13) | 28.0–56.0 | 0.95–1.15 | - | 1 | [75] |
| Nevados de Famatina, Argentina | 175–552 (22) | 1.5–64.4 | 0.46–1.48 | - | 2 | [76] |
| Xiongcun, China | 121–382 (37) | 1.9–34.6 | 0.59–1.16 | - | 1 | [77] |
| Qiyugou, China | 157–460 (24) | 3.7–37.2 | 0.58–1.02 | - | 4 | [78] |
| Bingham Canyon, USA | 323–492 (3) | 34.7–50.4 | 0.90–1.10 | - | 2 | [79] |
| Baogutu, China | 151–550 (90) | 0.2–66.8 | 0.46–1.22 | 307–3128 (9) | 2 | [80] |
| Qiyugou, China | 109–476 (21) | 3.9–47.0 | 0.65–1.10 | - | 4 | [81] |
| Xishizishan, China | 131–570 (7) | 1.1–54.5 | 0.87–1.12 | - | 1 | [82] |
| Huashupo, China | 191–525 (10) | 9.6–49.9 | 0.70–1.01 | - | 1 | [82] |
| Datuanshan, China | 205–437 (7) | 7.6–43.8 | 0.72–1.09 | - | 1 | [82] |
| Tongguanshan, China | 289–885 (12) | 6.0–44.9 | 0.64–1.16 | - | 1 | [82] |
| Shizishan, China | 148–600 (11) | 2.1–56.2 | 0.52–1.10 | 1 | [82] | |
| Shizishan, China | 158–610 (13) | 2.1–56.2 | 0.56–1.19 | - | 1 | [83] |
| Shaxi, China | 110–520 (10) | 8.0–58.0 | 0.71–1.13 | - | 1 | [83] |
| Tongniujing, China | 192–450 (3) | 30.0–48.0 | 1.00–1.11 | - | 1 | [83] |
| Xiaomiaoshan, China | 91–369 (4) | 0.7–43.0 | 0.81–1.14 | - | 1 | [83] |
| Baocun, China | 240–310 (4) | 16.1–26.0 | 0.91–1.01 | - | 1 | [84] |
| Datuanshan, China | 160–440 (12) | 8.7–29.3 | 0.67–1.03 | - | 1 | [84] |
| Dongguashan, China | 170–450 (7) | 17.0–53.3 | 0.93–1.12 | - | 1 | [84] |
| Chaoshan, China | 220–280 (2) | 17.0 | 0.91–0.98 | - | 1 | [84] |
| Duobuza, China | 616–957 (33) | 34.0–74.0 | 0.75–1.80 | 400–1600 (15) | 1 | [85] |
| Mount Leyshon, Australia | 150–595 (64) | 0.2–61.9 | 0.38–1.13 | - | 4 | [86] |
| Bingham Canyon, USA | 313–610 (121) | 3.3–59.0 | 0.42–1.21 | - | 2 | [87] |
| Novoe Manto, Russia | 100–365 (9) | 9.6–24.2 | 0.86–1.15 | - | 1 | [88] |
| Jinchang, China | 200–620 (42) | 0.4–74.0 | 0.40–1.55 | - | 1 | [89] |
| Maher-Abad, Iran | 150–488 (20) | 9.5–47.9 | 0.80–1.13 | - | 1 | [90] |
| Peschanka, Russia | 205–506 (10) | 0.2–55.0 | 0.4–1.11 | - | 1 | [91] |
| Kighal, Iran | 180–600 (6) | 23.0–70.0 | 0.79–1.50 | 2 | [92] | |
| Malysh, Russia | 129–545 (26) | 0.7–47.0 | 0.55–1.09 | 270–470 (2) | 3 | [93] |
| Peschanka, Russia | 104–506 (40) | 0.2–55.7 | 0.43–1.36 | 220–540 (8) | 1 | [93] |
| Nakhodka, Russia | 122–581 (10) | 2.1–57.8 | 0.51–1.14 | 280–850 (3) | 1 | [93] |
| Dexing, China | 105–524 (33) | 1.1–63.0 | 0.58–1.19 | 1500–3000 (2) | 2 | [94] |
| Vasil’kovskoe, Kazakhstan | 100–550 (126) | 2.0–22.5 | 0.47–1.03 | 150–2300 (69) | 4 | [95] |
| Malmyzh, Russia | 331–850 (9) | 27.0–80.0 | 0.95–1.13 | - | 1 | [96] |
| Pebble, USA | 147–535 (157) | 0.1–61.0 | 0.41–1.20 | - | 2 | [97] |
| Qarachilar, Iran | 190–530 (15) | 9.2–55.0 | 0.65–1.12 | - | 2 | [98] |
| Machangqing, China | 202–550 (15) | 12.7–22.1 | 0.51–1.09 | - | 2 | [99] |
| Yulong, China | 220–600 (20) | 2.0–46.0 | 0.48–1.07 | - | 2 | [99] |
| Tongchang, China | 240–460 (15) | 2.0–52.0 | 0.80–1.13 | - | 2 | [99] |
| Seleteguole, China | 268–483 (54) | 2.1–57.4 | 0.48–1.14 | - | 2 | [100] |
| Malmyzh, Russia | 260–525 (10) | 0.4–60.0 | 0.45–1.14 | 500 (2) | 1 | [101] |
| Grasberg, Indonesia | 255–700 (25) | 6.4–74.7 | 0.48–1.12 | - | 1 | [102] |
| № 1, China | 132–522 (104) | 0.9–62.8 | 0.41–1.19 | 1 | [103] | |
| Kışladağ, Turkey | 250–600 (35) | 1.0–49.0 | 0.47–1.04 | - | 4 | [104] |
| Grasberg, Indonesia | 228–700 (403) | 1.4–88.0 | 0.625–1.47 | - | 1 | [105] |
| Sadaigoumen, China | 211–510 (122) | 1.2–50.6 | - | 10–600 (8) | 3 | [106] |
Note: * fluid salinity in wt % equiv. NaCl (numerals in parentheses show the number of determinations); ** types of porphyry deposits: 1–Cu (Au); 2–Cu, Mo (Au); 3–Mo; 4–Au.
Overall ranges of the physicochemical parameters. The principal parameters of mineralizing fluids at individual porphyry deposits of various types in the Cu−Mo−Au system are listed in Table 1. In general, the ranges of the principal physicochemical parameters of fluids at porphyry deposits are fairly broad, as follows from the data on 2414 groups of fluid inclusions (Figure 2, Table 2): the homogenization temperatures of the fluid inclusions range from 90 to 957 °C (388 °C on average). As seen in the histogram in Figure 3, most of the fluids were entrapped into fluid inclusions at temperatures of 200 to 500 °C. Note that publications usually present homogenization temperatures of fluid inclusions. However, it is now acknowledged that mineral-forming processes at porphyry deposits begin when the fluid becomes heterogeneous [32][33]. It is known that if fluid inclusions are entrapped on a two-phase equilibrium curve, the homogenization temperatures of these inclusions are equal to their entrapment temperatures [34]. Hence, the homogenization temperatures of early mineral-hosted fluid inclusions at porphyry deposits usually correspond to their entrapment temperatures, which allowed researchers to discuss the fluid temperatures here.
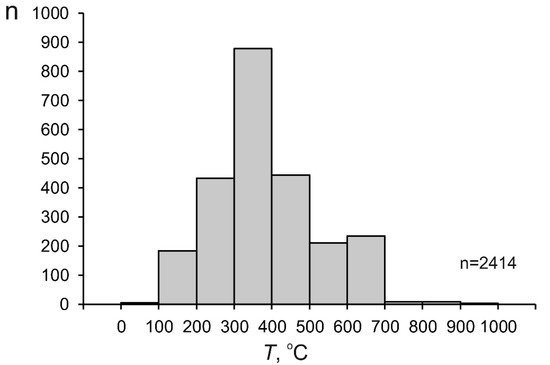
Figure 3. Histogram of the temperature of mineralizing fluids at porphyry deposits.
Table 2. Parameters of mineralizing fluids at porphyry deposits of different types.
| Types * of Deposits |
n | Temperature, °C | Salinity, wt. % | Density of Fluid, g/cm3 | ||||||
|---|---|---|---|---|---|---|---|---|---|---|
| Interval | Average Arithmetic | Average Geometric | Interval | Average Arithmetic | Average Geometric |
Interval | Average Arithmetic | Average Geometric |
||
| All | 2414 | 90–957 | 388 | 372 | 0.1-88.0 | 29.4 | 28.2 | 0.38–1.85 | 0.93 | 0.95 |
| 1 | 1017 | 91–957 | 437 | 421 | 0.2-88.0 | 39.4 | 41.4 | 0.40–1.85 | 1.00 | 1.00 |
| 2 | 923 | 90–800 | 359 | 363 | 0.1-73.0 | 26.3 | 28.6 | 0.41–1.65 | 0.91 | 0.96 |
| 3 | 193 | 129–566 | 349 | 354 | 0.7-69.0 | 13.8 | 8.5 | 0.43–1.45 | 0.85 | 0.83 |
| 4 | 280 | 100–611 | 329 | 341 | 0.2-61.9 | 13.0 | 9.0 | 0.38–1.25 | 0.81 | 0.81 |
Note: * types of porphyry deposits: 1–Cu (Au); 2–Cu, Mo (Au); 3–Mo; 4–Au; n: number of measurements.
It shall be mentioned that some papers report homogenization temperatures of fluid inclusions higher than 600 °C, with these values obtained using high-temperature heating stages. Such data usually provoke no doubts, if the publication reports information that these data are reproducible. However, researchers rejected homogenization temperatures above 700 °C (up to 1290 °C) obtained for the Grasberg deposit [102][105], since the authors themselves were not sure whether these values do characterize the processes that produced the ores. Indeed, fluids at porphyry deposits contain much Fe and can lose protons because of water dissociation when heated to very high temperatures; the protons can migrate from the fluid inclusions through their host quartz and, thus, irreversibly change the composition of the fluid inclusions and result in overestimates of their homogenization temperatures, e.g., [34][107][108].
The salinity of the mineralizing fluids varies from 0.1 to 88.0 wt % equiv. NaCl (29.4 wt % equiv. NaCl on average). Some salinity values of fluids at porphyry deposits extend outside the H2O–NaCl saturation line, but they are no higher than the KCl solubility. (Figure 2). This is consistent with the sylvite that was found among the daughter minerals in fluid inclusions and with the occurrence of potassic metasomatites at porphyry deposits. The histogram of the salinity of the fluids has two maxima, at 0 to 10 and 35 to 45 wt % (Figure 4). This reflects the heterogenization of fluid, a process during which porphyry deposits start to be formed.
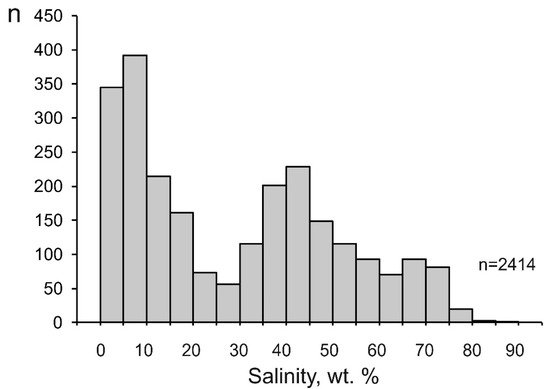
Figure 4. Histogram of the salinity of mineralizing fluids at porphyry deposits.
The density of mineralizing fluids at porphyry deposits also varies broadly, from 0.33 to 1.85 g/cm3 (average 0.93 g/cm3), since this parameter is interrelated with, first of all, the temperature and salinity of the fluids. The maximum variations in the fluid density were found at temperatures above 300 °C (Figure 5), which is also related to the heterogenization of the fluids. Below 200 °C, the density of the fluids approaches 1 g/cm3 because of the temperature decrease and the occurrence of the fluid in the homogeneous region. The histogram of the fluid density is unimodal, with its maximum occurring at 1.00 to 1.10 g/cm3 (Figure 6).
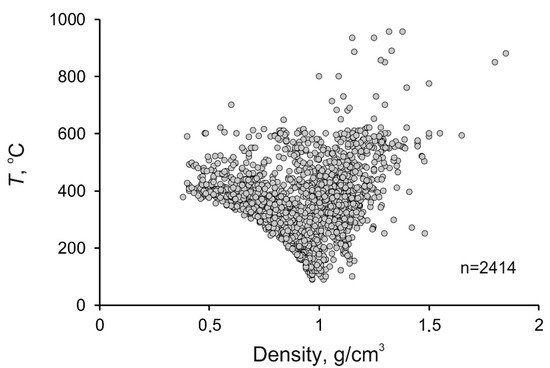
Figure 5. Diagram temperature–density for mineralizing fluids at porphyry deposits.
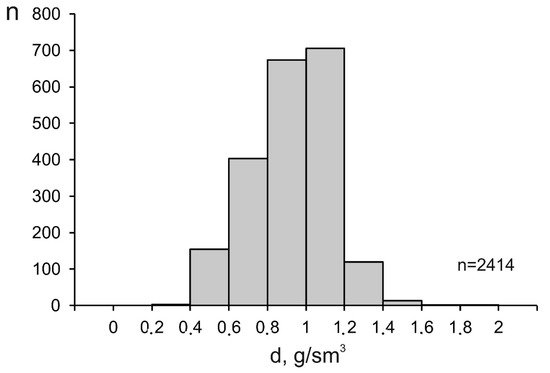
Figure 6. Histogram of the density of mineralizing fluids at porphyry deposits.
Some systematic differences were found between the average and maximum values of the parameters of the mineralizing fluids at porphyry deposits of various types (Table 2, Figure 7).
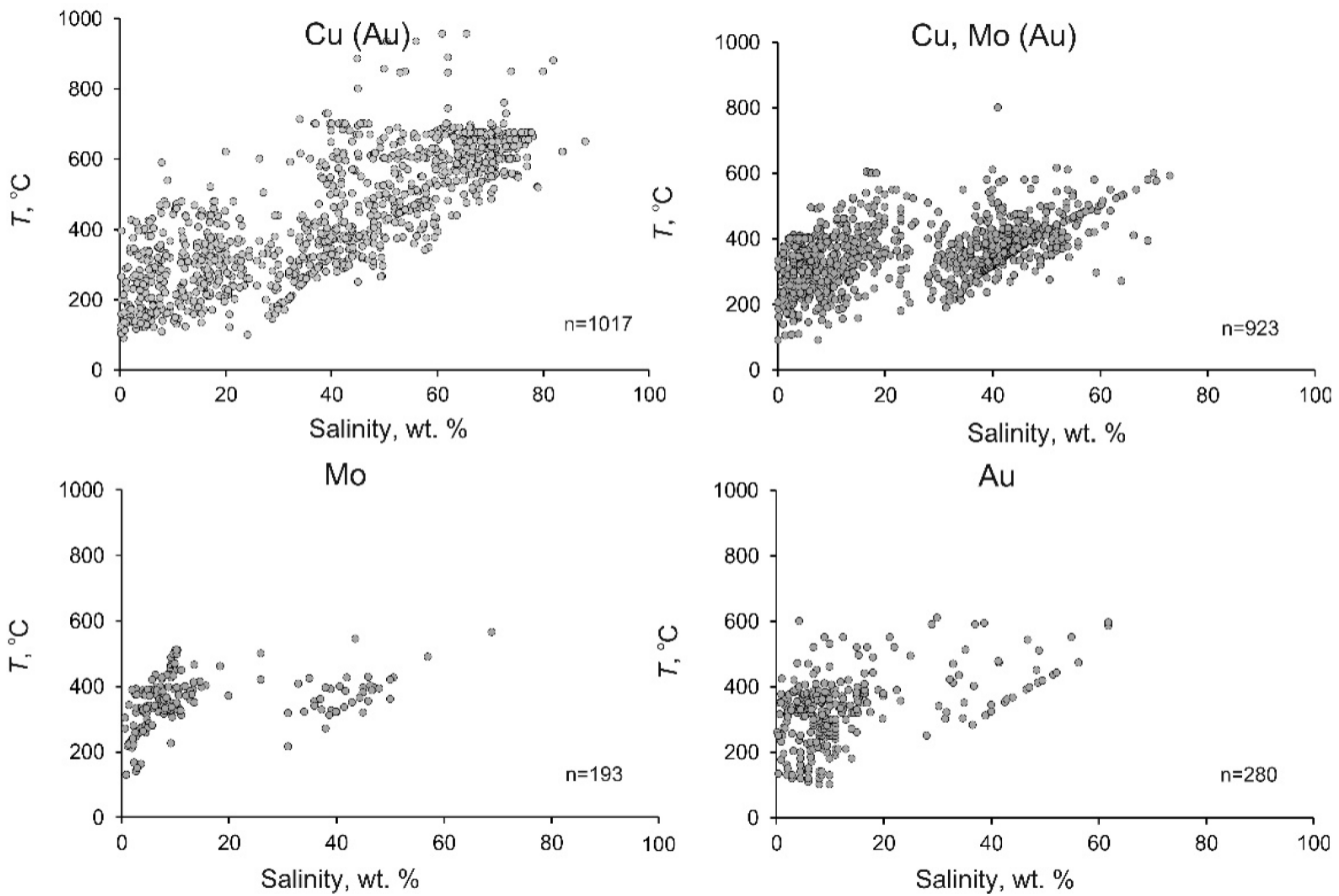
Figure 7. Temperature–salinity diagram for mineralizing fluids at porphyry deposits of different types.
The average homogenization temperatures, salinity, and density of the fluids at deposits of various types commonly systematically decrease from deposits of type 1 to those of type 4. Figure 7 shows that the variations of the homogenization temperatures and salinity of the fluids at deposits of various types are generally similar, but the fields of these variations systematically shrink. This situation is not universal for the maximum homogenization temperatures. The minimum values of the maximum homogenization temperatures of fluids were found at porphyry Mo deposits (type 3), which may be explained by the fact that the numbers of measurements at deposits of types 3 and 4 are smaller.
The great scatter of fluid parameters at each deposit (for example, the temperature ranges within a few hundred grades) inevitably puts forth the problem of the significance of the detected differences (for example, the average temperatures vary within as little as 10–40 °C) between the average parameters of fluids at porphyry deposits of different types. To sort out anomalous outlier values and be able to more accurately compare available data on various parameters, including those in the regions with 50% of the data (Figure 8), researchers have constructed boxplots. The diagram for the temperatures (Figure 8), obviously, shows that porphyry copper deposits of type 1 are noted for the highest maximum and average homogenization temperatures of fluid inclusions. Porphyry copper–molybdenum deposits of type 2 show intermediate values of the average and maximum temperatures, and porphyry molybdenum deposits of type 3 and porphyry gold deposits of type 4 are relatively low temperature. The situation with the salinity diagrams is generally analogous for the maximum and average values of this parameter (Figure 8). The highest salinity is typical of fluids at porphyry copper deposits of type 1, intermediate salinity values were found in fluids at porphyry molybdenum deposits of type 2, and the lowest values were detected in fluids at molybdenum deposits of type 3 and porphyry gold deposits of type 4. It should be mentioned that fluids at porphyry molybdenum deposits of type 3 and porphyry gold ones of type 4 yield the narrowest ranges of the dominant salinity values of the fluids. The density values of the fluids do not vary as widely (Figure 8), but the average density of the fluids, obviously and systematically, decreases from type 1 (Cu(Au)) to type 4 (Au). This led researchers to the conclusion that mineralizing fluids at porphyry deposits of different types are different in composition and have different parameters.

Figure 8. Boxplots for the homogenization temperatures of fluid inclusions, for the salinity of mineralizing fluids and for the density of mineralizing fluids at porphyry deposits of various types (1–Cu (Au); 2–Cu, Mo (Au); 3–Mo; 4–Au).
Here and in Figure 9, lines in the boxes are medians, crosses are averages, and spots are outliers (https://towardsdatascience.com/understanding-boxplots-5e2df7bcbd51, accessed on 11 September 2018).
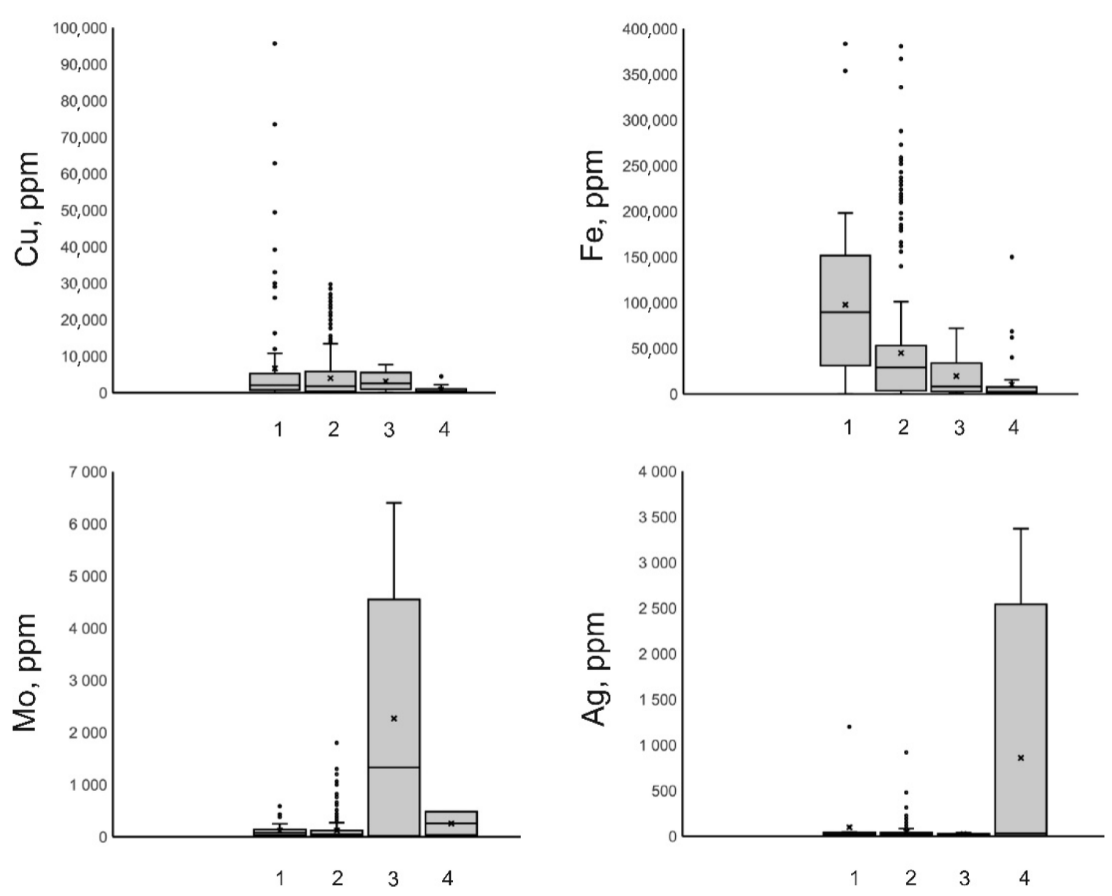
Figure 9. Boxplots for concentrations of Cu, Fe, Mo, and Ag, in mineralizing fluids at porphyry deposits of various types (1–Cu (Au); 2–Cu, Mo (Au); 3–Mo; 4–Au).
References
- Sillitoe, R.H. A plate tectonic model for the origin of porphyry copper deposits. Econ. Geol. 1972, 67, 184–197.
- Titley, S.R. Characteristics of porphyry copper occurrence in the American southwest. Miner. Depos. Modeling. Geol. Assoc. Can. Pap. 1993, 40, 433–464.
- Seedorf, E.; Dilles, J.H.; Proffett, J.M., Jr.; Einaudi, M.T.; Zurcher, L.; Stavasr, W.J.A.; Johnson, D.A.; Barton, M.D. Porphyry Deposits: Characteristics and Origin of Hypogene Features. Econ. Geol. 2005, 100, 251–298.
- Sillitoe, R.H. Porphyry copper systems. Econ. Geol. 2010, 105, 3–41.
- Hedenquist, J.W.; Richards, J.P. The influence of geochemical techniques on the development of genetic models for porphyry copper deposits. Rev. Econ. Geol. 1998, 10, 235–256.
- Tosdal, R.M.; Richards, J.P. Magmatic and structural controls on the development of porphyry Cu ± Mo ± Au deposits. Rev. Econ. Geol. 2001, 14, 157–181.
- Richards, J.P. Tectonomagmatic precursors for porphyry Cu-(Mo-Au) deposit formation. Econ. Geol. 2003, 98, 1515–1533.
- Richards, J.P. Magmatic to hydrothermal metal fluxes in convergent and collided margins. Ore Geol. Rev. 2011, 40, 1–26.
- Cooke, D.R.; Hollings, P.; Walsh, J.L. Giant porphyry deposits: Characteristics, distribution, and tectonic controls. Econ. Geol. 2005, 100, 801–818.
- Lowell, J.D.; Guilbert, J.M. Lateral and vertical alteration-mineralization zoning in porphyry ore deposits. Econ. Geol. 1970, 65, 373–408.
- Kirkham, R.V. Intermineral intrusions and their bearing on the origin of porphyry copper and molybdenum deposits. Econ. Geol. 1971, 66, 1244–1249.
- Beane, R.E.; Titley, S.R. Porphyry copper deposits: Part 2. Hydrothermal alteration and mineralization. Econ. Geol. 1981, 75, 235–269.
- Titley, S.R. The style and progress of mineralization and alteration in porphyry copper systems: American Southwest. In Advances in Geology of the Porphyry Copper Deposits, Southwestern North America; Titley, S.R., Ed.; University of Arizona Press: Tucson, AZ, USA, 1982; pp. 93–116.
- Beane, R.E.; Bodnar, R.J. Hydrothermal fluids and hydrothermal alteration in porphyry copper deposits. Ariz. Geol. Soc. Dig. 1995, 20, 83–93.
- Gustafson, L.B.; Hunt, J.P. The porphyry copper deposit at El Salvador, Chile. Econ. Geol. 1975, 70, 857–912.
- Henley, R.W.; McNabb, A. Magmatic vapor plumes and groundwater interaction in porphyry copper emplacement. Econ. Geol. 1978, 73, 1–20.
- Burnham, C.W. Magmas and hydrothermal fluids. In Geochemistry of Hydrothermal Ore Deposits; Barnes, H.L., Ed.; John Wiley & Sons: New York, NY, USA, 1979; pp. 71–136.
- Burnham, C.W. Magmas and hydrothermal fluids. In Geochemistry of Hydrothermal Ore Deposits; Barnes, H.L., Ed.; Wiley and Sons: New York, NY, USA, 1997; pp. 63–123.
- Holland, H.D. Granites, solutions, and base metal deposits. Econ. Geol. 1972, 67, 281–301.
- Kilinc, I.A.; Burnham, C.W. Partitioning of chloride between a silicate melt and coexisting aqueous phase from 2 to 8 kilobars. Econ. Geol. 1972, 67, 231–235.
- Candela, P.A.; Holland, H.D. The partitioning of copper and molybdenum between silicate melts and aqueous fluids. Geochim. Cosmochim. Acta 1984, 48, 373–380.
- Candela, P.A. Magmatic ore-forming fluids: Thermodynamic and mass-transfer calculations of metal concentrations. In Ore Deposition Associated With Magmas. Reviews in Economic Geology, 4; Whitney, J.A., Naldrett, A.J., Eds.; Economic Geology Publishing Company: El Paso, TX, USA, 1989; pp. 203–221.
- Shinohara, H.; Iiyama, J.T.; Matsuo, S. Partition of chlorine compounds between silicate melt and hydrothermal solutions; I, partition of NaCl-KCl. Geochim. Cosmochim. Acta 1989, 53, 2617–2630.
- Cline, J.S.; Bodnar, R.J. Can economic porphyry copper mineralization be generated by a typical calc-alkaline melt? J. Geophys. Res. 1991, 96, 8113–8126.
- Cline, J.S.; Bodnar, R.J. Direct evolution of a brine from crystallizing silicic melt at the Questa, New Mexico, molybdenum deposit. Econ. Geol. 1994, 89, 1780–1802.
- Bodnar, R.J. Fluid-inclusion evidence for a magmatic source for metals in porphyry copper deposits. Mineral. Assoc. Can. Short Course Ser. 1995, 23, 139–152.
- Holtz, F.; Johannes, W.; Tamic, N.; Behrens, H. Maximum and minimum water contents of granitic melts generated in the crust. Lithos 2001, 56, 1–14.
- Heinrich, C.A.; Driesner, T.; Stefánsson, A.; Seward, T.M. Magmatic vapor concentration and the transport of gold from the porphyry environment to epithermal ore deposits. Geology 2004, 32, 761–764.
- Rusk, B.; Reed, M.H.; Dilles, J.H.; Klemm, L. Compositions of magmatic-hydrothermal fluids determined by LA-ICPMS of fluid inclusions from the porphyry copper-molybdenum deposit at Butte. Montana. Chem. Geol. 2004, 210, 173–199.
- Audetat, A.; Pettke, T.; Heinrich, C.A.; Bodnar, R.J. The composition of magmatic-hydrothermal fluids in barren and mineralized intrusions. Econ. Geol. 2008, 103, 877–908.
- Bodnar, R.J.; Lecumberri-Sanchez, P.; Moncada, D.; Steele-Maclnnes, P. Fluid Inclusions in Hydrothermal Ore Deposits. Reference Module in Earth Systems and Environmental Sciences. Treatise on Geochemistry, 2nd ed.; Elsevier: Amsterdam, The Netherlands, 2014; pp. 119–142.
- Driesner, T. The system H2O-NaCl. Part II: Correlations for molar volume, enthalpy, and isobaric heat capacity from 0 to 1000 °C, 1 to 5000 bar, and 0 to 1 XNaCl. Geochim. Cosmochim. Acta 2007, 71, 4902–4919.
- Driesner, T.; Heinrich, C.A. The system H2O-NaCl. Part I: Correlation formulae for phase relations in temperature-pressure-composition space from 0 to 1000 °C, 1 to 5000 bar, and 0 to 1 XNaCl. Geochim. Cosmochim. Acta 2007, 71, 4880–4901.
- Roedder, E. Fluid inclusions: Reviews in Mineralogy. Mineral. Soc. Am. 1984, 12, 646p.
- Roedder, E. Fluid inclusions as samples of ore fluids. In Geochemistry of Hydrothermal Ore Deposits; Barnes, H.L., Ed.; Holt, Rinehart and Winston: New York, NY, USA, 1967; pp. 515–574.
- Nash, T.J. Fluid inclusion petrology—Data from porphyry copper deposits and applications to exploration. In U. S. Geological Survey Professional Paper 907-D; US Government Printing Office: Washington, DC, USA, 1976; p. 16.
- Bodnar, R.J. Fluid inclusions in porphyry-type deposits. In Mineral Deposits Research Review for Industry Course Notes; The Pennsylvania State University: University Park, PA, USA, 1982; pp. RB1–RB25.
- Roedder, E.; Bodnar, R.J. Fluid inclusion studies of hydrothermal ore deposits. In Geochemistry of Hydrothermal Ore Deposits; Barnes, H.L., Ed.; Wiley & Sons, Inc.: New York, NY, USA, 1997; pp. 657–698.
- Lecumberri-Sanchez, P.; Newton, M.C.; Westman, E.C.; Kamilli III, R.J.; Canby, V.M.; Bodnar, R.J. Temporal and spatial distribution of alteration, mineralization and fluid inclusion types in the transitional epithermal-porphyry copper system at Red Mountain AZ. J. Geochem. Explor. 2013, 125, 80–93.
- Becker, S.P.; Bodnar, R.J.; Reynolds, T.J. Temporal and spatial variations in characteristics of fluid inclusions in epizonal magmatic-hydrothermal systems: Applications in exploration for porphyry copper deposits. J. Geochem. Explor. 2019, 204, 240–255.
- Spooner, E.T.C. Fluid inclusion studies of hydrothermal ore deposits. Miner. Assoc. Can. Short Course Handb. 1981, 6, 209–240.
- Weisbrod, A. Fluid inclusions in shallow intrusive. Miner. Assoc. Can. Short Course Handb. 1981, 6, 241–271.
- Lattanzi, P. Applications of fluid inclusions in the study and exploration of mineral deposits. Eur. J. Miner. 1991, 3, 689–701.
- Lattanzi, P. Fluids in ore deposits. In Fluid inclusions in minerals. Methods and applications; de Vivo, B., Frezzotti, M.L., Eds.; Virginia Polytechnic Institute and State University, International Mineralogical Association Working Group Short Course: Blacksburg, VA, USA, 1994; pp. 297–307.
- Wilkinson, J.J. Fluid inclusions in hydrothermal ore deposits. Lithos 2001, 55, 229–272.
- Kouzmanov, K.; Pokrovski, G.S. Hydrothermal controls on metal distribution in porphyry Cu (-Mo-Au) systems. Soc. Econ. Geol. Inc. Spec. Publ. 2012, 16, 573–618.
- Naumov, V.B.; Dorofeeva, V.A.; Mironova, O.F. Physicochemical parameters of the origin of hydrothermal mineral deposits: Evidence from fluid inclusions. IV. Copper and molybdenum. Geochem. Internat. 2017, 55, 711–725.
- Koděra, P.; Tacách, Á.; Racek, M.; Šimko, F.; Luptáková, I.; Váczi, T.; Antal, P. Javorieite, KFeCl3: A new mineral hosted by salt melt inclusions in porphyry gold systems. Eur. J. Mineral. 2017, 6, 995–1004.
- Pintea, I.; Udubaşa, S.S.; Latan, E.L.; Berbeleac, I.; Bĭrgăoanu, D.; Ciobotea-Barbu, O.C.; Ghinescu, E. Microthermometry and Raman spectroscopy of fluid and melt inclusions in the alpine porphyry copper deposits from Romania: Insights on micrometallogeny. Rom. J. Miner. Depos. 2019, 92, 9–32.
- Roedder, E. Fluid inclusion studies on the porphyry-type ore deposits at Bingham, Utah, Butte, Montana, and Climax, Colorado. Econ. Geol. 1971, 66, 98–120.
- Rusk, B.G.; Reed, M.H.; Dilles, J.H. Fluid inclusion evidence for magmatic-hydrothermal fluid evolution in the porphyry copper-molybdenum deposit at Butte, Montana. Econ. Geol. 2008, 103, 307–334.
- Klemm, L.M.; Pettke, T.; Heinrich, C.A. Fluid and source magma evolution of the Questa porphyry Mo deposit, New Mexico, USA. Mineral. Depos. 2008, 43, 533–552.
- Nash, J.T.; Theodore, T.G. Ore fluids in the porphyry copper deposit at Copper Canyon, Nevada. Econ. Geol. 1971, 66, 385–399.
- Berzina, A.P.; Sotnikov, V.I. Some compositional features and parameters of mineral-forming solutions at the Kalmakyr deposit. Geol. Ore Dep. 1973, 4, 44–50. (In Russian)
- Moore, W.J.; Nash, J.T. Alteration and fluid inclusion studies of the porphyry copper ore body at Bingham, Utah. Econ. Geol. 1974, 69, 631–645.
- Chivas, A.R.; Wilkins, R.W.T. Fluid inclusion studies in relation to hydrothermal alteration and mineralization at the Koloula porphyry copper prospect, Guadalcanal. Econ. Geol. 1977, 72, 153–169.
- Sawkins, F.J. Fluid inclusion studies of the Inguaran copper-bearing breccia pipes, Michaocan, Mexico. Econ. Geol. 1978, 74, 924–927.
- Bodnar, R.J.; Bean, R.E. Temporal and spatial variations in hydrothermal fluid characteristics during vein filling in preore cover overlying deeply Buried porphyry copper-type mineralization at Red Mountain, Arizona. Econ. Geol. 1980, 75, 875–893.
- Simmons, S.F.; Sawkins, F.J. Mineralogic and fluid inclusion studies of the Washington Cu-Mo-W-bearing breccia pipe, Sonora, Mexico. Econ. Geol. 1983, 78, 521–526.
- Shelton, K.L. Composition and origin of ore-forming fluids in a carbonate-hosted porphyry copper and skarn deposit: A fluid inclusion and stable isotope study of Mines Gaspe, Quebec. Econ. Geol. 1983, 78, 387–421.
- Reynolds, T.J.; Beane, R.E. Evolution of hydrothermal fluid characteristics at the Santa Rita, New Mexico, porphyry copper deposit. Econ. Geol. 1985, 80, 1328–1347.
- Scherkenbach, D.A.; Sawkins, F.J.; Sayfried, W.E., Jr. Geologic, fluid inclusion, and geochemical studies of the mineralized breccias at Cumobabi, Sonora, Mexico. Econ. Geol. 1985, 80, 1566–1592.
- Hezarkhani, A.; Williams-Jones, A.E. Controls of alteration and mineralization in the Sungun porphyry copper deposit, Iran: Evidence from fluid inclusions and stable isotopes. Econ. Geol. 1998, 93, 651–670.
- Hedenquist, J.W.; Arribas, A.J.; Reynolds, T.J. Evolution of an Intrusion-Centered Hydrothermal System: Far Southeast-Lepanto Porphyry and Epithermal Cu-Au Deposits, Philippines. Econ. Geol. 1998, 93, 373–404.
- Rombach, C.S.; Newberry, R.J. Shotgun deposit: Granite porphyry-hosted gold-arsenic mineralization in southwestern Alaska, USA. Mineral. Depos. 2001, 36, 607–621.
- Harris, A.C.; Kamenetsky, V.S.; White, N.C.; van Achterbergh, E.; Ryan, C.G. Melt inclusions in veins: Linking magmas and porphyry Cu deposits. Science 2003, 302, 2109–2111.
- Padilla-Garza, R.A.; Titley, S.R.; Eastoe, C.J. Hypogene evolution of the Escondida porphyry copper deposit, Chile. Econ. Geol. Spec. Publ. 2004, 11, 141–165.
- Harris, A.C.; Kamenetsky, V.S.; White, N.C.; Steele, D.A. Volatile phase separation in silicic magmas at Bajo de la Alumbrera porphyry Cu-Au deposit, NW Argentina. Resour. Geol. 2004, 54, 341–356.
- Masterman, G.J.; Cooke, D.R.; Berry, R.F.; Walshe, J.L.; Lee, A.W.; Clark, A.H. Fluid chemistry, structural setting, and emplacement history of the Rosario Cu-Mo porphyry and Cu-Ag-Au epithermal veins, Collahuasi district, Northern Chile. Econ. Geol. 2005, 100, 835–862.
- Bouzari, F.; Clark, A.H. Prograde evolution and geothermal affinities of a major porphyry copper deposit: The Cerro Colorado hypogene protore, I Región, Northern Chile. Econ. Geol. 2006, 101, 95–134.
- Klemm, L.M.; Pettke, T.; Heinrich, C.A.; Campos, E. Hydrothermal evolution of the El Teniente deposit, Chile: Porphyry Cu-Mo ore deposition from low-salinity magmatic fluids. Econ. Geol. 2007, 102, 1021–1045.
- Kovalenkev, V.A.; Krylova, T.L.; Kiseleva, G.D.; Kigai, I.N. Parameters of processes that produced the atypical Bugdainskoe Au-Mo(W)-Pb-Zn porphyry deposit, eastern Transbaikalia, Russia. Dokl. Acad. Sci. Rus. 2007, 416, 96–99. (In Russian)
- Lai, J.; Chi, G.; Peng, S.; Shao, Y.; Yang, B. Fluid evolution in the formation of the Fenghuangshan Cu-Fe-Au deposit, Tongling, Anhui, China. Econ. Geol. 2007, 102, 949–970.
- Prokofiev, V.Y.; Zorina, L.D.; Kovalenker, V.A.; Akinfiev, N.N.; Baksheev, I.A.; Krasnov, A.N.; Yurgenson, G.A.; Trubkin, N.V. Composition, Formation Conditions, and Genesis of the Talatui Gold Deposit, the Eastern Transbaikal Region, Russia. Geol. Ore Depos. 2007, 49, 31–68.
- Valencia, V.A.; Eastoe, C.; Ruiz, J.; Ochoa-Landin, L.; Gehrels, G.; Gonzalez-Lion, C.; Barra, F.; Espinoza, E. Hydrothermal evolution of the porphyry copper deposit at La Caridad, Sonora, Mexico, and the relationship with a neighboring high-sulfidation epithermal deposit. Econ. Geol. 2008, 103, 475–491.
- Pudack, C.; Halter, W.E.; Heinrich, C.A.; Pettke, T. Evolution of magmatic vapor to gold-rich epithermal liquid: The porphyry to epithermal transition at Nevados de Famatina, Northwest Argentina. Econ. Geol. 2009, 104, 449–477.
- Xu, W.Y.; Pan, F.C.; Qu, X.M.; Hou, Z.Q.; Yang, Z.S.; Chen, W.S.; Yang, D.; Cui, Y. Xiongcun, Tibet: A telescoped system of veinlet-disseminated Cu (Au) mineralization and late vein-style Au (Ag)-polymetallic mineralization in a continental collision zone. Ore Geol. Rev. 2009, 36, 174–193.
- Chen, Y.J.; Pirajno, F.; Li, N.; Guo, D.S.; Lai, Y. Isotope systematics and fluid inclusion studies of the Qiyugou breccia pipe-hosted gold deposit, Qinling Orogen, Henan province, China: Implications for ore genesis. Ore Geol. Rev. 2009, 35, 245–261.
- Seo, J.H.; Guillong, M.; Heinrich, C.A. The role of sulfur in the formation of magmatic-hydrothermal copper-gold deposits. Earth Planet Sci. Lett. 2009, 282, 323–328.
- Shen, P.; Shen, Y.C.; Wang, J.B.; Zhu, H.P.; Wang, L.J.; Meng, L. Methane-rich fluid evolution of the Baogutu porphyry Cu-Mo-Au deposit, Xinjiang, NW China. Chem. Geol. 2010, 275, 78–98.
- Fan, H.R.; Hu, F.F.; Wilde, S.A.; Yang, K.F.; Jin, C.W. The Qiyugou gold-bearing breccia pipes, Xiong’ershan region, central China: Fluid-inclusion and stable-isotope evidence for an origin from magmatic fluids. Intern. Geol. Rev. 2011, 53, 25–45.
- Deng, J.; Wang, Q.F.; Xiao, C.H.; Yang, L.Q.; Liu, H.; Gong, Q.G.; Zhang, J. Tectonic-magmatic-metallogenic system, Tongling ore cluster region, Anhui Province, China. Intern. Geol. Rev. 2011, 53, 449–476.
- Gu, L.X.; Wu, C.Z.; Zhang, Z.Z.; Pirajno, F.; Ni, P.; Chen, P.R.; Xiao, X.J. Comparative study of ore-forming fluids of hydrothermal copper-gold deposits in the lower Yangtze River Valley, China. Intern. Geol. Rev. 2011, 53, 477–498.
- Xu, X.C.; Zhang, Z.Z.; Liu, Q.N.; Lou, J.W.; Xie, Q.Q.; Chu, P.L.; Frost, R.L. Thermodynamic study of the association and separation of copper and gold in the Shizishan ore field, Tongling, Anhui Province, China. Ore Geol. Rev. 2011, 43, 347–358.
- Li, J.X.; Li, G.M.; Qin, K.Z.; Xiao, B. High-temperature magmatic fluid exsolved from magma at the Duobuza porphyry copper-gold deposit, Northern Tibet. Geofluids 2011, 11, 134–143.
- Allan, M.M.; Morrison, G.W.; Yardley, B.W.D. Physicochemical evolution of a porphyry-breccia system: A laser ablation ICP-MS study of fluid inclusions in the Mount Leyshon Au deposit, Queensland, Australia. Econ. Geol. 2011, 106, 413–436.
- Seo, J.H.; Guillong, M.; Heinrich, C.A. Separation of molybdenum and copper in porphyry deposits: The roles of sulfur, redox, and pH in ore mineral deposition at Bingham Canyon. Econ. Geol. 2012, 107, 333–356.
- Soloviev, S.G.; Kryazhev, S.G.; Dvurechenskaya, S.S. Geology, mineralization, stable isotope geochemistry, and fluid inclusion characteristics of the Novogodnee-Monto oxidized Au-(Cu) skarn and porphyry deposit, Polar Ural, Russia. Mineral. Depos. 2013, 48, 603–627.
- Zhang, H.D.; Zhang, H.-F.; Santosh, M.; Li, S.R. Fluid inclusions from the Jinchang Cu–Au deposit, Heilongjiang Province, NE China: Genetic style and magmatic-hydrothermal evolution. J. Asian Earth Sci. 2014, 82, 103–114.
- Siahcheshm, K.; Calagari, A.A.; Abedini, A. Hydrothermal evolution in the Maher-Abad porphyry Cu–Au deposit, SW Birjand, Eastern Iran: Evidence from fluid inclusions. Ore Geol. Rev. 2014, 58, 1–13.
- Nikolaev, Y.N.; Prokof’ev, V.Y.; Baksheev, I.A.; Chitalin, A.F.; Marushchenko, L.I.; Kal’ko, I.A. The First Data on the Zoned Distribution of Fluid Inclusionsin the Ore-Forming System of the Peschanka Gold-Copper-Porphyry Deposit (Northeast Russia). Dokl. Earth Sci. 2014, 459, 1615–1618.
- Simmonds, V.; Calagari, A.A.; Kyser, K. Fluid inclusion and stable isotope studies of the Kighal porphyry Cu–Mo prospect, East-Azerbaijan, NW Iran. Arab. J. Geosci. 2015, 8, 437–453.
- Nikolaev, Y.N.; Baksheev, I.A.; Prokofiev, V.Y.; Nagornaya, E.V.; Marushchenko, L.I.; Sidorina, Y.N.; Chitalin, A.F.; Kal’ko, I.A. Gold–Silver Mineralization in Porphyry–Epithermal Systems of the Baimka Trend, Western Chukchi Peninsula, Russia. Geol. Ore Depos. 2016, 58, 319–345.
- Liu, X.; Fan, H.R.; Hu, F.F.; Yang, K.F.; Wen, B.J. Nature and evolution of the ore-forming fluids in the giant Dexing porphyry Cu–Mo–Au deposit, Southeastern China. J. Geochem. Explor. 2016, 171, 83–95.
- Khomenko, M.O.; Giebsher, N.A.; Tomilenko, A.A.; Bul’bak, T.A.; Ryabukha, M.A.; Semenova, D.V. Phisicochemical parameters and age of the Vasil’kovskoe gold deposit (northern Kazakhstan). Russ. Geol. Geophys. 2016, 57, 1728–1744.
- Bukhanova, D.S.; Plechov, P.Y. Parameters of processes that produced the Malmyzhskoe Au–Cu porphyry deposit: Evidence from fluid inclusions. Her. KRAUNTs 2017, 34, 61–71. (In Russian)
- Gregory, M.J. A fluid inclusion and stable isotope study of the Pebble porphyry copper-gold-molybdenum deposit, Alaska. Ore Geol. Rev. 2017, 80, 1279–1303.
- Kouhestani, H.; Mokhtari, M.A.A.; Chang, Z.; Stein, H.J.; Johnson, C.A. Timing and genesis of ore formation in the Qarachilar Cu-Mo-Au deposit, Ahar-Arasbaran metallogenic zone, NW Iran: Evidence from geology, fluid inclusions, O–S isotopes and Re–Os geochronology. Ore Geol. Rev. 2018, 102, 757–775.
- Wang, D.; Bi, X.; Lu, H.; Hu, R.; Wang, X.; Xu, L. Fluid and melt inclusion study on mineralized and barren porphyries, Jinshajiang-Red River alkali-rich intrusive belt, and significance to metallogenesis. J. Geochem. Explor. 2018, 184, 28–39.
- Zhang, W.; Williams-Jones, A.E.; Leng, C.-B.; Zhang, X.-C.; Chen, W.T.; Qin, C.-J.; Su, W.-C.; Yan, J.-H. The origin of CH4-rich fluids in reduced porphyry–skarn Cu–Mo–Au systems. Ore Geol. Rev. 2019, 114, 103135.
- Soloviev, S.G.; Kryazhev, S.G.; Dvurechenskay, S.S.; Vasyukov, V.E.; Shumilin, D.A.; Voskresensky, K.I. The superlarge Malmyzh porphyry Cu-Au deposit, Sikhote-Alin, eastern Russia: Igneous geochemistry, hydrothermal alteration, mineralization, and fluid inclusion characteristics. Ore Geol. Rev. 2019, 113, 103112.
- Mernagh, T.; Mavrogenes, J. Significance of high temperature fluids and melts in the Grasberg porphyry copper gold deposit. Chem. Geol. 2019, 508, 210–224.
- Lang, X.; Deng, Y.; Wang, X.; Tang, J.; Xie, F.; Yang, Z.; Yin, Q.; Jiang, K. Reduced fluids in porphyry copper-gold systems reflect the occurrence of the wall-rock thermogenic process: An example from the No.1 deposit in the Xiongcun district, Tibet, China. Ore Geol. Rev. 2020, 118, 103212.
- Hanilçi, N.; Bozkaya, G.; Banks, D.A.; Bozkaya, O.; Prokofiev, V.; Öztaş, Y. Fluid inclusion characteristics of the Kışladağ porphyry Au deposit, Western Turkey. Minerals 2020, 10, 64.
- Mernagh, T.; Leys, C.; Henley, R.W. Fluid inclusion systematics in porphyry copper deposits: The super-giant Grasberg deposit, Indonesia, as a case study. Ore Geol. Rev. 2020, 123, 103570.
- Chen, P.; Zeng, Q.; Zhou, L.; Zhou, T. Fluid inclusion evidence for hydrothermal evolution of the Sadaigoumen porphyry Mo deposit on the northern margin of the north China Craton. Ore Geol. Rev. 2021, 134, 104145.
- Roedder, E.; Skinner, B.J. Experimental evidence that fluid inclusions do not leak. Econ. Geol. 1968, 63, 715–730.
- Mavrogenes, J.A.; Bodnar, R.J. Hydrogen movement into and out of fluid inclusions in quartz: Experimental evidence and geologic implications. Geochim. Cosmochim. Acta 1994, 58, 141–148.
More
Information
Subjects:
Geochemistry & Geophysics
Contributors
MDPI registered users' name will be linked to their SciProfiles pages. To register with us, please refer to https://encyclopedia.pub/register
:
View Times:
1.6K
Entry Collection:
Environmental Sciences
Revisions:
2 times
(View History)
Update Date:
05 May 2022
Table of Contents


Notice
You are not a member of the advisory board for this topic. If you want to update advisory board member profile, please contact office@encyclopedia.pub.
OK
Confirm
Only members of the Encyclopedia advisory board for this topic are allowed to note entries. Would you like to become an advisory board member of the Encyclopedia?
Yes
No
${ textCharacter }/${ maxCharacter }
Submit
Cancel
Back
Comments
${ item }
|
${ item.createdUser.fullName }
${ item.createdAt }
${ item.vote }
${ item.reply }
Delete
${ reply.createdUser.fullName }
${ reply.createdAt }
${ reply.vote }
Delete
There is no reply to this comment~
${ item.replyTextCharacter }/${ item.replyMaxCharacter }
Submit
Cancel
More
No more~
There is no comment~
${ textCharacter }/${ maxCharacter }
Submit
Cancel
${ selectedItem.replyTextCharacter }/${ selectedItem.replyMaxCharacter }
Submit
Cancel
Confirm
Are you sure to Delete?
Yes
No