Your browser does not fully support modern features. Please upgrade for a smoother experience.
Submitted Successfully!
 +1 credit
Thank you for your contribution! You can also upload a video entry or images related to this topic.
For video creation, please contact our Academic Video Service.
| Version | Summary | Created by | Modification | Content Size | Created at | Operation |
|---|---|---|---|---|---|---|
| 1 | Luca Pasquini | -- | 3383 | 2022-04-20 16:36:16 | | | |
| 2 | Vivi Li | -19 word(s) | 3364 | 2022-04-21 06:01:12 | | | | |
| 3 | Vivi Li | Meta information modification | 3364 | 2022-04-21 06:06:47 | | |
Video Upload Options
We provide professional Academic Video Service to translate complex research into visually appealing presentations. Would you like to try it?
Cite
If you have any further questions, please contact Encyclopedia Editorial Office.
Pasquini, L.; Napolitano, A.; , .; Lucignani, M.; Dellepiane, F.; Visconti, E. In Vivo Brain Glutathione. Encyclopedia. Available online: https://encyclopedia.pub/entry/22036 (accessed on 23 July 2026).
Pasquini L, Napolitano A, , Lucignani M, Dellepiane F, Visconti E. In Vivo Brain Glutathione. Encyclopedia. Available at: https://encyclopedia.pub/entry/22036. Accessed July 23, 2026.
Pasquini, Luca, Antonio Napolitano, , Martina Lucignani, Francesco Dellepiane, Emiliano Visconti. "In Vivo Brain Glutathione" Encyclopedia, https://encyclopedia.pub/entry/22036 (accessed July 23, 2026).
Pasquini, L., Napolitano, A., , ., Lucignani, M., Dellepiane, F., & Visconti, E. (2022, April 20). In Vivo Brain Glutathione. In Encyclopedia. https://encyclopedia.pub/entry/22036
Pasquini, Luca, et al. "In Vivo Brain Glutathione." Encyclopedia. Web. 20 April, 2022.
Copy Citation
Glutathione (GSH) is an important antioxidant implicated in several physiological functions, including the oxidation−reduction reaction balance and brain antioxidant defense against endogenous and exogenous toxic agents. Altered brain GSH levels may reflect inflammatory processes associated with several neurologic disorders. An accurate and reliable estimation of cerebral GSH concentrations could give a clear and thorough understanding of its metabolism within the brain, thus providing a valuable benchmark for clinical applications.
glutathione (GSH)
magnetic resonance spectroscopy (MRS)
neurological disorders
1. Introduction
Glutathione (GSH) is an antioxidant metabolite originating from glutamic acid (Glu), cysteine (Cys), and Glycine (Gly) amino acids, globally present in all mammalian cells [1]. Among its many roles, GSH is mainly implicated in oxidation−reduction reactions, acting as a protector against endogenous and exogenous toxic agents like reactive oxygen species (ROS) and reactive nitrogen species (RNS) [2]. Changes in the GSH brain concentration from oxidative stress may reflect inflammatory processes and mitochondrial dysfunction associated with biological aging [3] and pathological conditions [4][5]. In particular, as high levels of ROS may lead to cerebral tissue damage, the altered GSH concentration of specific brain areas has been described in several neurologic disorders, including epilepsy [6][7], multiple sclerosis [8][9], Alzheimer’s disease [10], Parkinson’s disease [11][12], and psychiatric disorders [13][14][15][16]. In order to provide a clear and thorough understating of GSH metabolism within the brain, an accurate and reliable estimation of cerebral concentrations needs to be performed. The quantification of GSH brain levels was first attempted ex vivo from autoptic specimens, by means of liquid chromatography with UV detection and spectroscopic techniques [17][18][19]. GSH biosynthesis and metabolism were also tested in vitro, where different cell culture models were investigated to assess oxidative stress levels from blood and cerebrospinal fluids [20][21]. More recently, in vivo GSH measurements were obtained using proton magnetic resonance spectroscopy (MRS), a powerful non-invasive technique for brain metabolite quantification. Although widely used for GSH detection in both animals and humans [22], MRS presents several technical challenges, mostly related to the low GSH brain concentration and severe spectral overlapping between metabolites with different peak intensities [23]. Many MRS techniques have been developed for GSH concentration assessment, with a high methodologic heterogeneity, which may limit a comparative evaluation of the results provided by different studies. For this reason, the literature is still lacking a comprehensive and detailed description of the GSH normal levels within different specific brain areas. This information appears crucial for the interpretation of GSH findings in the normal brain and neurologic disorders, providing a valuable benchmark for clinical applications.
2. GSH Metabolism
GSH is abundant in the brain, with a high concentration in non-neuronal cells, mostly neuropil and white matter tracts, with the exception of some cerebellar neurons, such as granule cells and Purkinje cells [22]. Within the brain, GSH is synthesized from the essential amino acids Glu, Cys, and Gly in a two-step reaction catalyzed by ATP-dependent enzymes. In the first step, Glu is combined with Cys by γ-glutamylcysteine synthetase (or glutamate−cysteine ligase (GCL) EC 6.3.2.2) to form γ-Glu−Cys. This dipeptide is further combined with Gly by glutathione synthetase (GS; EC 6.3.2.3) to produce GSH [1]. GSH catabolism is realized through hydrolysis by γ-glutamyltransferase (γGT; EC 2.3.2.2), which is located in the cell membranes of many cells throughout the body. In the brain, γGT is located in non-neuronal cells, mostly ependymal cells, and secondarily in Schwann and glial cells [22]. GSH metabolism is summarized in Figure 1. GSH fulfills its antioxidant role through two main mechanisms: (1) direct non-enzymatic reaction with free radicals such as superoxide (O2−), NO, or hydroxide (OH−), and by (2) acting as a reducing agent in the presence of glutathione peroxidase (GP), by donating an electron to H2O2, leading to the formation of H2O, O2, and glutathione disulfide (GSSG) [1]. In turn, glutathione reductase (GR) regenerates GSH by transferring an electron from NADPH to GSSG (Figure 1). This enzyme is mostly expressed in oligodendrocytes, microglia, and neurons, with a lower expression in astrocytes [22]. Another major role of GSH is the detoxification and removal of xenobiotics and other endogenous compounds, that are conjugated with GSH by glutathione-S-transferase to be exported from the cell through multidrug resistance pumps (MRPs), the main GSH transporters [22][24]. Furthermore, GSH is a cofactor of various enzymes. For example, the glyoxalase enzyme system catalyzes the detoxification of ketoaldehyde methylglyoxal (a very reactive molecule that mediates protein denaturation) to D-lactate with the participation of GSH [22].
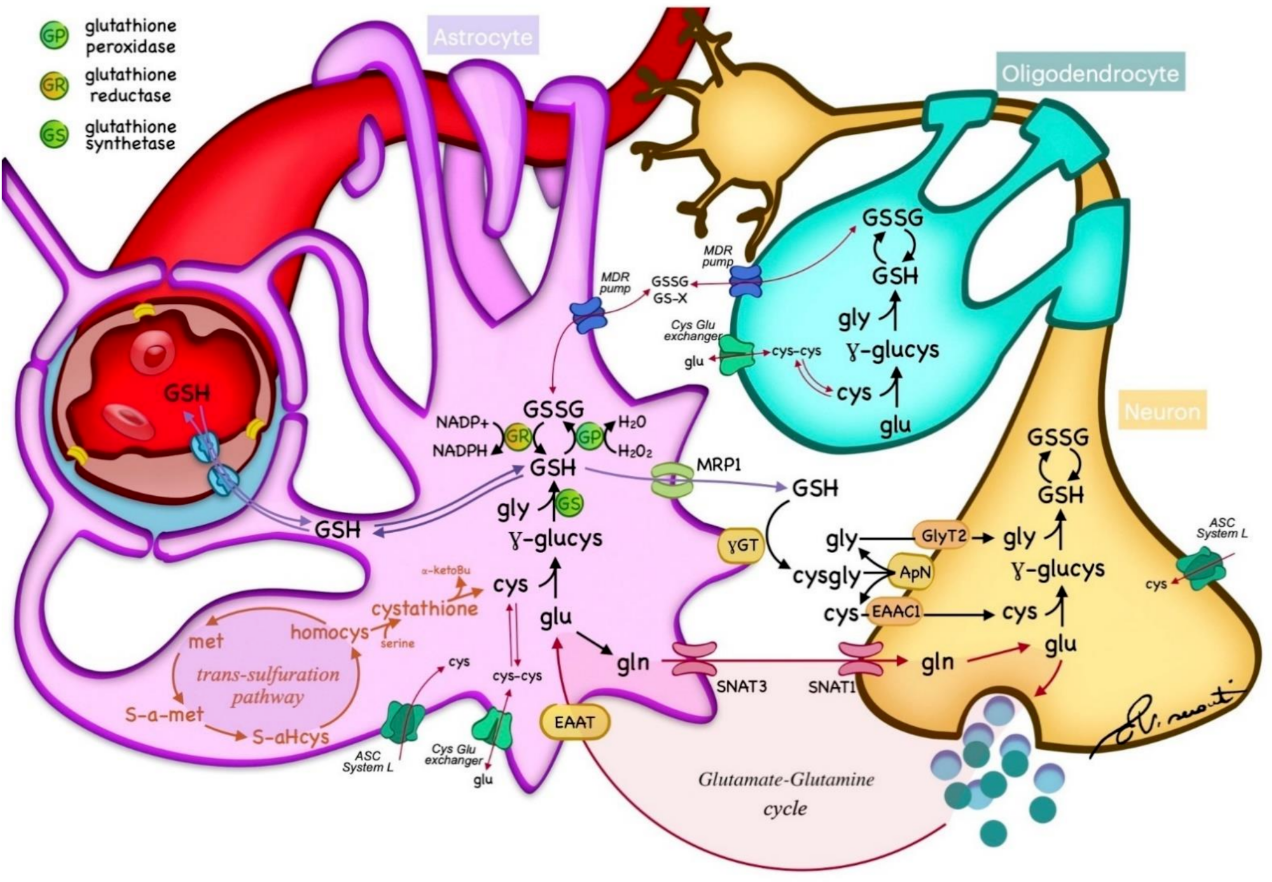
Figure 1. Glutathione (GSH) metabolism within the nervous tissue. GSH is synthesized in the cytoplasm of neurons and glia from essential amino acids, and catabolized through hydrolysis in the cell membranes. GSH acts as a reducing agent by donating an electron to H2O2, leading to the formation of H2O, O2, and glutathione disulfide (GSSG), which is regenerated by glutathione reductase (GR) from NADPH. The transportation of GSH and essential metabolites is regulated by different transporters across cell membranes. Cys—cysteine; glu—glutamate; gln—glycine; met—methionine; homocys—homocysteine; MPR—multidrug resistance pump; γGT—γ-glutamyltransferase; γ-glucys—γ-glutamylcysteine; EAAT—excitatory amino acid transporter; SNAT—sodium-coupled neutral amino acid transporter; ASC—alanine, serine, and cysteine transport system.
3. Brain Areas GSH Concentration and MRS techniques
The MRS acquisition sequence used to sample brain GSH 'in vivo' is a decisive step, as the metabolite concentrations could be different when selecting edited or unedited techniques. Dhamala showed strongly correlated GSH measures between SPECIAL and PRESS techniques, while a weak correlation occurred between MEGA-PRESS and both SPECIAL and PRESS [25]. Similarly, Nezhad reported a significant difference in GSH concentration estimates when comparing MEGA-PRESS with PRESS [26]. Moreover, the study showed more sensibility in edited (MEGA-PRESS) compared with unedited sequences (PRESS) when identifying differences between two brain area concentrations (i.e., anterior cingulate cortex and occipital cortex) only with MEGA-PRESS. As GSH detection has the potential to provide a better understanding of the oxidation−reduction balance in the human brain, several examples of both edited and unedited techniques have been reported in the literature, where VOI were placed in different brain areas, with sizes ranging from 15 mm3 [27] to 30 cm3 [9][28]. A comprehensive description of the GSH detection studies has been reported. Researchers reported GSH concentration within the different brain areas investigated for HC subjects found in the literature (Table 1). Particularly, Table 1 reports the number of HC participants and the corresponding mean age, together with the main evidence found for each study. The definition of standard reference GSH values within the different brain areas reported could lead to a better interpretation of the altered GSH levels recorded in subjects with neurological disorders, with insight into the possible role of GSH as a biomarker and therapeutic target. Referring to the reliability previously discussed and the sensibility of MEGA-PRESS, the most reliable GSH detected values were those of studies that used this technique in brain area analysis through a comparison between groups and in clinical applications [3][10][29][30][31][32][33][34][35][36][37][38].
Table 1. Number of healthy control subjects, the corresponding age, and GSH concentration measured in the brain areas, type of scanner, method, site of voxels for the GSH measurements, and the results reported in the studies.
| Ref | HC Participants | Age (Range or Mean ± SD) |
Scanner | Method | Site of Detection (VOI Dimension and Brain Area) |
GSH Concentration (HC) | Results |
|---|---|---|---|---|---|---|---|
| [39] | Phantoms | 3 T GE + 8 channels head coil | Edited: MEGA-PRESS TR/TE = 1800/131 ms + LCModel Unedited: PRESS TR/TE = 3000/30 ms + LCModel |
MEGA-PRESS appears more precise at a lower GSH concentration | |||
| [40] | Phantoms + 10 HC | 26 ± 3.3 | 3 T Siemens + 32 channels head coil | Edited: MEGA-PRESS TR/TE = 2000/120 ms + Gannet Unedited: PRESS TR/TE = 2000/30 ms SPECIAL TR/TE = 2000/8 ms PR-STEAM TR/TE = 2000/6.5 ms + LCModel |
24 cm3 in MFC | MEGA-PRESS 1.87 ± 0.36 mM PRESS: 1.69 ± 0.13 mM SPECIAL = 2.3 ± 027 mM PR-STEAM: 2.29 ± 0.16 mM |
Reliability comparison shows more reproducible GSH measurements for unedited sequences (only for highest values, above 3 mM) |
| [23] | Phantoms + 5 HC | 24–36; 30 ± 3 |
3 T Siemens + 32 channels head coil | Unedited: PRESS TR/TE = 2000/30 ms + CNN for GSH quantification | 20 × 20 × 20 mm3 in left FC | GSH/tNAA = ~0.07–0.15 | Implementation of a robust method for GSH quantification in MRS using CNN |
| [41] | Phantoms + 4 HC | 30–45 | 7 T Siemens + 32 channels head coil | Unedited: 2D-COSY TR/TE = 2000/20 ms | 25 × 25 × 25 mm3 in OC | GSH/Cr = 0.05 ± 0.01 | Non-uniformly weighted sampling (NUWS) sequences produced a higher SNR |
| [42] | Phantoms + 13 HC | 28 ± 9 | 3 T Magnex Scientific | Edited: Multiple Quantum Chemical Shift Imaging + Levenberg−Marquardt least square minimization algorithm | 40 × 40 × 40 mm3 in FPC | 1.2 ± 0.16 mmol/Kg | DQC filtering-based chemical shift imaging of GSH at 3T implementation |
| [43] | Phantoms + 6 HC | 34 ± 13 | 3 T Siemens/Philips/GE/Canon + 32 channels head coil | Edited: MEGA-PRESS TR/TE = 2000/80 ms + Gannet | 27 cm3 in MCC | GSH/Cr = 0.045 ± 0.013 (Philips scanner) GSH/Cr = 0.051 ± 0.007 (Siemens scanner) |
In vivo GSH/Cr ratio shows relatively low variations between scanners using the universal sequence |
| [44] | Phantoms + 10 HC | 32.6 ± 8.8 | 3 T Philips + 32 channels head coil | Edited: MEGA-PRESS TR/TE = 2000/120 ms MEGA-PRIAM TR/TE = 2000/120 ms + Gannet |
33 × 33 × 33 mm3 in left and right FC | MEGA-PRESS: 2.61 ± 0.50 i.u. (left FC) 2.95 ± 0.65 i.u. (right FC) MEGA-PRIAM 2.44 ± 0.60 i.u. (left FC) 2.81 ± 0.67 i.u. (right FC) |
No significant difference between MEGA-PRESS and MEGA-PRIAM in GSH estimates |
| [45] | Phantoms + 5 HC + simulations | 31 ± 8 | 3 T Philips + 32 channels head coil | Edited: MEGA-PRESS TR/TE = 2000/120 ms + Gannet | 36 × 36 × 36 mm3 in midline PC | GSH integrals normalized by the sum of the integrals from each subject averaged across all subjects ~0.4–0.5 |
TE of 120 ms appears to be optimal for in vivo GSH detection |
| [26] | Phantoms + 7 HC | 23–35 | 3 T Philips + 8 channels head coil | Edited: MEGA-PRESS TR/TE = 2000/130 ms + AMARES Unedited: PRESS TR/TE = 2000/35 ms + jMRUI |
40 × 25 × 25 mm3 in ACC and 30 × 30 × 30 mm3 in OC | MEGA-PRESS: 3.2 ± 0.6 mM (ACC) 1.4 ± 0.4 mM (OC) PRESS: 2.8 ± 0.3 mM (ACC) 2.5 ± 0.7 mM. (OC) |
Physiological concentrations (<4 mM) of GSH cannot be reliably quantified from PRESS spectra at 3 T |
| [46] | Phantoms + 9 HC | 25 | 4 T Varian INOVA | Edited: MEGA-PRESS TR/TE = 4000/60 ms + LCModel | 30 × 30 × 30 mm3 in OC | 1.3 ± 0.2 µmol/g | GSH concentration estimation |
| [47] | Phantoms + 2 HC | 18–32 | 1.5 T Philips | Edited: DQC Unedited: PRESS |
15.6–17.4 cm3 | DQC filter for the selective in vivo detection of GSH in the human brain presentation | |
| [48] | Phantoms + 10 HC | 34.7 ± 8.8 | 3 T Philips + 32 channels head coil | Edited: MEGA-PRESS TR/TE = 2000/80 ms HERMES TR/TE = 2000/80 ms + Gannet |
30 × 30 × 30 mm3 in Ins | SNR of the HERMES spectra is similar to those of MEGA-PRESS, with the benefit of saving half the acquisition time |
|
| [49] | Phantoms + 6 HC + simulations | N.D | 7 T Philips | Unedited: asymmetric PRESS TE1/TE2 = 37/63 ms STEAM TR/TE = 2500/14–74 ms + LCModel |
25 × 30 × 30 mm3 in MPFC | Optimization of the TE delays in asymmetric PRESS enables the separation of GSH without editing | |
| [50] | Phantoms + 8 HC + simulations | 32 ± 11 | 7 T Siemens + 32 channels head coil | Unedited: asymmetric PRESS TR/TE = 3000/3.9 ms | 20 × 20 × 20 mm3 in MPFC and FC | GSH/tCr = 0.216 ± 0.02 (MPFC) GSH/tCr = 0.27 ± 0.03 (FC); | Glu and Gln higher in GM. GSH and Gln have a similar concentration (20–27% of Cr) |
| [51] | 6 HC | 22–26 | 3 T/7 T Siemens | Unedited: SPECIAL TR/TE = 4000/6 ms + LCModel | 20 × 20 × 20 mm3 in OC | 1.4 ± 0.11 mmol/Kg (3 T); 1.3 ± 0.2 mmol/Kg (7 T) | SPECIAL with ultrashort TEs resulted in a high SNR and allow to reduce RF power requirements and improve chemical shift displacement errors |
| [25] | 15 HC | 24.9 ± 3.5 | 3 T Siemens + 32 channels head coil | Edited: MEGA-PRESS TR/TE = 3200/68 ms + LCModel Unedited: SPECIAL TR/TE = 3200/8.5 ms + LCModel |
30 × 30 × 20 mm3 in DLPC and M1 | MEGA-PRESS: 0.5–3 mmol/L (M1) 3–4 mmol/L (DLPC) SPECIAL: 1.3–2.4 mmol/L (M1 and DLPC) |
GSH levels detected with reasonably good precision using SPECIAL, but poor precision using MEGA-PRESS |
| [27] | 21 HC | 32.2 ± 8.1 | 3 T Siemens + quadrature head coil | Unedited: SPECIAL TR/TE = 3000/6 ms + LCModel | 15 × 15 × 15 mm3 in left A | 1.03 ± 0.38 mmol/L (CRLBs: 24 ± 11 only in 16/21 HC) | Only in a small portion of the acquired spectra GSH passed the CRLB threshold of 20% |
| [52] | 18 HC | N.D. | 3 T Siemens | Unedited: PRESS TR/TE = 2000/30 ms + LCModel | 25 × 25 × 15 mm3 in SMA | ~2.2–2.6 mmol/Kg | No difference in GSH concentration recorded between HC and PSP |
| [53] | 22 HC | 12–14 | 3 T Siemens | Unedited: 2D J-resolved PRESS TR/TE = 2000/22 ms + LCModel | 20 × 20 × 30 mm3 in RACC | GSH variation factor results of 8.6 ± 4.1%, significant Pearson correlation (0.821) resulted between test and retest | |
| [54] | 63 HC | 40–60 | 3 T Siemens | Unedited: 2D J-resolved MRS TR/TE = 2000/31–229 ms + ProFit | 19 cm3 in RACC | GSH/H20 = 0.003–0.004 | GSH significantly increased for HC receiving supplements when compared with the placebo |
| [9] | 5 HC | 32 ± 8 | 7 T Agilent + 8 channels head coil | Edited: JDE semi-LASER TR/TE = 3200/72 ms + LCModel Unedited: STEAM TR/TE = 3000/10 ms + LCModel |
30 × 30 × 30 mm3 for JDE semi-LASER and 20 × 20 × 20 mm3 for STEAM in midline OC | 1.34 ± 0.13 mM (JDE semi-LASER) 2.15 ± 0.16 mM (STEAM) |
Better reliability results (in terms of Coefficient of variation CV) for JDE semi-LASER when compared to STEAM |
| [55] | 21 HC | Neonates | 1.5 T GE | Unedited: PRESS TR/TE = 3000/20 ms + LCModel | 29 × 10 × 11 mm3 in WM; 11 × 24 × 11 in Th; 22 × 13 × 15 in GM | 2.1 ± 0.7 mmol/Kg (WM) 2.4 ± 0.8 mmol/Kg (Th) 2.5 ± 0.5 mmol/Kg (GM) |
Absolute brain GSH content in premature infants at term was not considerably different from that in fullterm infants |
| [28] | 5 HC | 25–32 | 3 T Siemens + quadrature head coil | Edited: DQF TR/TE = 3000/70 ms | 30 × 30 × 30 mm3 in left and right PC | 0.91 ± 0.16 mM (left PC) 0.89 ± 0.16 mM (right PC) | Sequence shown to be invariant to phase difference between excitation and DQF generating pulse. |
| [56] | 10 HC | 26.1 ± 9 | 3 T Siemens | Unedited: STEAM TR/TE = 2000/6.5 ms + LCModel | 6 cm3 in ACC and PCC | 2.74 ± 0.2 i.u. (ACC) 2.07 ± 0.0025 i.u. (PCC) |
Good reliability results in terms of coefficient of variation CV (<10%) |
| [57] | 60 HC | 60–85 | 3 T Siemens | Edited: Multiple Quantum Chemical Shift Imaging + Levenberg−Marquardt least square minimization algorithm | 50 × 50 × 30 mm3 in FC and PC | 1.27 ± 0.32 mmol/Kg (FC) 1.28 ± 0.27 mmol/Kg (PC) |
glutathione concentrations in brain regions were positively correlated with milk servings |
| [58] | 18 HC | Neonates | 3 T Philips | Edited: HERMES TRT/E = 2000/80 ms + Gannet | 31 × 25 × 20 mm3 in Th and ACC | 0.55–0.7 i.u. (ACC) 0.5–0.58 i.u (Th) |
lower GSH levels in Th compared to the ACC and higher GSH levels in the ACC following tissue-correction |
| [59] | 20 HC | 21–35; 29 ± 5 |
3 T Philips + 32 channel head coil | Edited: HERMES TRT/E = 2000/80 ms + LCModel | 25 × 25 × 25 mm3 in MACC | GSH/tCr = 0.18 ± 0.04 | HERMES showed to be more sensitive to motion, as variability of spectral quality measures were observed for GSH when only retrospective outlier removal was applied. |
| [60] | 40 HC | 3 T Philips | Edited: HERMES TRT/E = 2000/80 ms + Gannet | Ranging from 30 × 30 × 30 to 36 × 36 × 36 mm3 in medial PC | The multi step Frequency and Phase Correction approach (msFPC) results in improved correction of frequency/phase errors in multiplexed GABA-/GSH-edited MRS experiments. | ||
| [61] | 67 HC | 8–12 | 3 T Philips | Edited: HERMES TR/TE = 2000/80 ms + Gannet | 30 × 30 × 30 mm3 in right SM, SMA, and right Ins | 0.56 ± 0.14 i.u. (SM) 0.57 ± 0.15 i.u. (SMA) 0.69 ± 0.19 i.u. (Ins) |
Robust Spectral Registration (rSR) reduced more subtraction artifacts than the multistep method |
| [62] | 12 HC | 25 ± 2.5 | 3 T Siemens + 32 channel head coil | Edited:MEGA-PRESS TR/TE = 2000/120 ms HERMES TRT/E = 2000/80 ms + Gannet |
30 × 25 × 25 mm3 in DACC | 1.96 ± 0.49 i.u. (MEGA-PRESS) 3.95 ± 0.44 i.u. (HERMES) |
MEGA-PRESS provide more reproducible GSH (in terms of CV%) quantification compared to HERMES |
| [63] | 4 HC | 47.3 ± 5.6 | 3 T GE | Edited: MEGA-PRESS TR/TE = 2000/80 ms | 30 × 30 × 30 mm3 in PC | 2 mM | Phantoms confirm GSH MEGA-PRESS signal and that GSSG would be undetectable at concentrations expected in vivo |
| [64] | 9 HC | 23 | 4 T Varian INOVA | Edited: DWE with MEGA-PRESS TR/TE = 4500/112 ms + LCModel | 30 × 30 × 30 mm3 in midsagittal OC | 0.8 ± 0.1 µmol/g | Double editing did not compromise sensitivity |
| [3] | 44 HC (22 young + 22 elderly) | Young = 20.4 ± 1.4 Elderly = 76.6 ± 6.1 |
4 T Varian INOVA | Edited: DWE with MEGA-PRESS TR/TE = 4500/122 ms + LCModel | 30 × 30 × 30 mm3 in midsagittal OC | Young = 0.31 ± 0.05 i.u. Elderly = 0.20 ± 0.08 i.u. |
Elderly subjects had a lower GSH concentration than younger subjects |
| [32] | 12 HC | 4 T Varian INOVA | Edited: DWE with MEGA-PRESS TR/TE = 4500/102 ms + LCModel | 30 × 30 × 30 mm3 in OC | 0.7–0.9 µmol/g | GSH concentration remains costant after intravenous vitamin C infusion | |
| [29] | 11 HC | 61.5 ± 10.5 | 3 T GE + 8 channels head coil | Edited: MEGA-PRESS TR/TE = 1500/68 ms + in-house software developed in MATLAB | 20 × 25 × 25 mm3 in PG and MC | GSH/W = 1.6 ± 0.4 × 10⁻³ i.u. (MC) | Significantly lower GSH in ALS patients when compared with HC |
| [31] | 11 HC | 30 ± 11 | 3 T Philips | Edited: MEGA-PRESS TR/TE = 2000/131 ms | 50 × 30 × 30 mm3 in PC | 1.20 ± 0.14 mM | Optimal TE = 130 ms. Stroke patients not significantly different from HC |
| [65] | 10 HC | 18–65 | 3 T | Edited: MEGA-PRESS TR/TE = 1500/68 ms | 30 × 30 × 20 mm3 in OC | Anhedonia and GSH negatively correlated | |
| [66] | 13 HC | 18–45 | 3 T GE | Edited: MEGA-PRESS TR/TE = 1500/68 ms | 30 × 30 × 20 mm3 in OC | No differences between HC and CFS patients | |
| [34] | 44 HC (25 males and 19 females) | 23.6 ± 2.1 | 3 T Philips | Edited: MEGA-PRESS TR/TE = 2500/120 ms | 2.5 cm3 in FC PC, Hyp and C | ~20–22 a.u. (FC females) ~15–22 a.u. (FC males) ~30 a.u. (PC females) ~17–25 a.u. (PC males) ~15 a.u. (Hyp females) ~15 a.u. (Hyp males) ~14–17 a.u. (C females) ~10–15 a.u. (C males) |
Higher GSH in young, gender matched parietal cortex hippocampus vs. older patients |
| [10] | 21 HC | 65 ± 5 | 3 T Philips | Edited: MEGA-PRESS TR/TE = 2500/120 ms + KALPANA | 15–16 cm3 in FP Hyp | 1.12 ± 0.18 mmol/L (FC) 1.02 ± 0.17 mmol/L (Hyp) |
Significant reductions in GSH in both the frontal cortex and hippocampus in disease |
| [35] | 17 HC | 38.8 ± 13.1 | 3 T GE | Edited: MEGA-PRESS TR/TE = 1800/68 ms + LCModel | 25 × 40 × 30 mm3 in DLPC 28 × 30 × 25 mm3 in ACC |
GSH/Cr = 0.11 ± 0.03 (ACC) GSH/Cr = 0.11 ± 0.03 (left DLPC); |
Higher GSH in patients |
| [30] | 16 HC | 21–41; 30 ± 7.2 | 3 T GE + standard quadrature coil | Edited: MEGA-PRESS TR/TE = 1500/94 ms + GE software | 28 × 30 × 22 mm3 in PMPC | 0.928 ± 0.24 mM | No significant differences between GSH concentration of HC and patients |
| [3] | 14 HC | 32 ± 10 | 7 T Magnex Scientific | Unedited: STEAM TR/TE = 5000/8 ms + LCModel | Ranging from 6 × 6 × 13 to 20 × 20 × 20 mm3 in FWM, LS, PCC, OC, P, SN, and CV | Ranging from 0.50 ± 0.1 μmol/g (OC) to 1.2 ± 0.2 μmol/g (CV) | Lower GSH concentration in elderly subjects than in younger subjects |
| [67] | 10 HC | 25 ± 3 | 7 T Philips + 16 channels head coil | Unedited: STEAM TR/TE = 3000/15 ms + LCModel | 20 × 20 × 20 mm3 in OC | 2.28 ± 0.1 µmol/g | GSH increased during visual stimulation |
| [68] | 10 HC | 20 ± 3 | 4 T Varian INOVA | Edited: MEGA-PRESS TR/TE = 4500/68 ms + LCModel Unedited: STEAM TR/TE = 4500/5 ms + LCModel |
17 cm3 in ACC and 8 cm3 in OC | 1.6 ± 0.4 µmol/g (ACC) 1.6 ± 0.2 µmol/g (OC) |
Validation of glutathione quantitation from the STEAM spectra |
| [7] | 10 HC | 20–70; 39.2 ± 15.3 |
7 T Siemens + 32 channels head coil | STEAM TR/TE = 8500 (9 subjects)−9300 (1 subject)/6 ms + LCModel | 20 × 20 × 20 mm3 in PCC/precuneus | 1.9 ± 0.3 mmol/L | GSH levels higher in IGE (idiopathic generalized epilepsy) compared with HC |
| [69] | 8 HC | 19–53; 28.4 ± 10.7 |
1.5 T Philips + birdcage head coil | PRESS + DCQ (double quantum coherence) filtering | 25 × 25 × 25 cm3 POC | GSH/H2O = 2.3 ± 0.9 × 10⁻⁵ (right POC) 2.5 ± 1.2 × 10⁻⁵ (left POC) |
GSH/water ratio significantly reduced in both hemisphere Ins epileptic patients compared with HC |
| [70] | 7 HC | 6–17 | 3 T Siemens + 32 channels head coil | PRESS TR/TE = 1980/30 ms + LCModel | variable from 3 to 8 cm3 in the right gangliocapsular region | 2.0 ± 0.5 mM | Higher levels of brain GSH in KD patients compared with HC |
| [71] | 17 HC | 7 T and 3 T Siemens + 16 channels head coil (7 T) | MEGA-PRESS TR/TE = 2000/68 ms | 3.5 × 2.5 × 2.3 cm3 in left or right M1 (3 T and 7 T) and pons (3 T) | No significative difference in brain GSH between ALS patients and HC using 3 T scanner | ||
| [29] | 11 HC | 58.5 ± 6.6 | 3 T GE + 8 channels head coil | PRESS with J-edited spin echo method TR/TE 1500/68 ms | single voxel on primary motor cortex (M1) | GSH/H2O = 1.6 ± 0.5 × 10⁻³ GSH/Cr 1.9 ± 0.8 × 10⁻² |
Reduced GSH in ALS patients compared with HC |
| [72] | 15 HC | 55–75 | 3 T GE + 8 channels head coil | PRESS with J-edited spin echo method TR/TE 1500/68 ms | 2.5 × 2.5 × 2.5 cm3 PCC and precuneus | GSH reduction with increased levels of amyloidosis | |
| [34] | 85 HC | males 26.4 ± 3.0; females 23.6 ± 2.1 |
3 T Philips + 32 channels head coil | MEGA-PRESS TR/TE = 2500/120 ms | 2.5 × 2.5 × 2.5 cm3 in several brain regions | Female HC have higher GSH levels compared to male HC with a specific distribution pattern | |
| [73] | 29 HC | 18–50 | 3 T GE | PRESS TR/TE = 3000/30 ms + LCM model | 20 × 20 × 15 mm3 in BG and 16 × 24 × 20 mm3 in DMPFC | 2–3 mM (DMPFC and BG) | No difference between GSH levels in ASD patients and HC |
| [37] | 40 HC | 18–30 | 3 T Philips + 32 channels head coil | MEGA-PRESS TR/TE = 2048/68 ms | 3 × 3 × 3 cm3 in five different regions (OC, left/right MT, TC, and PC) | Occipital 6.91 (0.68) i.u. Left MT+ 5.51 (0.86) i.u. Right MT+ 6.59 (0.67) i.u. Temporal 7.17 (0.93) i.u. Parietal 5.17 (0.59) i.u |
No difference in GLX metabolites between ASD patients and HC |
| [15] | 12 HC | 50–84; 61.5 ± 4.9 | 3 T GE + 8 channel head coil | PRESS TR/TE = 2000/35 ms + LCModel | 20 × 20 × 20 mm3 in ACC | GSH/Cr = 0.22 ± 0.06 | Increased GSH in patients with depressive symptoms |
| [74] | 17 HC | 20–29 | 3 T GE + 8 channel head coil | PRESS TR/TE = 2000/35 ms + LCModel | 20 × 20 × 20 mm3 in ACC | 1.47 ± 0.47 i.u. | Less GSH in the ACC of patients with high risk of alcohol abuse |
| [14] | 49 HC | 18–30 | 3 T GE + 8 channel head coil | PRESS TR/TE = 2000/35 ms + LCModel | 20 × 20 × 20 mm3 in ACC and 1.5 × 3.0 × 1.0 in left Hyp | Decreased ACC-GSH with tobacco use in patients with bipolar disorder. No differences in GSH levels with alcohol use | |
| [75] | 25 HC | 3 T GE + 8 channel head coil | PRESS TR/TE = 2000/35 ms + LCModel | 320 × 20 × 20 mm3 in ACC | Distinct neurometabolic profiles are evident in young people with major psychiatric disorders | ||
| [24] | 45 HC | 7 T Philips | STEAM TR/TE = 2000/17 ms + LCModel | 20 × 18 × 25 mm3 in ACC, 40 × 12 × 18 mm3 in left Ins, 20 × 22 × 20 mm3 in OC | 1.75 ± 0.31 mM (ACC) 1.72 ± 0.20 mM (left Ins) 1.5 ± 0.17 mM (OC) |
Reduced GSH in ACC of patients with schizophrenia | |
| [76] | 25 HC | 34.0 ± 12.3 | 3 T Siemens + 32 channels head coil | 2DJ PRESS | 20 × 20 × 20 mm3 in PCC | GSH/Cr = 0.25 | Lower GSH/Cr in PCC of patients with obsessive compulsive disorder |
| [33] | 26 HC | 22.77 ± 4.05 | 3 T GE + 8 channel head coil | MEGA-PRESS TR/TE = 1500/68 ms | 20 × 40 × 30 mm3 in MPFC | GSH/H2O = 0.0015–0.0018 | No difference in GSH levels between HC and patients at a clinical high risk for psychosis |
| [36] | 9 HC | 22.56 ± 2.35 | 3 T GE + 8 channel head coil | MEGA-PRESS TR/TE = 1500/68 ms | 4.5 × 2.5 × 2.5 mm3 in striatum | GSH/H2O = 1.10 ± 0.10 × 10⁻³ | Striatal GSH deficit in patients with a first episode of psychosis |
| [35] | 17 HC | 40.4 ± 12.3 | 3 T GE + 8 channel head coil | MEGA-PRESS TR/TE = 1800/68 ms + LCModel | 28 × 30 × 25 mm3 in ACC and 25 × 40 × 30 mm3 in DPLFC | GSH/Cr = 0.11 ± 0.03 (ACC) | Higher GSH levels in PTSD patients |
| [77] | 41 HC | 56–80; 68.7 ± 5.8 | 3 T GE + 8 channel head coil | PRESS TR/TE = 2000/35 ms + LCModel | 20 × 20 × 20 mm3 in ACC | Elevated ratios of GSH in subjects with mild cognitive impairment | |
| [78] | 18 HC | 15–29 | 3 T GE | PRESS TE 30 ms + LCModel | 2 cm in both TC | 1.5–2 mM | GSH levels significantly higher in patients with a first episode of psychosis |
References
- Dwivedi, D.; Megha, K.; Mishra, R.; Mandal, P.K. Glutathione in Brain: Overview of Its Conformations, Functions, Biochemical Characteristics, Quantitation and Potential Therapeutic Role in Brain Disorders. Neurochem. Res. 2020, 45, 1461–1480.
- Dasari, S. Glutathione S-transferases Detoxify Endogenous and Exogenous Toxic Agents- Minireview. J. Dairy Vet. Anim. Res. 2017, 5, 157–159.
- Emir, U.E.; Raatz, S.; Mcpherson, S.; Hodges, J.S.; Torkelson, C.; Tawfik, P.; White, T.; Terpstra, M. Noninvasive quantification of ascorbate and glutathione concentration in the elderly human brain. NMR Biomed. 2011, 24, 888–894.
- Bains, J.S.; Shaw, C.A. Neurodegenerative disorders in humans: The role of glutathione in oxidative stress-mediated neuronal death. Brain Res. Rev. 1997, 25, 335–358.
- Schulz, J.B.; Lindenau, J.; Seyfried, J.; Dichgans, J. Glutathione, oxidative stress and neurodegeneration. Eur. J. Biochem. 2000, 267, 4904–4911.
- Cárdenas-Rodríguez, N.; Coballase-Urrutia, E.; Pérez-Cruz, C.; Montesinos-Correa, H.; Rivera-Espinosa, L.; Sampieri, A.; Carmona-Aparicio, L. Relevance of the glutathione system in temporal lobe epilepsy: Evidence in human and experimental models. Oxid. Med. Cell. Longev. 2014, 2014, 759293.
- Gonen, O.M.; Moffat, B.A.; Desmond, P.M.; Lui, E.; Kwan, P.; O’Brien, T.J. Seven-tesla quantitative magnetic resonance spectroscopy of glutamate, γ-aminobutyric acid, and glutathione in the posterior cingulate cortex/precuneus in patients with epilepsy. Epilepsia 2020, 61, 2785–2794.
- Choi, I.Y.; Lee, S.P.; Denney, D.R.; Lynch, S.G. Lower levels of glutathione in the brains of secondary progressive multiple sclerosis patients measured by 1H magnetic resonance chemical shift imaging at 3 T. Mult. Scler. J. 2011, 17, 289–296.
- Prinsen, H.; De Graaf, R.A.; Mason, G.F.; Pelletier, D.; Juchem, C. Reproducibility Measurement of Glutathione, GABA, and Glutamate: Towards In Vivo Neurochemical Profiling of Multiple Sclerosis with MR Spectroscopy at 7 Tesla. J. Magn. Reson. Imaging 2018, 45, 187–198.
- Mandal, P.K.; Saharan, S.; Tripathi, M.; Murari, G. Brain Glutathione Levels—A Novel Biomarker for Mild Cognitive Impairment and Alzheimer’s Disease. Biol. Psychiatry 2015, 78, 702–710.
- Sian, J.; Dexter, D.T.; Lees, A.J.; Daniel, S.; Agid, Y.; Javoy-Agid, F.; Jenner, P.; Marsden, C.D. Alterations in glutathione levels in Parkinson’s disease and other neurodegenerative disorders affecting basal ganglia. Ann. Neurol. 1994, 36, 348–355.
- Coles, L.D.; Tuite, P.J.; Öz, G.; Mishra, U.R.; Kartha, R.V.; Sullivan, K.M.; Cloyd, J.C.; Terpstra, M. Repeated-Dose Oral N-Acetylcysteine in Parkinson’s Disease: Pharmacokinetics and Effect on Brain Glutathione and Oxidative Stress. J. Clin. Pharmacol. 2018, 58, 158–167.
- Lavoie, S.; Murray, M.M.; Deppen, P.; Knyazeva, M.G.; Berk, M.; Boulat, O.; Bovet, P.; Bush, A.I.; Conus, P.; Copolov, D.; et al. Glutathione precursor, N-acetyl-cysteine, improves mismatch negativity in schizophrenia patients. Neuropsychopharmacology 2008, 33, 2187–2199.
- Chitty, K.M.; Lagopoulos, J.; Hickie, I.B.; Hermens, D.F. The impact of alcohol and tobacco use on invivo glutathione in youth with bipolar disorder: An exploratory study. J. Psychiatr. Res. 2014, 55, 59–67.
- Duffy, S.L.; Lagopoulos, J.; Cockayne, N.; Hermens, D.F.; Hickie, I.B.; Naismith, S.L. Oxidative stress and depressive symptoms in older adults: A magnetic resonance spectroscopy study. J. Affect. Disord. 2015, 180, 29–35.
- Soeiro-De-Souza, M.G.; Pastorello, B.F.; Da Costa Leite, C.; Henning, A.; Moreno, R.A.; Otaduy, M.C.G. Dorsal anterior cingulate lactate and glutathione levels in euthymic bipolar i disorder: 1H-MRS study. Int. J. Neuropsychopharmacol. 2016, 19, pyw032.
- Rahman, I.; Kode, A.; Biswas, S.K. Assay for quantitative determination of glutathione and glutathione disulfide levels using enzymatic recycling method. Nat. Protoc. 2007, 1, 3159–3165.
- Sultana, R.; Piroddi, M.; Galli, F.; Butterfield, D.A. Protein levels and activity of some antioxidant enzymes in hippocampus of subjects with amnestic mild cognitive impairment. Neurochem. Res. 2008, 33, 2540–2546.
- Ansari, M.; Scheff, S.W. Oxidative Stress in the Progression of Alzheimer Disease in the Frontal Cortex. J. Neuropathol. Exp. Neurol. 2010, 69, 155–167.
- Hurst, R.D.; Heales, S.J.R.; Dobbie, M.S.; Barker, J.E.; Clark, J.B. Decreased endothelial cell glutathione and increased sensitivity to oxidative stress in an in vitro blood-brain barrier model system. Brain Res. 1998, 802, 232–240.
- Dringen, R.; Gutterer, J.M.; Hirrlinger, J. Glutathione metabolism in brain: Metabolic interaction between astrocytes and neurons in the defense against reactive oxygen species. Eur. J. Biochem. 2000, 267, 4912–4916.
- Rae, C.D.; Williams, S.R. Glutathione in the human brain: Review of its roles and measurement by magnetic resonance spectroscopy. Anal. Biochem. 2017, 529, 127–143.
- Lee, H.H.; Kim, H. Intact metabolite spectrum mining by deep learning in proton magnetic resonance spectroscopy of the brain. Magn. Reson. Med. 2019, 82, 33–48.
- Kumar, A.; Dhull, D.K.; Gupta, V.; Channana, P.; Singh, A.; Bhardwaj, M.; Ruhal, P.; Mittal, R. Role of Glutathione-S-transferases in neurological problems. Expert Opin. Ther. Pat. 2017, 27, 299–309.
- Dhamala, E.; Abdelkefi, I.; Nguyen, M.; Hennessy, T.J.; Nadeau, H.; Near, J. Validation of in vivo MRS measures of metabolite concentrations in the human brain. NMR Biomed. 2019, 32, e4058.
- Sanaei Nezhad, F.; Anton, A.; Parkes, L.M.; Deakin, B.; Williams, S.R. Quantification of glutathione in the human brain by MR spectroscopy at 3 Tesla: Comparison of PRESS and MEGA-PRESS. Magn. Reson. Med. 2017, 78, 1257–1266.
- Schubert, F.; Kühn, S.; Gallinat, J.; Mekle, R.; Ittermann, B. Towards a neurochemical profile of the amygdala using short-TE 1H magnetic resonance spectroscopy at 3 T. NMR Biomed. 2017, 30, e3685.
- Zhao, T.; Heberlein, K.; Jonas, C.; Jones, D.P.; Hu, X. New double quantum coherence filter for localized detection of glutathione in vivo. Magn. Reson. Med. 2006, 55, 676–680.
- Weiduschat, N.; Mao, X.; Hupf, J.; Armstrong, N.; Kang, G.; Lange, D.J.; Mitsumoto, H.; Shungu, D.C. Motor cortex glutathione deficit in ALS measured in vivo with the J-editing technique. Neurosci. Lett. 2014, 570, 102–107.
- Matsuzawa, D.; Obata, T.; Shirayama, Y.; Nonaka, H.; Konazawa, Y.; Yoshitome, E.; Takanashi, J.; Matsuda, T.; Shimizu, E.; Ikehira, H.; et al. Negative correlation between brain glutathione level and negative symptoms in schizophrenia: A 3T 1H-MRS study. PLoS ONE 2008, 3, e1944.
- An, L.; Zhang, Y.; Thomasson, D.M.; Latour, L.L.; Baker, E.H.; Shen, J.; Warach, S. Measurement of glutathione in normal volunteers and stroke patients at 3T using J-difference spectroscopy with minimized subtraction errors. J. Magn. Reson. Imaging 2009, 30, 263–270.
- Terpstra, M.; Torkelson, C.; Emir, U.; Hodges, J.S.; Raatz, S. Noninvasive quantification of human brain antioxidant concentrations after an intravenous bolus of vitamin C. NMR Biomed. 2011, 24, 521–528.
- Da Silva, T.; Hafizi, S.; Andreazza, A.C.; Kiang, M.; Bagby, R.M.; Navas, E.; Laksono, I.; Truong, P.; Gerritsen, C.; Prce, I.; et al. Glutathione –the major redox regulator- in the prefrontal cortex of individuals at clinical high risk for psychosis. Int. J. Neuropsychopharmacol. 2018, 21, 311–318.
- Mandal, P.K.; Tripathi, M.; Sugunan, S. Brain oxidative stress: Detection and mapping of anti-oxidant marker “Glutathione” in different brain regions of healthy male/female, MCI and Alzheimer patients using non-invasive magnetic resonance spectroscopy. Biochem. Biophys. Res. Commun. 2012, 417, 43–48.
- Michels, L.; Schulte-Vels, T.; Schick, M.; O’Gorman, R.L.; Zeffiro, T.; Hasler, G.; Mueller-Pfeiffer, C. Prefrontal GABA and glutathione imbalance in posttraumatic stress disorder: Preliminary findings. Psychiatry Res. Neuroimaging 2014, 224, 288–295.
- Reyes-Madrigal, F.; León-Ortiz, P.; Mao, X.; Mora-Durán, R.; Shungu, D.C.; de la Fuente-Sandoval, C. Striatal Glutathione in First-episode Psychosis Patients Measured In Vivo with Proton Magnetic Resonance Spectroscopy. Arch. Med. Res. 2019, 50, 207–213.
- Kolodny, T.; Schallmo, M.P.; Gerdts, J.; Edden, R.A.E.; Bernier, R.A.; Murray, S.O. Concentrations of Cortical GABA and Glutamate in Young Adults with Autism Spectrum Disorder. Autism Res. 2020, 13, 1111–1129.
- Traverso, N.; Ricciarelli, R.; Nitti, M.; Marengo, B.; Furfaro, A.L.; Pronzato, M.A.; Marinari, U.M.; Domenicotti, C. Role of glutathione in cancer progression and chemoresistance. Oxid. Med. Cell. Longev. 2013, 2013, 972913.
- Brix, M.K.; Dwyer, G.E.; Craven, A.R.; Grüner, R.; Noeske, R.; Ersland, L. MEGA-PRESS and PRESS measure oxidation of glutathione in a phantom. Magn. Reson. Imaging 2019, 60, 32–37.
- Wijtenburg, S.A.; Near, J.; Korenic, S.A.; Frank, E.; Chen, H.; Mikkelsen, M.; Chen, S. Comparing the reproducibility of commonly used magnetic resonance spectroscopy techniques to quantify cerebral glutathione. HHS Public Access 2020, 49, 176–183.
- Verma, G.; Chawla, S.; Nagarajan, R.; Iqbal, Z.; Albert Thomas, M.; Poptani, H. Non-uniformly weighted sampling for faster localized two-dimensional correlated spectroscopy of the brain in vivo. J. Magn. Reson. 2017, 277, 104–112.
- Choi, I.Y.; Lee, P. Doubly selective multiple quantum chemical shift imaging and T1 relaxation time measurement of glutathione (GSH) in the human brain in vivo. NMR Biomed. 2013, 26, 28–34.
- Saleh, M.G.; Rimbault, D.; Mikkelsen, M.; Oeltzschner, G.; Wang, M.; Jiang, D.; Alhamud, A.; Near, J.; Schär, M.; Noeske, R.; et al. Multi-Vendor Standardized Sequence for Edited Magnetic Resonance Spectroscopy. Neuroimage 2019, 189, 425–431.
- Oeltzschner, G.; Puts, N.A.J.; Chan, K.L.; Boer, V.O.; Barker, B.; Edden, R.A.E.; Science, R.; Hopkins, T.J. Dual-volume excitation and parallel reconstruction for J- difference-edited MR spectroscopy. Magn Reson Med 2017, 77, 16–22.
- Chan, K.L.; Puts, N.A.J.; Snoussi, K.; Harris, A.D.; Barker, P.B.; Edden, R.A.E. Echo time optimization for J-difference editing of glutathione at 3T. Magn. Reson. Med. 2017, 77, 498–504.
- Terpstra, M.; Henry, P.G.; Gruetter, R. Measurement of reduced glutathione (GSH) in human brain using LCModel analysis of difference-edited spectra. Magn. Reson. Med. 2003, 50, 19–23.
- Trabesinger, A.H.; Boesiger, P. Improved selectivity of double quantum coherence filtering for the detection of glutathione in the human brain in vivo: Improved Selectivity of DQC Filtering. Magn. Reson. Med. 2001, 45, 708–710.
- Saleh, M.G.; Oeltzschner, G.; Chan, K.L.; Puts, N.A.J.; Mikkelsen, M.; Schär, M.; Harris, A.D.; Edden, R.A.E. Simultaneous edited MRS of GABA and glutathione. Neuroimage 2016, 142, 576–582.
- Choi, C.; Dimitrov, I.E.; Douglas, D.; Patel, A.; Kaiser, L.G.; Amezcua, C.A.; Maher, E.A. Improvement of resolution for brain coupled metabolites by optimized 1H MRS at 7T. NMR Biomed. 2010, 23, 1044–1052.
- An, L.; Li, S.; Murdoch, J.B.; Araneta, M.F.; Johnson, C.; Shen, J. Detection of glutamate, glutamine, and glutathione by radiofrequency suppression and echo time optimization at 7 Tesla. Magn. Reson. Med. 2015, 73, 451–458.
- Mekle, R.; Mlynárik, V.; Gambarota, G.; Hergt, M.; Krueger, G.; Gruetter, R. MR spectroscopy of the human brain with enhanced signal intensity at ultrashort echo times on a clinical platform at 3T and 7T. Magn. Reson. Med. 2009, 61, 1279–1285.
- Barbagallo, G.; Morelli, M.; Quattrone, A.; Chiriaco, C.; Vaccaro, M.G.; Gullà, D.; Rocca, F.; Caracciolo, M.; Novellino, F.; Sarica, A.; et al. In vivo evidence for decreased scyllo-inositol levels in the supplementary motor area of patients with Progressive Supranuclear Palsy: A proton MR spectroscopy study. Park. Relat. Disord. 2019, 62, 185–191.
- Jensen, J.E.; Auerbach, R.P.; Pisoni, A.; Pizzagalli, D.A. Localized MRS reliability of in vivo glutamate at 3 T in shortened scan times: A feasibility study. NMR Biomed. 2017, 30, e3771.
- Mastaloudis, A.; Sheth, C.; Hester, S.N.; Wood, S.M.; Prescot, A.; McGlade, E.; Renshaw, P.F.; Yurgelun-Todd, D.A. Supplementation with a putative calorie restriction mimetic micronutrient blend increases glutathione concentrations and improves neuroenergetics in brain of healthy middle-aged men and women. Free Radic. Biol. Med. 2020, 153, 112–121.
- Kreis, R.; Hofmann, L.; Kuhlmann, B.; Boesch, C.; Bossi, E.; Hüppi, P.S. Brain metabolite composition during early human brain development as measured by quantitative in vivo 1H magnetic resonance spectroscopy. Magn. Reson. Med. 2002, 48, 949–958.
- Wijtenburg, S.A.; Gaston, F.E.; Spieker, E.A.; Korenic, S.A.; Kochunov, P.; Hong, L.E.; Rowland, L.M. Reproducibility of phase rotation STEAM at 3T: Focus on glutathione. Magn. Reson. Med. 2014, 72, 603–609.
- Choi, I.Y.; Lee, P.; Denney, D.R.; Spaeth, K.; Nast, O.; Ptomey, L.; Roth, A.K.; Lierman, J.A.; Sullivan, D.K. Dairy intake is associated with brain glutathione concentration in older adults. Am. J. Clin. Nutr. 2015, 101, 287–293.
- Lopez, Y.; Price, A.N.; Puts, N.A.J.; Hughes, E.J.; Edden, R.A.E.; Mcalonan, G.M.; Arichi, T.; Vita, E. De NeuroImage Simultaneous quantification of GABA, Glx and GSH in the neonatal human brain using magnetic resonance spectroscopy. Neuroimage 2021, 233, 117930.
- Marsman, A.; Lind, A.; Petersen, E.T.; Andersen, M.; Boer, V.O. Prospective frequency and motion correction for edited 1H magnetic resonance spectroscopy. Neuroimage 2021, 233, 117922.
- Mikkelsen, M.; Saleh, M.G.; Near, J.; Chan, K.L.; Gong, T.; Harris, A.D.; Oeltzschner, G.; Puts, N.A.J.; Cecil, K.M.; Wilkinson, I.D.; et al. Frequency and phase correction for multiplexed edited MRS of GABA and glutathione. Magn. Reson. Med. 2018, 80, 21–28.
- Mikkelsen, M.; Saleh, M.G.; Near, J.; Chan, K.L.; Gong, T.; Harris, A.D.; Oeltzschner, G.; Puts, N.A.J.; Cecil, K.M.; Iain, D. Correcting frequency and phase offsets in MRS data using robust spectral registration. NMR Biomed. 2020, 33, e4368.
- Prisciandaro, J.; Mikkelsen, M.; Saleh, M.G.; Edden, R.A. An evaluation of the reproducibility of 1 H-MRS GABA and GSH levels acquired in healthy volunteers with J-difference editing sequences at varying echo times. Magn Reson Imaging 2020, 65, 109–113.
- Satoh, T.; Yoshioka, Y. Contribution of reduced and oxidized glutathione to signals detected by magnetic resonance spectroscopy as indicators of local brain redox state. Neurosci. Res. 2006, 55, 34–39.
- Terpstra, M.; Marjanska, M.; Henry, P.G.; Tkáč, I.; Gruetter, R. Detection of an antioxidant profile in the human brain in vivo via double editing with MEGA-PRESS. Magn. Reson. Med. 2006, 56, 1192–1199.
- Lapidus, K.A.B.; Gabbay, V.; Mao, X.; Johnson, A.; Murrough, J.W.; Mathew, S.J.; Shungu, D.C. In vivo 1H MRS study of potential associations between glutathione, oxidative stress and anhedonia in major depressive disorder. Neurosci. Lett. 2014, 569, 74–79.
- Shungu, D.C.; Weiduschat, N.; Murrough, J.W.; Mao, X.; Pillemer, S.; Dyke, J.P.; Medow, M.S.; Natelson, B.H.; Stewart, J.M.; Mathew, S.J. Increased ventricular lactate in chronic fatigue syndrome. III. Relationships to cortical glutathione and clinical symptoms implicate oxidative stress in disorder pathophysiology. NMR Biomed. 2012, 25, 1073–1087.
- Lin, Y.; Stephenson, M.C.; Xin, L.; Napolitano, A.; Morris, P.G. Investigating the metabolic changes due to visual stimulation using functional proton magnetic resonance spectroscopy at 7 T. J. Cereb. Blood Flow Metab. 2012, 32, 1484–1495.
- Terpstra, M.; Vaughan, T.J.; Ugurbil, K.; Lim, K.O.; Schulz, S.C.; Gruetter, R. Validation of glutathione quantitation from STEAM spectra against edited 1H NMR spectroscopy at 4T: Application to schizophrenia. Magn. Reson. Mater. Phys. Biol. Med. 2005, 18, 276–282.
- Mueller, S.G.; Trabesinger, A.H.; Boesiger, P.; Wieser, H.G. Brain glutathione levels in patients with epilepsy measured by in vivo 1H-MRS. Neurology 2001, 57, 1422–1427.
- Napolitano, A.; Longo, D.; Lucignani, M.; Pasquini, L.; Rossi-Espagnet, M.C.; Lucignani, G.; Maiorana, A.; Elia, D.; De Liso, P.; Dionisi-Vici, C.; et al. The ketogenic diet increases in vivo glutathione levels in patients with epilepsy. Metabolites 2020, 10, 504.
- Cheong, I.; Marjańska, M.; Deelchand, D.K.; Eberly, L.E.; Walk, D.; Öz, G. Ultra-High Field Proton MR Spectroscopy in Early-Stage Amyotrophic Lateral Sclerosis. Neurochem. Res. 2017, 42, 1833–1844.
- Chiang, G.C.; Mao, X.; Kang, G.; Chang, E.; Pandya, S.; Vallabhajosula, S.; Isaacson, R.; Ravdin, L.D.; Shungu, D.C. Relationships among cortical glutathione levels, brain amyloidosis, and memory in healthy older adults investigated in vivo with 1H-MRS and Pittsburgh compound-B PET. Am. J. Neuroradiol. 2017, 38, 1130–1137.
- Durieux, A.M.S.; Horder, J.; Mendez, M.A.; Egerton, A.; Williams, S.C.R.; Wilson, C.E.; Spain, D.; Murphy, C.; Robertson, D.; Barker, G.J.; et al. Cortical and subcortical glutathione levels in adults with autism spectrum disorder. Autism Res. 2016, 9, 429–435.
- Chittyn, K.M.; Lagopoulos, J.; Hickie, I.B.; Hermens, D.F. Risky alcohol use in young persons with emerging bipolar disorder is associated with increased oxidative stress. J. Affect. Disord. 2013, 150, 1238–1241.
- Hermens, D.F.; Lagopoulos, J.; Naismith, S.L.; Tobias-Webb, J.; Hickie, I.B. Distinct neurometabolic profiles are evident in the anterior cingulate of young people with major psychiatric disorders. Transl. Psychiatry 2012, 2, e110–e118.
- Brennan, B.P.; Jensen, J.E.; Perriello, C.; Pope, H.G.; Jenike, M.A.; Hudson, J.I.; Rauch, S.L.; Kaufman, M.J. Lower Posterior Cingulate Cortex Glutathione Levels in Obsessive-Compulsive Disorder. Biol. Psychiatry Cogn. Neurosci. Neuroimaging 2016, 1, 116–124.
- Duffy, S.L.; Lagopoulos, J.; Hickie, I.B.; Diamond, K.; Graeber, M.B.; Lewis, S.J.G.; Naismith, S.L. Glutathione relates to neuropsychological functioning in mild cognitive impairment. Alzheimer’s Dement. 2014, 10, 67–75.
- Wood, S.J.; Berger, G.E.; Wellard, R.M.; Proffitt, T.M.; McConchie, M.; Berk, M.; McGorry, P.D.; Pantelis, C. Medial temporal lobe glutathione concentration in first episode psychosis: A 1H-MRS investigation. Neurobiol. Dis. 2009, 33, 354–357.
More
Information
Subjects:
Neuroimaging
Contributors
MDPI registered users' name will be linked to their SciProfiles pages. To register with us, please refer to https://encyclopedia.pub/register
:
View Times:
1.5K
Entry Collection:
Nuclear Magnetic Resonance
Revisions:
3 times
(View History)
Update Date:
21 Apr 2022
Table of Contents


Notice
You are not a member of the advisory board for this topic. If you want to update advisory board member profile, please contact office@encyclopedia.pub.
OK
Confirm
Only members of the Encyclopedia advisory board for this topic are allowed to note entries. Would you like to become an advisory board member of the Encyclopedia?
Yes
No
${ textCharacter }/${ maxCharacter }
Submit
Cancel
Back
Comments
${ item }
|
${ item.createdUser.fullName }
${ item.createdAt }
${ item.vote }
${ item.reply }
Delete
${ reply.createdUser.fullName }
${ reply.createdAt }
${ reply.vote }
Delete
There is no reply to this comment~
${ item.replyTextCharacter }/${ item.replyMaxCharacter }
Submit
Cancel
More
No more~
There is no comment~
${ textCharacter }/${ maxCharacter }
Submit
Cancel
${ selectedItem.replyTextCharacter }/${ selectedItem.replyMaxCharacter }
Submit
Cancel
Confirm
Are you sure to Delete?
Yes
No