Glutathione (GSH) is an important antioxidant implicated in several physiological functions, including the oxidation−reduction reaction balance and brain antioxidant defense against endogenous and exogenous toxic agents. Altered brain GSH levels may reflect inflammatory processes associated with several neurologic disorders. An accurate and reliable estimation of cerebral GSH concentrations could give a clear and thorough understanding of its metabolism within the brain, thus providing a valuable benchmark for clinical applications. Here we provide a summary of current knowledge on in vivo GSH brain imaging through magnetic resonance spectroscopy (MRS)
- glutathione (GSH)
- magnetic resonance spectroscopy (MRS)
- neurological disorders
1. Introduction
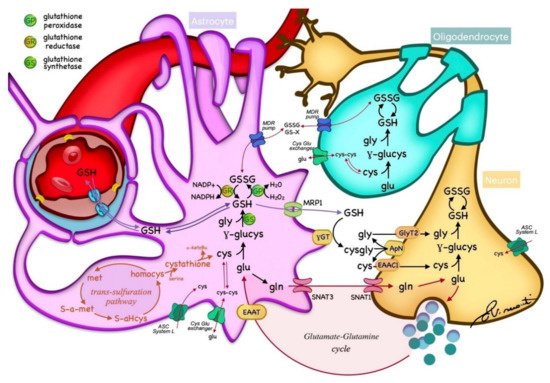
2. GSH Metabolism
3. Brain Areas GSH Concentration and MRS techniques
| Ref | HC Participants | Age (Range or Mean ± SD) |
Scanner | Method | Site of Detection (VOI Dimension and Brain Area) |
GSH Concentration (HC) | Results |
|---|---|---|---|---|---|---|---|
| [33] | Phantoms | 3 T GE + 8 channels head coil | Edited: MEGA-PRESS TR/TE = 1800/131 ms + LCModel Unedited: PRESS TR/TE = 3000/30 ms + LCModel |
MEGA-PRESS appears more precise at a lower GSH concentration | |||
| [91] | Phantoms + 10 HC | 26 ± 3.3 | 3 T Siemens + 32 channels head coil | Edited: MEGA-PRESS TR/TE = 2000/120 ms + Gannet Unedited: PRESS TR/TE = 2000/30 ms SPECIAL TR/TE = 2000/8 ms PR-STEAM TR/TE = 2000/6.5 ms + LCModel |
24 cm3 in MFC | MEGA-PRESS 1.87 ± 0.36 mM PRESS: 1.69 ± 0.13 mM SPECIAL = 2.3 ± 027 mM PR-STEAM: 2.29 ± 0.16 mM |
Reliability comparison shows more reproducible GSH measurements for unedited sequences (only for highest values, above 3 mM) |
| [23] | Phantoms + 5 HC | 24–36; 30 ± 3 |
3 T Siemens + 32 channels head coil | Unedited: PRESS TR/TE = 2000/30 ms + CNN for GSH quantification | 20 × 20 × 20 mm3 in left FC | GSH/tNAA = ~0.07–0.15 | Implementation of a robust method for GSH quantification in MRS using CNN |
| [59] | Phantoms + 4 HC | 30–45 | 7 T Siemens + 32 channels head coil | Unedited: 2D-COSY TR/TE = 2000/20 ms | 25 × 25 × 25 mm3 in OC | GSH/Cr = 0.05 ± 0.01 | Non-uniformly weighted sampling (NUWS) sequences produced a higher SNR |
| [66] | Phantoms + 13 HC | 28 ± 9 | 3 T Magnex Scientific | Edited: Multiple Quantum Chemical Shift Imaging + Levenberg−Marquardt least square minimization algorithm | 40 × 40 × 40 mm3 in FPC | 1.2 ± 0.16 mmol/Kg | DQC filtering-based chemical shift imaging of GSH at 3T implementation |
| [86] | Phantoms + 6 HC | 34 ± 13 | 3 T Siemens/Philips/GE/Canon + 32 channels head coil | Edited: MEGA-PRESS TR/TE = 2000/80 ms + Gannet | 27 cm3 in MCC | GSH/Cr = 0.045 ± 0.013 (Philips scanner) GSH/Cr = 0.051 ± 0.007 (Siemens scanner) |
In vivo GSH/Cr ratio shows relatively low variations between scanners using the universal sequence |
| [75] | Phantoms + 10 HC | 32.6 ± 8.8 | 3 T Philips + 32 channels head coil | Edited: MEGA-PRESS TR/TE = 2000/120 ms MEGA-PRIAM TR/TE = 2000/120 ms + Gannet |
33 × 33 × 33 mm3 in left and right FC | MEGA-PRESS: 2.61 ± 0.50 i.u. (left FC) 2.95 ± 0.65 i.u. (right FC) MEGA-PRIAM 2.44 ± 0.60 i.u. (left FC) 2.81 ± 0.67 i.u. (right FC) |
No significant difference between MEGA-PRESS and MEGA-PRIAM in GSH estimates |
| [69] | Phantoms + 5 HC + simulations | 31 ± 8 | 3 T Philips + 32 channels head coil | Edited: MEGA-PRESS TR/TE = 2000/120 ms + Gannet | 36 × 36 × 36 mm3 in midline PC | GSH integrals normalized by the sum of the integrals from each subject averaged across all subjects ~0.4–0.5 |
TE of 120 ms appears to be optimal for in vivo GSH detection |
| [94] | Phantoms + 7 HC | 23–35 | 3 T Philips + 8 channels head coil | Edited: MEGA-PRESS TR/TE = 2000/130 ms + AMARES Unedited: PRESS TR/TE = 2000/35 ms + jMRUI |
40 × 25 × 25 mm3 in ACC and 30 × 30 × 30 mm3 in OC | MEGA-PRESS: 3.2 ± 0.6 mM (ACC) 1.4 ± 0.4 mM (OC) PRESS: 2.8 ± 0.3 mM (ACC) 2.5 ± 0.7 mM. (OC) |
Physiological concentrations (<4 mM) of GSH cannot be reliably quantified from PRESS spectra at 3 T |
| [65] | Phantoms + 9 HC | 25 | 4 T Varian INOVA | Edited: MEGA-PRESS TR/TE = 4000/60 ms + LCModel | 30 × 30 × 30 mm3 in OC | 1.3 ± 0.2 µmol/g | GSH concentration estimation |
| [25] | Phantoms + 2 HC | 18–32 | 1.5 T Philips | Edited: DQC Unedited: PRESS |
15.6–17.4 cm3 | DQC filter for the selective in vivo detection of GSH in the human brain presentation | |
| [84] | Phantoms + 10 HC | 34.7 ± 8.8 | 3 T Philips + 32 channels head coil | Edited: MEGA-PRESS TR/TE = 2000/80 ms HERMES TR/TE = 2000/80 ms + Gannet |
30 × 30 × 30 mm3 in Ins | SNR of the HERMES spectra is similar to those of MEGA-PRESS, with the benefit of saving half the acquisition time |
|
| [47] | Phantoms + 6 HC + simulations | N.D | 7 T Philips | Unedited: asymmetric PRESS TE1/TE2 = 37/63 ms STEAM TR/TE = 2500/14–74 ms + LCModel |
25 × 30 × 30 mm3 in MPFC | Optimization of the TE delays in asymmetric PRESS enables the separation of GSH without editing | |
| [48] | Phantoms + 8 HC + simulations | 32 ± 11 | 7 T Siemens + 32 channels head coil | Unedited: asymmetric PRESS TR/TE = 3000/3.9 ms | 20 × 20 × 20 mm3 in MPFC and FC | GSH/tCr = 0.216 ± 0.02 (MPFC) GSH/tCr = 0.27 ± 0.03 (FC); | Glu and Gln higher in GM. GSH and Gln have a similar concentration (20–27% of Cr) |
| [46] | 6 HC | 22–26 | 3 T/7 T Siemens | Unedited: SPECIAL TR/TE = 4000/6 ms + LCModel | 20 × 20 × 20 mm3 in OC | 1.4 ± 0.11 mmol/Kg (3 T); 1.3 ± 0.2 mmol/Kg (7 T) | SPECIAL with ultrashort TEs resulted in a high SNR and allow to reduce RF power requirements and improve chemical shift displacement errors |
| [56] | 15 HC | 24.9 ± 3.5 | 3 T Siemens + 32 channels head coil | Edited: MEGA-PRESS TR/TE = 3200/68 ms + LCModel Unedited: SPECIAL TR/TE = 3200/8.5 ms + LCModel |
30 × 30 × 20 mm3 in DLPC and M1 | MEGA-PRESS: 0.5–3 mmol/L (M1) 3–4 mmol/L (DLPC) SPECIAL: 1.3–2.4 mmol/L (M1 and DLPC) |
GSH levels detected with reasonably good precision using SPECIAL, but poor precision using MEGA-PRESS |
| [55] | 21 HC | 32.2 ± 8.1 | 3 T Siemens + quadrature head coil | Unedited: SPECIAL TR/TE = 3000/6 ms + LCModel | 15 × 15 × 15 mm3 in left A | 1.03 ± 0.38 mmol/L (CRLBs: 24 ± 11 only in 16/21 HC) | Only in a small portion of the acquired spectra GSH passed the CRLB threshold of 20% |
| [43] | 18 HC | N.D. | 3 T Siemens | Unedited: PRESS TR/TE = 2000/30 ms + LCModel | 25 × 25 × 15 mm3 in SMA | ~2.2–2.6 mmol/Kg | No difference in GSH concentration recorded between HC and PSP |
| [90] | 22 HC | 12–14 | 3 T Siemens | Unedited: 2D J-resolved PRESS TR/TE = 2000/22 ms + LCModel | 20 × 20 × 30 mm3 in RACC | GSH variation factor results of 8.6 ± 4.1%, significant Pearson correlation (0.821) resulted between test and retest | |
| [152] | 63 HC | 40–60 | 3 T Siemens | Unedited: 2D J-resolved MRS TR/TE = 2000/31–229 ms + ProFit | 19 cm3 in RACC | GSH/H20 = 0.003–0.004 | GSH significantly increased for HC receiving supplements when compared with the placebo |
| [9] | 5 HC | 32 ± 8 | 7 T Agilent + 8 channels head coil | Edited: JDE semi-LASER TR/TE = 3200/72 ms + LCModel Unedited: STEAM TR/TE = 3000/10 ms + LCModel |
30 × 30 × 30 mm3 for JDE semi-LASER and 20 × 20 × 20 mm3 for STEAM in midline OC | 1.34 ± 0.13 mM (JDE semi-LASER) 2.15 ± 0.16 mM (STEAM) |
Better reliability results (in terms of Coefficient of variation CV) for JDE semi-LASER when compared to STEAM |
| [45] | 21 HC | Neonates | 1.5 T GE | Unedited: PRESS TR/TE = 3000/20 ms + LCModel | 29 × 10 × 11 mm3 in WM; 11 × 24 × 11 in Th; 22 × 13 × 15 in GM | 2.1 ± 0.7 mmol/Kg (WM) 2.4 ± 0.8 mmol/Kg (Th) 2.5 ± 0.5 mmol/Kg (GM) |
Absolute brain GSH content in premature infants at term was not considerably different from that in fullterm infants |
| [35] | 5 HC | 25–32 | 3 T Siemens + quadrature head coil | Edited: DQF TR/TE = 3000/70 ms | 30 × 30 × 30 mm3 in left and right PC | 0.91 ± 0.16 mM (left PC) 0.89 ± 0.16 mM (right PC) | Sequence shown to be invariant to phase difference between excitation and DQF generating pulse. |
| [51] | 10 HC | 26.1 ± 9 | 3 T Siemens | Unedited: STEAM TR/TE = 2000/6.5 ms + LCModel | 6 cm3 in ACC and PCC | 2.74 ± 0.2 i.u. (ACC) 2.07 ± 0.0025 i.u. (PCC) |
Good reliability results in terms of coefficient of variation CV (<10%) |
| [153] | 60 HC | 60–85 | 3 T Siemens | Edited: Multiple Quantum Chemical Shift Imaging + Levenberg−Marquardt least square minimization algorithm | 50 × 50 × 30 mm3 in FC and PC | 1.27 ± 0.32 mmol/Kg (FC) 1.28 ± 0.27 mmol/Kg (PC) |
glutathione concentrations in brain regions were positively correlated with milk servings |
| [85] | 18 HC | Neonates | 3 T Philips | Edited: HERMES TRT/E = 2000/80 ms + Gannet | 31 × 25 × 20 mm3 in Th and ACC | 0.55–0.7 i.u. (ACC) 0.5–0.58 i.u (Th) |
lower GSH levels in Th compared to the ACC and higher GSH levels in the ACC following tissue-correction |
| [87] | 20 HC | 21–35; 29 ± 5 |
3 T Philips + 32 channel head coil | Edited: HERMES TRT/E = 2000/80 ms + LCModel | 25 × 25 × 25 mm3 in MACC | GSH/tCr = 0.18 ± 0.04 | HERMES showed to be more sensitive to motion, as variability of spectral quality measures were observed for GSH when only retrospective outlier removal was applied. |
| [81] | 40 HC | 3 T Philips | Edited: HERMES TRT/E = 2000/80 ms + Gannet | Ranging from 30 × 30 × 30 to 36 × 36 × 36 mm3 in medial PC | The multi step Frequency and Phase Correction approach (msFPC) results in improved correction of frequency/phase errors in multiplexed GABA-/GSH-edited MRS experiments. | ||
| [72] | 67 HC | 8–12 | 3 T Philips | Edited: HERMES TR/TE = 2000/80 ms + Gannet | 30 × 30 × 30 mm3 in right SM, SMA, and right Ins | 0.56 ± 0.14 i.u. (SM) 0.57 ± 0.15 i.u. (SMA) 0.69 ± 0.19 i.u. (Ins) |
Robust Spectral Registration (rSR) reduced more subtraction artifacts than the multistep method |
| [93] | 12 HC | 25 ± 2.5 | 3 T Siemens + 32 channel head coil | Edited:MEGA-PRESS TR/TE = 2000/120 ms HERMES TRT/E = 2000/80 ms + Gannet |
30 × 25 × 25 mm3 in DACC | 1.96 ± 0.49 i.u. (MEGA-PRESS) 3.95 ± 0.44 i.u. (HERMES) |
MEGA-PRESS provide more reproducible GSH (in terms of CV%) quantification compared to HERMES |
| [73] | 4 HC | 47.3 ± 5.6 | 3 T GE | Edited: MEGA-PRESS TR/TE = 2000/80 ms | 30 × 30 × 30 mm3 in PC | 2 mM | Phantoms confirm GSH MEGA-PRESS signal and that GSSG would be undetectable at concentrations expected in vivo |
| [82] | 9 HC | 23 | 4 T Varian INOVA | Edited: DWE with MEGA-PRESS TR/TE = 4500/112 ms + LCModel | 30 × 30 × 30 mm3 in midsagittal OC | 0.8 ± 0.1 µmol/g | Double editing did not compromise sensitivity |
| [3] | 44 HC (22 young + 22 elderly) | Young = 20.4 ± 1.4 Elderly = 76.6 ± 6.1 |
4 T Varian INOVA | Edited: DWE with MEGA-PRESS TR/TE = 4500/122 ms + LCModel | 30 × 30 × 30 mm3 in midsagittal OC | Young = 0.31 ± 0.05 i.u. Elderly = 0.20 ± 0.08 i.u. |
Elderly subjects had a lower GSH concentration than younger subjects |
| [83] | 12 HC | 4 T Varian INOVA | Edited: DWE with MEGA-PRESS TR/TE = 4500/102 ms + LCModel | 30 × 30 × 30 mm3 in OC | 0.7–0.9 µmol/g | GSH concentration remains costant after intravenous vitamin C infusion | |
| [67] | 11 HC | 61.5 ± 10.5 | 3 T GE + 8 channels head coil | Edited: MEGA-PRESS TR/TE = 1500/68 ms + in-house software developed in MATLAB | 20 × 25 × 25 mm3 in PG and MC | GSH/W = 1.6 ± 0.4 × 10⁻³ i.u. (MC) | Significantly lower GSH in ALS patients when compared with HC |
| [77] | 11 HC | 30 ± 11 | 3 T Philips | Edited: MEGA-PRESS TR/TE = 2000/131 ms | 50 × 30 × 30 mm3 in PC | 1.20 ± 0.14 mM | Optimal TE = 130 ms. Stroke patients not significantly different from HC |
| [154] | 10 HC | 18–65 | 3 T | Edited: MEGA-PRESS TR/TE = 1500/68 ms | 30 × 30 × 20 mm3 in OC | Anhedonia and GSH negatively correlated | |
| [155] | 13 HC | 18–45 | 3 T GE | Edited: MEGA-PRESS TR/TE = 1500/68 ms | 30 × 30 × 20 mm3 in OC | No differences between HC and CFS patients | |
| [96] | 44 HC (25 males and 19 females) | 23.6 ± 2.1 | 3 T Philips | Edited: MEGA-PRESS TR/TE = 2500/120 ms | 2.5 cm3 in FC PC, Hyp and C | ~20–22 a.u. (FC females) ~15–22 a.u. (FC males) ~30 a.u. (PC females) ~17–25 a.u. (PC males) ~15 a.u. (Hyp females) ~15 a.u. (Hyp males) ~14–17 a.u. (C females) ~10–15 a.u. (C males) |
Higher GSH in young, gender matched parietal cortex hippocampus vs. older patients |
| [10] | 21 HC | 65 ± 5 | 3 T Philips | Edited: MEGA-PRESS TR/TE = 2500/120 ms + KALPANA | 15–16 cm3 in FP Hyp | 1.12 ± 0.18 mmol/L (FC) 1.02 ± 0.17 mmol/L (Hyp) |
Significant reductions in GSH in both the frontal cortex and hippocampus in disease |
| [97] | 17 HC | 38.8 ± 13.1 | 3 T GE | Edited: MEGA-PRESS TR/TE = 1800/68 ms + LCModel | 25 × 40 × 30 mm3 in DLPC 28 × 30 × 25 mm3 in ACC |
GSH/Cr = 0.11 ± 0.03 (ACC) GSH/Cr = 0.11 ± 0.03 (left DLPC); |
Higher GSH in patients |
| [74] | 16 HC | 21–41; 30 ± 7.2 | 3 T GE + standard quadrature coil | Edited: MEGA-PRESS TR/TE = 1500/94 ms + GE software | 28 × 30 × 22 mm3 in PMPC | 0.928 ± 0.24 mM | No significant differences between GSH concentration of HC and patients |
| [3] | 14 HC | 32 ± 10 | 7 T Magnex Scientific | Unedited: STEAM TR/TE = 5000/8 ms + LCModel | Ranging from 6 × 6 × 13 to 20 × 20 × 20 mm3 in FWM, LS, PCC, OC, P, SN, and CV | Ranging from 0.50 ± 0.1 μmol/g (OC) to 1.2 ± 0.2 μmol/g (CV) | Lower GSH concentration in elderly subjects than in younger subjects |
| [89] | 10 HC | 25 ± 3 | 7 T Philips + 16 channels head coil | Unedited: STEAM TR/TE = 3000/15 ms + LCModel | 20 × 20 × 20 mm3 in OC | 2.28 ± 0.1 µmol/g | GSH increased during visual stimulation |
| [50] | 10 HC | 20 ± 3 | 4 T Varian INOVA | Edited: MEGA-PRESS TR/TE = 4500/68 ms + LCModel Unedited: STEAM TR/TE = 4500/5 ms + LCModel |
17 cm3 in ACC and 8 cm3 in OC | 1.6 ± 0.4 µmol/g (ACC) 1.6 ± 0.2 µmol/g (OC) |
Validation of glutathione quantitation from the STEAM spectra |
| [7] | 10 HC | 20–70; 39.2 ± 15.3 |
7 T Siemens + 32 channels head coil | STEAM TR/TE = 8500 (9 subjects)−9300 (1 subject)/6 ms + LCModel | 20 × 20 × 20 mm3 in PCC/precuneus | 1.9 ± 0.3 mmol/L | GSH levels higher in IGE (idiopathic generalized epilepsy) compared with HC |
| [137] | 8 HC | 19–53; 28.4 ± 10.7 |
1.5 T Philips + birdcage head coil | PRESS + DCQ (double quantum coherence) filtering | 25 × 25 × 25 cm3 POC | GSH/H2O = 2.3 ± 0.9 × 10⁻⁵ (right POC) 2.5 ± 1.2 × 10⁻⁵ (left POC) |
GSH/water ratio significantly reduced in both hemisphere Ins epileptic patients compared with HC |
| [44] | 7 HC | 6–17 | 3 T Siemens + 32 channels head coil | PRESS TR/TE = 1980/30 ms + LCModel | variable from 3 to 8 cm3 in the right gangliocapsular region | 2.0 ± 0.5 mM | Higher levels of brain GSH in KD patients compared with HC |
| [68] | 17 HC | 7 T and 3 T Siemens + 16 channels head coil (7 T) | MEGA-PRESS TR/TE = 2000/68 ms | 3.5 × 2.5 × 2.3 cm3 in left or right M1 (3 T and 7 T) and pons (3 T) | No significative difference in brain GSH between ALS patients and HC using 3 T scanner | ||
| [67] | 11 HC | 58.5 ± 6.6 | 3 T GE + 8 channels head coil | PRESS with J-edited spin echo method TR/TE 1500/68 ms | single voxel on primary motor cortex (M1) | GSH/H2O = 1.6 ± 0.5 × 10⁻³ GSH/Cr 1.9 ± 0.8 × 10⁻² |
Reduced GSH in ALS patients compared with HC |
| [131] | 15 HC | 55–75 | 3 T GE + 8 channels head coil | PRESS with J-edited spin echo method TR/TE 1500/68 ms | 2.5 × 2.5 × 2.5 cm3 PCC and precuneus | GSH reduction with increased levels of amyloidosis | |
| [96] | 85 HC | males 26.4 ± 3.0; females 23.6 ± 2.1 |
3 T Philips + 32 channels head coil | MEGA-PRESS TR/TE = 2500/120 ms | 2.5 × 2.5 × 2.5 cm3 in several brain regions | Female HC have higher GSH levels compared to male HC with a specific distribution pattern | |
| [128] | 29 HC | 18–50 | 3 T GE | PRESS TR/TE = 3000/30 ms + LCM model | 20 × 20 × 15 mm3 in BG and 16 × 24 × 20 mm3 in DMPFC | 2–3 mM (DMPFC and BG) | No difference between GSH levels in ASD patients and HC |
| [99] | 40 HC | 18–30 | 3 T Philips + 32 channels head coil | MEGA-PRESS TR/TE = 2048/68 ms | 3 × 3 × 3 cm3 in five different regions (OC, left/right MT, TC, and PC) | Occipital 6.91 (0.68) i.u. Left MT+ 5.51 (0.86) i.u. Right MT+ 6.59 (0.67) i.u. Temporal 7.17 (0.93) i.u. Parietal 5.17 (0.59) i.u |
No difference in GLX metabolites between ASD patients and HC |
| [15] | 12 HC | 50–84; 61.5 ± 4.9 | 3 T GE + 8 channel head coil | PRESS TR/TE = 2000/35 ms + LCModel | 20 × 20 × 20 mm3 in ACC | GSH/Cr = 0.22 ± 0.06 | Increased GSH in patients with depressive symptoms |
| [62] | 17 HC | 20–29 | 3 T GE + 8 channel head coil | PRESS TR/TE = 2000/35 ms + LCModel | 20 × 20 × 20 mm3 in ACC | 1.47 ± 0.47 i.u. | Less GSH in the ACC of patients with high risk of alcohol abuse |
| [14] | 49 HC | 18–30 | 3 T GE + 8 channel head coil | PRESS TR/TE = 2000/35 ms + LCModel | 20 × 20 × 20 mm3 in ACC and 1.5 × 3.0 × 1.0 in left Hyp | Decreased ACC-GSH with tobacco use in patients with bipolar disorder. No differences in GSH levels with alcohol use | |
| [61] | 25 HC | 3 T GE + 8 channel head coil | PRESS TR/TE = 2000/35 ms + LCModel | 320 × 20 × 20 mm3 in ACC | Distinct neurometabolic profiles are evident in young people with major psychiatric disorders | ||
| [24] | 45 HC | 7 T Philips | STEAM TR/TE = 2000/17 ms + LCModel | 20 × 18 × 25 mm3 in ACC, 40 × 12 × 18 mm3 in left Ins, 20 × 22 × 20 mm3 in OC | 1.75 ± 0.31 mM (ACC) 1.72 ± 0.20 mM (left Ins) 1.5 ± 0.17 mM (OC) |
Reduced GSH in ACC of patients with schizophrenia | |
| [127] | 25 HC | 34.0 ± 12.3 | 3 T Siemens + 32 channels head coil | 2DJ PRESS | 20 × 20 × 20 mm3 in PCC | GSH/Cr = 0.25 | Lower GSH/Cr in PCC of patients with obsessive compulsive disorder |
| [95] | 26 HC | 22.77 ± 4.05 | 3 T GE + 8 channel head coil | MEGA-PRESS TR/TE = 1500/68 ms | 20 × 40 × 30 mm3 in MPFC | GSH/H2O = 0.0015–0.0018 | No difference in GSH levels between HC and patients at a clinical high risk for psychosis |
| [98] | 9 HC | 22.56 ± 2.35 | 3 T GE + 8 channel head coil | MEGA-PRESS TR/TE = 1500/68 ms | 4.5 × 2.5 × 2.5 mm3 in striatum | GSH/H2O = 1.10 ± 0.10 × 10⁻³ | Striatal GSH deficit in patients with a first episode of psychosis |
| [97] | 17 HC | 40.4 ± 12.3 | 3 T GE + 8 channel head coil | MEGA-PRESS TR/TE = 1800/68 ms + LCModel | 28 × 30 × 25 mm3 in ACC and 25 × 40 × 30 mm3 in DPLFC | GSH/Cr = 0.11 ± 0.03 (ACC) | Higher GSH levels in PTSD patients |
| [42] | 41 HC | 56–80; 68.7 ± 5.8 | 3 T GE + 8 channel head coil | PRESS TR/TE = 2000/35 ms + LCModel | 20 × 20 × 20 mm3 in ACC | Elevated ratios of GSH in subjects with mild cognitive impairment | |
| [126] | 18 HC | 15–29 | 3 T GE | PRESS TE 30 ms + LCModel | 2 cm in both TC | 1.5–2 mM | GSH levels significantly higher in patients with a first episode of psychosis |
This entry is adapted from the peer-reviewed paper 10.3390/antiox10091407