Your browser does not fully support modern features. Please upgrade for a smoother experience.
Submitted Successfully!
 +1 credit
Thank you for your contribution! You can also upload a video entry or images related to this topic.
For video creation, please contact our Academic Video Service.
| Version | Summary | Created by | Modification | Content Size | Created at | Operation |
|---|---|---|---|---|---|---|
| 1 | Antonio Cerasa | + 1332 word(s) | 1332 | 2022-03-17 05:08:32 | | | |
| 2 | Beatrix Zheng | + 10 word(s) | 1342 | 2022-03-18 03:01:16 | | | | |
| 3 | Beatrix Zheng | Meta information modification | 1342 | 2022-03-21 05:14:33 | | | | |
| 4 | Beatrix Zheng | -8 word(s) | 1334 | 2022-03-21 05:18:20 | | |
Video Upload Options
We provide professional Academic Video Service to translate complex research into visually appealing presentations. Would you like to try it?
Cite
If you have any further questions, please contact Encyclopedia Editorial Office.
Cerasa, A. Application of Machine Learning in Traumatic Brain Injury. Encyclopedia. Available online: https://encyclopedia.pub/entry/20690 (accessed on 25 July 2026).
Cerasa A. Application of Machine Learning in Traumatic Brain Injury. Encyclopedia. Available at: https://encyclopedia.pub/entry/20690. Accessed July 25, 2026.
Cerasa, Antonio. "Application of Machine Learning in Traumatic Brain Injury" Encyclopedia, https://encyclopedia.pub/entry/20690 (accessed July 25, 2026).
Cerasa, A. (2022, March 17). Application of Machine Learning in Traumatic Brain Injury. In Encyclopedia. https://encyclopedia.pub/entry/20690
Cerasa, Antonio. "Application of Machine Learning in Traumatic Brain Injury." Encyclopedia. Web. 17 March, 2022.
Copy Citation
One of the main challenges in traumatic brain injury (TBI) patients is to achieve an early and definite prognosis. Despite the recent development of algorithms based on artificial intelligence for the identification of these prognostic factors relevant for clinical practice, the literature lacks a rigorous comparison among classical regression and machine learning (ML) models. The utility of comparing traditional regression modeling to ML is highlighted here, particularly when using a small number of reliable predictor variables after TBI. The dataset of clinical data used to train ML algorithms will be publicly available to other researchers for future comparisons.
traumatic brain injury
outcome predictors
linear regression
machine learning
ensemble of classifiers
1. Introduction
Traumatic brain injury (TBI) has a tremendous impact on patients and family members. They must learn to live with a diminished potential for physical, emotional, cognitive, and social functioning. A recent meta-analysis [1] found an overall incidence rate of 262 per 100,000 per year, and in the USA 43.3% of hospitalized TBI survivors will have a long-term disability [2]. One of the main challenges in TBI-related research is to achieve an early and definite prognosis considering the best predictors of outcome, to administer effective treatments able to improve the clinical progression. Some factors have been proposed and predictive models have been constructed. Most studies used traditional regression techniques to identify these factors [3] defining age, diagnosis, and severity level (measured with Coma Recovery Scale-Revised (CRS-r)) as the most important clinical indicators to predict TBI outcome, although with a poor implementation in clinical practice [4]. In such a scenario, considerable efforts have been put into implementing and developing artificial intelligence tools. Machine learning (ML) methods landed in this neurological domain only recently with promising and enthusiastic perspectives [5]. The first studies tested the performance of support vector machine (SVM) [6], Naïve Bayes (NB) [7], and random forest [8] algorithms in predicting the mortality of TBI patients. Despite good performance having been reported (ranging from 67% to 97%), these preliminary ML studies are characterized by high variability in predictive models and clinical predictors used for the training phase, thus reducing a rigorous comparison among methods. For this reason, in this research, the researchers compare the performance of a Classical Linear Regression Model (LM) with the most common ML algorithms for the prediction of clinical outcomes of TI patients (measured with the Glasgow Outcome Scale-Extension) after 6–9 months from the hospitalization. Finally, the researchers also tested the ensemble ML algorithm and applied different feature selection methods to optimize the model.
2. Current Insights
In this research, the researchers compare ML approaches to more traditional LM in contemporary TBI patients’ data to predict their clinical evolution, respectively, using 2 and 4 classes of outcome approaches. The researchers demonstrated that classic LM could perform as well as more advanced ML and ensemble ML classifiers in terms of accuracy (sensitivity and specificity) trained by the same predictors.
The LM had the advantage of identifying some prognostic factors, associating each of them with an odds ratio, while the use of ML is limited by the difficulty of interpreting the model, often referred to as ‘black box’. This finding is perfectly in agreement with results recently obtained by Iosa et al. [9], who compared the performance of classical regression, neural network, and cluster analysis in predicting the outcome of patients with stroke. Similarly, Gravesteijn et al. [10] reached the same conclusions on TBI patients evaluating the different performance of logistic regression with respect to SVM, random forests, gradient boosting machines, and artificial neural networks. In terms of model performance, the SVM and DT values are similar to those reported by Abujaber et al. [6], whereas k-NN has never been employed in this clinical domain and this outperformed other ML approaches in all the evaluation metrics. The only algorithm that relatively underperformed was the NB. The accuracy (and sensitivity) was somewhat lower, passing from the analyzed to the test sample. The researchers' data conflict with those reported by Amorim et al. [7] who described the excellent performance of this algorithm as a screening tool in predicting the functional outcome of TBI patients. This discrepancy could be mainly due to the use of different clinical predictors. Indeed, there is large heterogeneity in factors (i.e., age, gender, clinical severity, clinical comorbidities, systolic blood pressure, respiratory rate, lab values, and presence of mass lesion) identified as having a prognostic value in TBI patients, thus making a direct comparison between ML approaches difficult to perform [6]. Another limit is due to the fact the dataset is unbalanced (62.8% negative vs. 37.2% positive outcome) and could negatively affect performances of machine learning. To overcome this issue and increase classification robustness, The researchers also applied the technique of LOOCV that is less affected by this problem and allows them to compare four machine learning techniques since each type of algorithm performs predictions differently. For instance, the DT algorithm performs well with unbalanced datasets thanks to the splitting rules that look at class variables.
Moreover, the type of predictors, such as continuous and categorized (operator-dependent) variables and the lack of objective biological high-dimensional data (i.e., neuroimaging, genetics), might also limit the performance of ML techniques applied in this domain [11]. The researchers' data would seem to confirm this hypothesis because of the change in identified predictors for classification. Indeed, as shown in Figure 1 and Figure 2, moving from 2 to 4 classes of outcome approaches impacts the most significant features extracted by predictive models. Apart from age, for reaching the excellent performance with the 2 classes approach, LM and ML algorithms need CRS-r values and ERBI values at T1, whereas, for the 4 classes approach, diagnosis at admission and sex are the most important features.
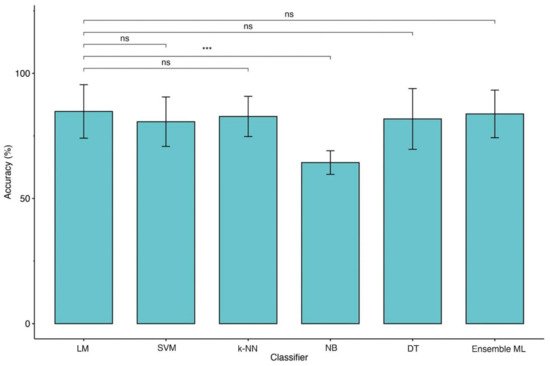
Figure 1. Comparison of accuracies between LM and ML models (2 classes of outcome). Legend: Linear Regression Model (LM), Support Vector Machine (SVM), k-Nearest Neighbors (k-NN), Naïve Bayes (NB), Decision Tree (DT) and Ensemble of Machine Learning models (Ensemble ML). Symbols ***, p-values <0.001.
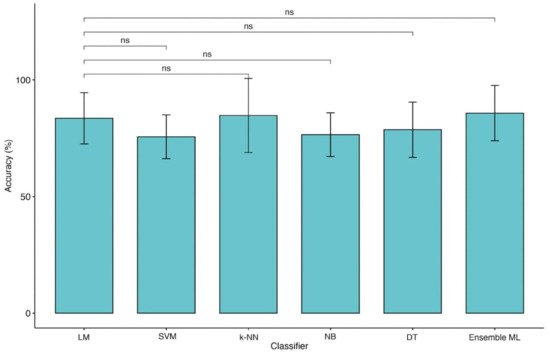
Figure 2. Comparison of accuracies between LM and ML models (4 classes of outcome). Legend: Linear Regression Model (LM), Support Vector Machine (SVM), k-Nearest Neighbors (k-NN), Naïve Bayes (NB), Decision Tree (DT) and Ensemble of Machine Learning models (Ensemble ML).
Finally, this is the first research employing an ensemble ML approach to improve the outcome prediction in TBI patients. This approach has been demonstrated to be useful for integrating multiple ML models in a single predictive model characterized by higher robustness, reducing the dispersion of predictions [12]. However, this method would not seem to boost performance except when the four classes approach was employed (Figure 2). Indeed, in the KW analysis, the researchers observe that the ensemble ML for two classes reach a high accuracy similar to other ML techniques of about 84% for LOOCV and 82% for 10-fold CV as shown in Table 1 while using four classes approach (Table 2) a (not significant) trend of performance metrics was observed (71.5% for LOOCV and 70.5% for 10-fold CV), which is five to ten percentage points higher than the other models.
Table 1. Classification Results with MRMR feature selection using, respectively, LOOCV and 10-fold Cross Validation (2 classes).
| Classification Model | |||||||
|---|---|---|---|---|---|---|---|
| Cross Validation | Performance Metric | Linear Model | Support Vector Machine (SVM) | k-Nearest Neighbors (k-NN) |
Naïve Bayes (NB) | Decision Tree (DT) | Ensemble |
| LOOCV | Accuracy | 84.69% | 80.61% | 82.65% | 64.29% | 79.59% | 83.67% |
| Precision µ | 84.69% | 80.61% | 82.65% | 64.29% | 79.59% | 83.67% | |
| Precision M | 83.46% | 79.51% | 81.20% | 64.29% | 78.14% | 82.47% | |
| Recall µ | 64.84% | 58.09% | 61.36% | 37.50% | 56.52% | 63.08% | |
| Recall M | 41.51% | 38.65% | 40.40% | 25.00% | 38.25% | 40.79% | |
| F1 Score µ | 73.45% | 67.52% | 70.43% | 47.37% | 66.10% | 71.93% | |
| F1 Score M | 55.44% | 52.02% | 53.95% | 36.00% | 51.36% | 54.59% | |
| 10-fold CV | Accuracy | 85.89% | 81.78% | 82.78% | 64.33% | 76.78% | 81.78% |
| Precision µ | 85.71% | 81.63% | 82.65% | 64.29% | 76.53% | 81.63% | |
| Precision M | 84.44% | 80.50% | 81.20% | 64.29% | 74.53% | 80.00% | |
| Recall µ | 66.67% | 59.70% | 61.36% | 37.50% | 52.08% | 59.70% | |
| Recall M | 42.22% | 39.37% | 40.40% | 25.00% | 36.75% | 40.00% | |
| F1 Score µ | 75.00% | 68.97% | 70.43% | 47.37% | 61.98% | 68.97% | |
| F1 Score M | 56.30% | 52.87% | 53.95% | 36.00% | 49.22% | 53.33% | |
Table 2. Classification Results with MRMR feature selection using, respectively, LOOCV and 10-fold Cross Validation (4 classes).
| Classification Model | |||||||
|---|---|---|---|---|---|---|---|
| Cross Validation |
Performance Metric | Linear Model | Support Vector Machine (SVM) | k-Nearest Neighbors (k-NN) |
Naïve Bayes (NB) | Decision Tree (DT) | Ensemble |
| LOOCV | Accuracy | 65.31% | 43.88% | 66.33% | 68.37% | 59.18% | 71.43% |
| Precision µ | 65.31% | 43.88% | 66.33% | 68.37% | 59.18% | 71.43% | |
| Precision M | 66.49% | 36.49% | 66.50% | 52.94% | 46.16% | 71.73% | |
| Recall µ | 38.55% | 20.67% | 39.63% | 41.88% | 32.58% | 45.45% | |
| Recall M | 36.51% | 23.14% | 37.28% | 38.74% | 30.86% | 41.58% | |
| F1 Score µ | 48.48% | 28.10% | 49.62% | 51.94% | 42.03% | 55.56% | |
| F1 Score M | 47.13% | 28.32% | 47.77% | 44.74% | 36.99% | 52.64% | |
| 10-fold CV | Accuracy | 64.22% | 45.00% | 65.33% | 67.44% | 57.44% | 70.44% |
| Precision µ | 64.28% | 44.89% | 65.31% | 67.34% | 57.14% | 70.41% | |
| Precision M | 65.72% | 36.83% | 65.44% | 52.16% | 45.83% | 70.78% | |
| Recall µ | 37.50% | 21.36% | 38.55% | 40.74% | 30.77% | 44.23% | |
| Recall M | 35.73% | 23.42% | 36.38% | 37.78% | 28.68% | 40.66% | |
| F1 Score µ | 47.37% | 28.95% | 48.48% | 50.77% | 40.00% | 54.33% | |
| F1 Score M | 46.29% | 28.63% | 46.77% | 43.82% | 35.28% | 51.65% | |
3. Conclusions
In summary, the researchers found that ML algorithms do not perform better than more traditional regression models in predicting the outcome after TBI. As future work, the researchers plan to perform further external validations of all these models on other datasets that could capture dynamic changes in prognosis during intensive care courses extending the current models with new objective predictors, such as neuroimaging data (EEG, PET, fMRI) [13].
References
- Peeters, W.; van den Brande, R.; Polinder, S.; Brazinova, A.; Steyerberg, E.W.; Lingsma, H.F.; Maas, A.I.R. Epidemiology of traumatic brain injury in Europe. Acta Neurochir. 2015, 157, 1683–1696.
- Frost, R.B.; Farrer, T.J.; Primosch, M.; Hedges, D.W. Prevalence of traumatic brain injury in the general adult population: A meta-analysis. Neuroepidemiology 2013, 40, 154–159.
- Lingsma, H.F.; Roozenbeek, B.; Steyerberg, E.W.; Murray, G.D.; Maas, A.I.R. Early prognosis in traumatic brain injury: From prophecies to predictions. Lancet Neurol. 2010, 9, 543–554.
- Lucca, L.F.; Lofaro, D.; Pignolo, L.; Leto, E.; Ursino, M.; Cortese, M.D.; Conforti, D.; Tonin, P.; Cerasa, A. Outcome prediction in disorders of consciousness: The role of coma recovery scale revised. BMC Neurol. 2019, 19, 68.
- Liu, N.T.; Salinas, J. Machine Learning for Predicting Outcomes in Trauma. Shock. Inj. Inflamm. Sepsis: Lab. Clin. Approaches 2017, 48, 504–510.
- Abujaber, A.; Fadlalla, A.; Gammoh, D.; Abdelrahman, H.; Mollazehi, M.; El-Menyar, A. Prediction of in-hospital mortality in patients with post traumatic brain injury using National Trauma Registry and Machine Learning Approach. Scand. J. Trauma Resusc. Emerg. Med. 2020, 28, 44.
- Amorim, R.L.; Oliveira, L.M.; Malbouisson, L.M.; Nagumo, M.M.; Simoes, M.; Miranda, L.; Bor-Seng-Shu, E.; Beer-Furlan, A.; De Andrade, A.F.; Rubiano, A.M.; et al. Prediction of Early TBI Mortality Using a Machine Learning Approach in a LMIC Population. Front. Neurol. 2019, 10, 1366.
- Hanko, M.; Grendár, M.; Snopko, P.; Opšenák, R.; Šutovský, J.; Benčo, M.; Soršák, J.; Zeleňák, K.; Kolarovszki, B. Random Forest-Based Prediction of Outcome and Mortality in Patients with Traumatic Brain Injury Undergoing Primary Decompressive Craniectomy. World Neurosurg. 2021, 148, e450–e458.
- Iosa, M.; Morone, G.; Antonucci, G.; Paolucci, S. Prognostic Factors in Neurorehabilitation of Stroke: A Comparison among Regression, Neural Network, and Cluster Analyses. Brain Sci. 2021, 11, 1147.
- Gravesteijn, B.Y.; Nieboer, D.; Ercole, A.; Lingsma, H.F.; Nelson, D.; van Calster, B.; Steyerberg, E.W. CENTER-TBI collaborators, Machine learning algorithms performed no better than regression models for prognostication in traumatic brain injury. J. Clin. Epidemiol. 2020, 122, 95–107.
- Tunthanathip, T.; Oearsakul, T. Application of machine learning to predict the outcome of pediatric traumatic brain injury. Chin. J. Traumatol. 2021, 24, 350–355.
- Yang, Y. Ensemble Learning. In Temporal Data Mining Via Unsupervised Ensemble Learning; Elsevier: The Netherlands, 2017; Chapter 4; pp. 35–56.
- Porcaro, C.; Nemirovsky, I.E.; Riganello, F.; Zahra, M.; Cerasa, A.; Tonin, P.; Stajanoski, B.; Soddu, A. Behavioral assessments, neuroimaging, and electrophysiology as clinical diagnosis tools for disorders of consciousness. Front. Neurol. 2022, 12, 778951.
More
Information
Contributor
MDPI registered users' name will be linked to their SciProfiles pages. To register with us, please refer to https://encyclopedia.pub/register
:
View Times:
1.1K
Revisions:
4 times
(View History)
Update Date:
21 Mar 2022
Table of Contents


Notice
You are not a member of the advisory board for this topic. If you want to update advisory board member profile, please contact office@encyclopedia.pub.
OK
Confirm
Only members of the Encyclopedia advisory board for this topic are allowed to note entries. Would you like to become an advisory board member of the Encyclopedia?
Yes
No
${ textCharacter }/${ maxCharacter }
Submit
Cancel
Back
Comments
${ item }
|
${ item.createdUser.fullName }
${ item.createdAt }
${ item.vote }
${ item.reply }
Delete
${ reply.createdUser.fullName }
${ reply.createdAt }
${ reply.vote }
Delete
There is no reply to this comment~
${ item.replyTextCharacter }/${ item.replyMaxCharacter }
Submit
Cancel
More
No more~
There is no comment~
${ textCharacter }/${ maxCharacter }
Submit
Cancel
${ selectedItem.replyTextCharacter }/${ selectedItem.replyMaxCharacter }
Submit
Cancel
Confirm
Are you sure to Delete?
Yes
No