| Version | Summary | Created by | Modification | Content Size | Created at | Operation |
|---|---|---|---|---|---|---|
| 1 | Antonio Albuquerque | + 3430 word(s) | 3430 | 2022-03-17 01:28:29 | | | |
| 2 | Antonio Albuquerque | + 3428 word(s) | 3428 | 2022-03-17 01:32:25 | | | | |
| 3 | Catherine Yang | -742 word(s) | 2686 | 2022-03-17 03:16:39 | | |
Video Upload Options
The effect of adding alum water treatment residues (WTR) on the methanogenic activity in the digestion of primary domestic wastewater sludge was evaluated through laboratory experiments in sedimentation columns, using total suspended solids (TSS) concentrations from 0.37 to 1.23 g/L. The addition of WTR to primary clarifiers can benefit its effluent water quality in terms of colour, turbidity, chemical oxygen demand (COD), and TSS. However, the presence of WTR can negatively influence the production of methane gas during organic sludge digestion in primary clarifiers, for concentrations of TSS between 14.43 and 25.23 g/L and of VSS between 10.2 and 11.85 g/L. The activity of the Methanothrix sp., curved bacilli, methanococci, and Methanosarcina sp. decreases considerably after 16 days of anaerobic digestion, and methane production seems to only be associated with fluorescent methanogenic bacilli.
1. Introduction
2. Evaluation of the Sedimentation Performance of Primary Clarifiers

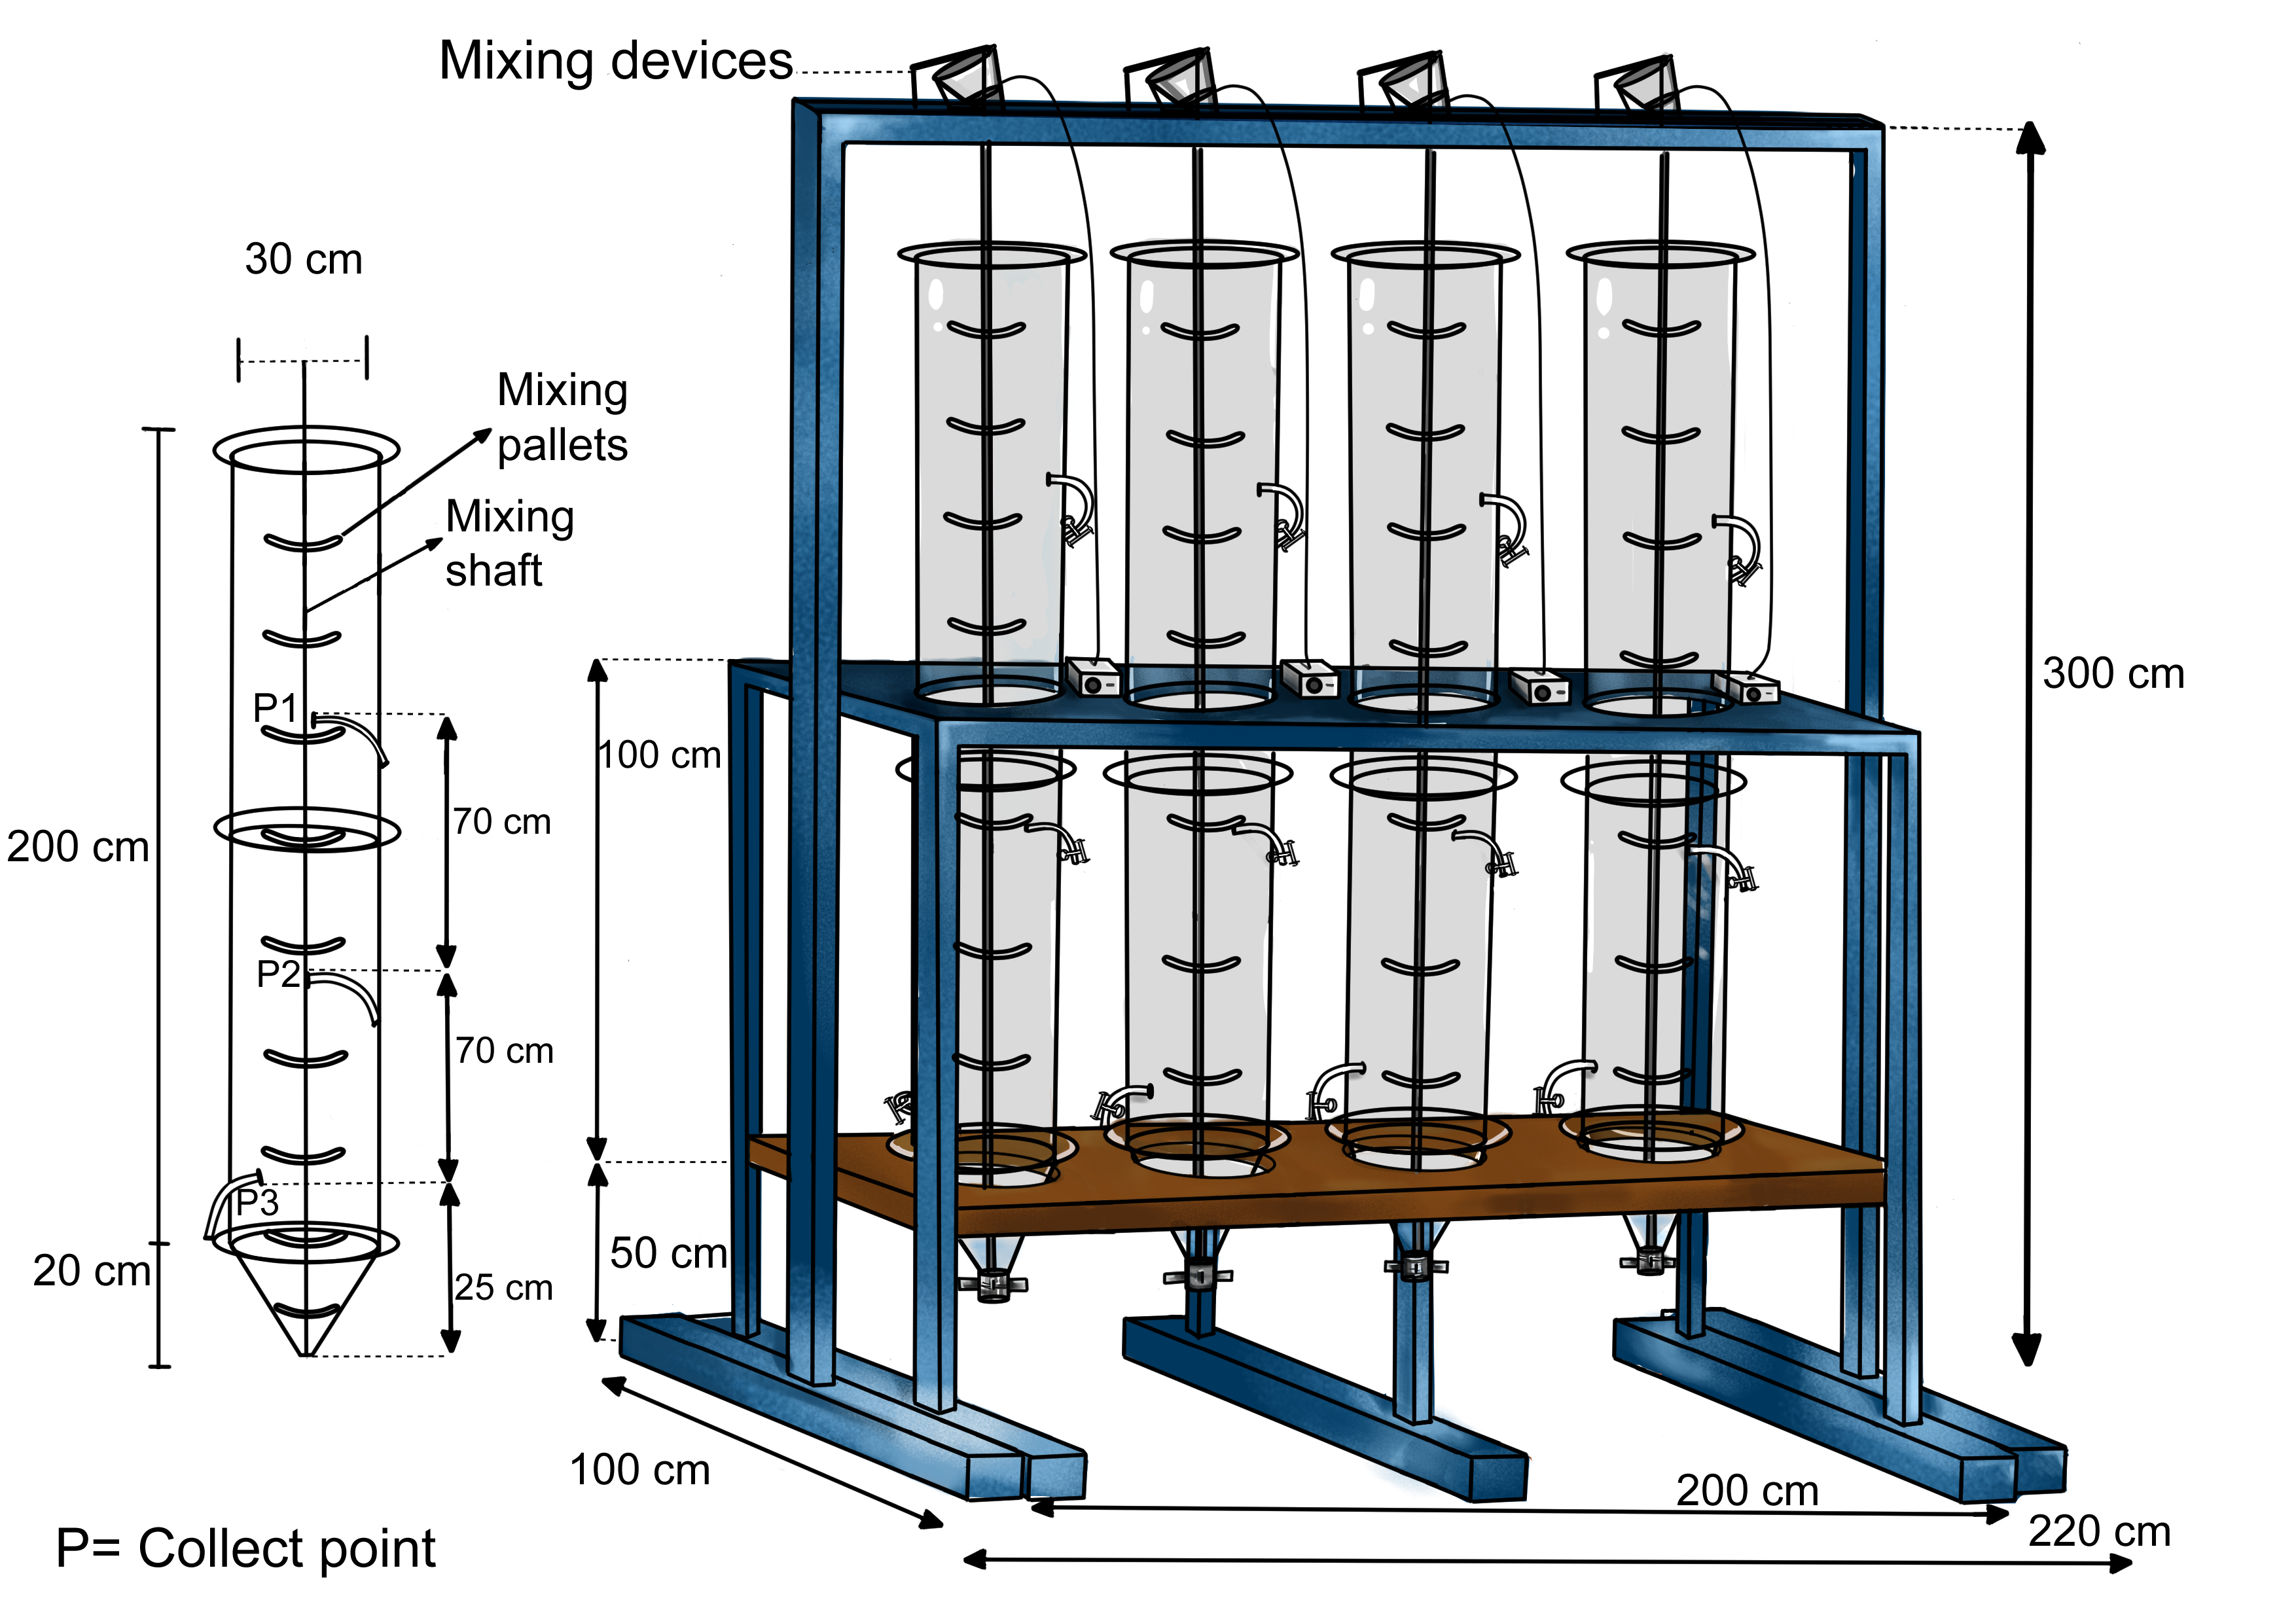
Figure 1. Test columns: (a) picture and (b) schematic representation.
Table 1. Volumes of WTR and DWW used in the sedimentation experiments.

3. Batch Experiments for Evaluating the Methanogenic Activity in Primary Sludge
4. Effect of WTR on the Sedimentation Characteristics of Primary Sludge and on the Effluent Water Quality of Primary Clarifiers

5. Effect of WTR on the Methane Production from Primary Sludge


6. Conclusions
References
- Crittenden, J.; Trussell, R.; Hand, D.; Howe, K.; Tchobanoglous, G. Water Treatment: Principles and Design, 3rd ed.; John Wiley and Sons: Hoboke, NJ, USA, 2012; p. 1920.
- Reali, M. The main quantitative and qualitative characteristics of water treatment sludge. In General Notes on Water Treatment and Residuals Disposal from Water Treatment Plants; Reali, M.P., Ed.; ABES: Rio de Janeiro, Brazil, 1999; Chapter 2; pp. 21–39. (In Portuguese)
- Ren, B.; Zhao, Y.; Ji, B.; Wei, T.; Shen, C. Granulation of Drinking Water Treatment Residues: Recent Advances and Prospects. Water 2020, 12, 1400.
- Scalize, P. Disposal of Waste Generated in Water Treatment Plants in Sewage Treatment Plants. Ph.D. Thesis, University of Sao Paulo, São Paulo, Brazil, 2003; 146p. (In Portuguese).
- Kizinievicˇ, O.; Žurauskiene ̇, R.; Kizinievicˇ, V.; Žurauskas, R. Utilisation of sludge waste from water treatment for ceramicproducts. Constr. Build. Mater. 2013, 41, 464–473.
- Scalize, P.; Araujo, F.; Albuquerque, A.; Lima, F. New cement floor produced with water treatment residues. In Proceedings of the Annual Conference & Exposition 2015 (AWWA), Anaheim, CA, USA, 7–10 June 2015.
- Zhao, W.; Xie, H.; Li, J.; Zhang, L.; Zhao, Y. Application of Alum Sludge in Wastewater Treatment Processes: “Science” of Reuse and Reclamation Pathways. Process 2021, 9, 612.
- Park, S.; Kurosawa, K.; Yahata, H. Evaluation of water treatment residue as a soil substitute material compared to decomposed granite soil on the growth of greening trees. Bull. Inst. Trop. Agric. 2009, 32, 93–100.
- Oh, T.-K.; Nakaji, K.; Park, S.-G. Effects of the Application of Water Treatment Sludge on Growth of Lettuce (Lactuca sativa L.) and Changes in Soil Properties. J. Fac. Agric. Kyushu Univ. 2010, 55, 15–20.
- Albuquerque, A.; Scalize, P.; Neto, A. Water treatment sludge as potential soil amendment for native plants of the Brazilian Cerrado. Environ. Eng. Manag. J. 2018, 17, 1169–1178.
- Liu, R.; Zhao, Y.; Sibille, C.; Ren, B. Evaluation of natural organic matter release from alum sludge reuse in wastewater treatment and its role in P adsorption. Chem. Eng. J. 2016, 302, 120–127.
- Muisa, N.; Nhapi, I.; Ruziwa, W.; Manyuchi, M.M. Utilization of alum sludge as adsorbent for phosphorus removal in municipal wastewater: A review. J. Water Process. Eng. 2020, 35, 101187.
- Shen, C.; Zhao, Y.; Li, W.; Yang, Y.; Liu, R.; Morgen, D. Global profile of heavy metals and semimetals adsorption using drinking water treatment residual. Chem. Eng. J. 2019, 372, 1019–1027.
- USEPA. Drinking Water Treatment Plant Residuals Management; Technical Report, EPA 820-R-11-003; United States Environmental Protection Agency (USEPA): Washington, DC, USA, 2011; 377p.
- Zhou, Z.; Yang, Y.; Li, X.; Gao, W.; Liang, H.; Li, G. Coagulation efficiency and flocs characteristics of recycling sludge during treatment of low temperature and micro-polluted water. J. Environ. Sci. 2012, 24, 1014–1020.
- Scalize, P.S.; Souza, L.M.D.; Albuquerque, A. Reuse of alum sludge for reducing flocculant addition in water treatment plants. Environ. Prot. Eng. 2019, 45, 57–70.
- Carvalho, E. Disposal of Waste Generated at Water Treatment Plants in Sewage Treatment Plants with Primary Settling. Ph.D. Thesis, University of Sao Paulo, Sao Paulo, Brazil, 2000; 224p. (In Portuguese)
- Guan, X.-H.; Chen, G.; Shang, C. Re-use of water treatment works sludge to enhance particulate pollutant removal from sewage. Water Res. 2005, 39, 3433–3440.
- Soares, L.; Scalize, P.; Albuquerque, A. Water treatment sludge for post-treatment of effluents from stabilization pond. In Proceedings of the 10th IWA Specialist Ponds Conference, Cartagena, Colombia, 19–22 August 2013; 8p.
- Xu, D.; Lee, L.Y.; Lim, F.Y.; Lyu, Z.; Zhu, H.; Ong, S.L.; Hu, J. Water treatment residual: A critical review of its applications on pollutant removal from stormwater runoff and future perspectives. J. Environ. Manag. 2020, 259, 109649.
- Shanmugam, S. Granulation techniques and technologies: Recent progresses. BioImpacts 2015, 5, 55–63.
- Hussain, A.; Dubey, S.K. Specific methanogenic activity test for anaerobic degradation of influents. Appl. Water Sci. 2015, 7, 535–542.
- Ayres, R.; Mara, D. Analysis of Wastewater for Use in Agriculture: A Laboratory Manual of Parasitological and Bacteriological Techniques; World Health Organization: Geneva, Switzerland, 1996; 35p.
- Aquino, S.F.; Chernicharo, C.A.L.; Foresti, E.; Santos, M.D.L.F.D.; Monteggia, L.O. Metodologias para determinação da atividade metanogênica específica (AME) em lodos anaeróbios. Eng. Sanit. Ambient. 2007, 12, 192–201.
- APHA-AWWA-WEF. Standard Methods for the Examination of Water and Wastewater, 20th ed.; American Public Health Association/American Waterworks Association/Water Environmental Federation: Washington, DC, USA, 2005.
- Da Silva, J.D.; Schneiders, D.; Till, A.; Lapa, K.R.; Pinheiro, A. Specific methanogenic activity (SMA) of industrial sludge from the aerobic and anaerobic biological treatment. Ambient. Agua Interdiscip. J. Appl. Sci. 2013, 8, 135–145.
- Ali, S.S.; Sun, J. Effective thermal pretreatment of water hyacinth (Eichhornia crassipes) for the enhancement of biomethanation: VIT® gene probe technology for microbial community analysis with special reference to methanogenic Archaea. J. Environ. Chem. Eng. 2019, 7, 102853.


