 +1 credit
| Version | Summary | Created by | Modification | Content Size | Created at | Operation |
|---|---|---|---|---|---|---|
| 1 | Md Hasanuzzaman | + 5648 word(s) | 5648 | 2022-02-09 04:59:45 | | | |
| 2 | Vivi Li | + 69 word(s) | 5717 | 2022-02-10 07:12:42 | | | | |
| 3 | Vivi Li | Meta information modification | 5717 | 2022-02-10 11:03:27 | | | | |
| 4 | Vivi Li | Meta information modification | 5717 | 2022-02-10 11:08:07 | | | | |
| 5 | Vivi Li | Meta information modification | 5717 | 2022-02-10 11:09:13 | | |
Video Upload Options
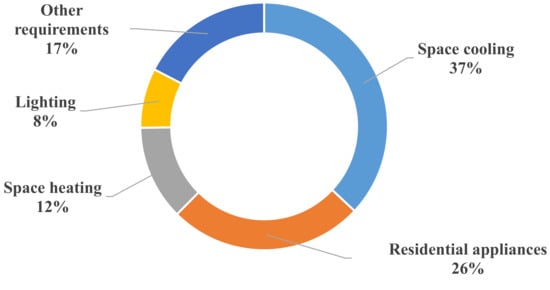
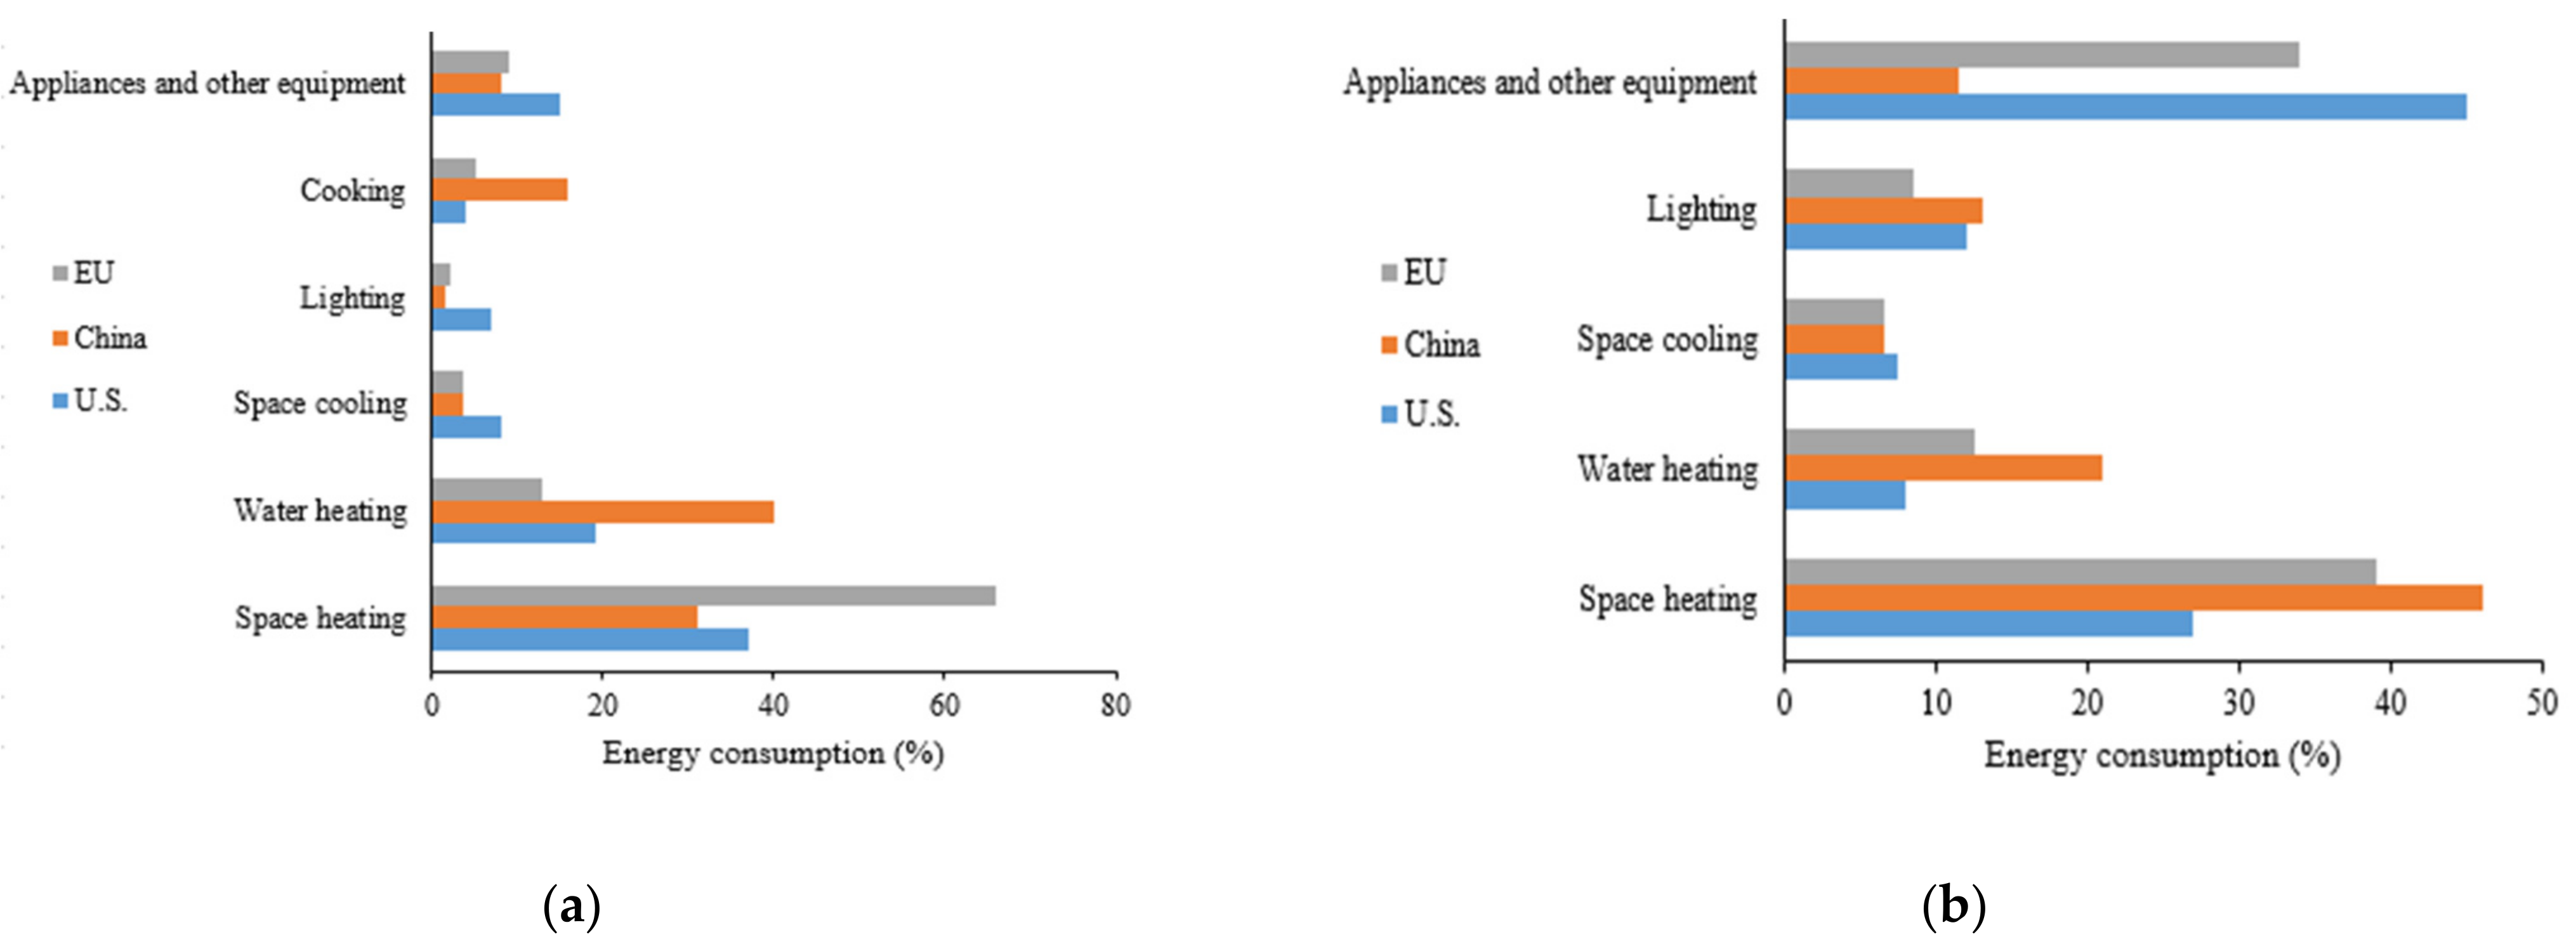
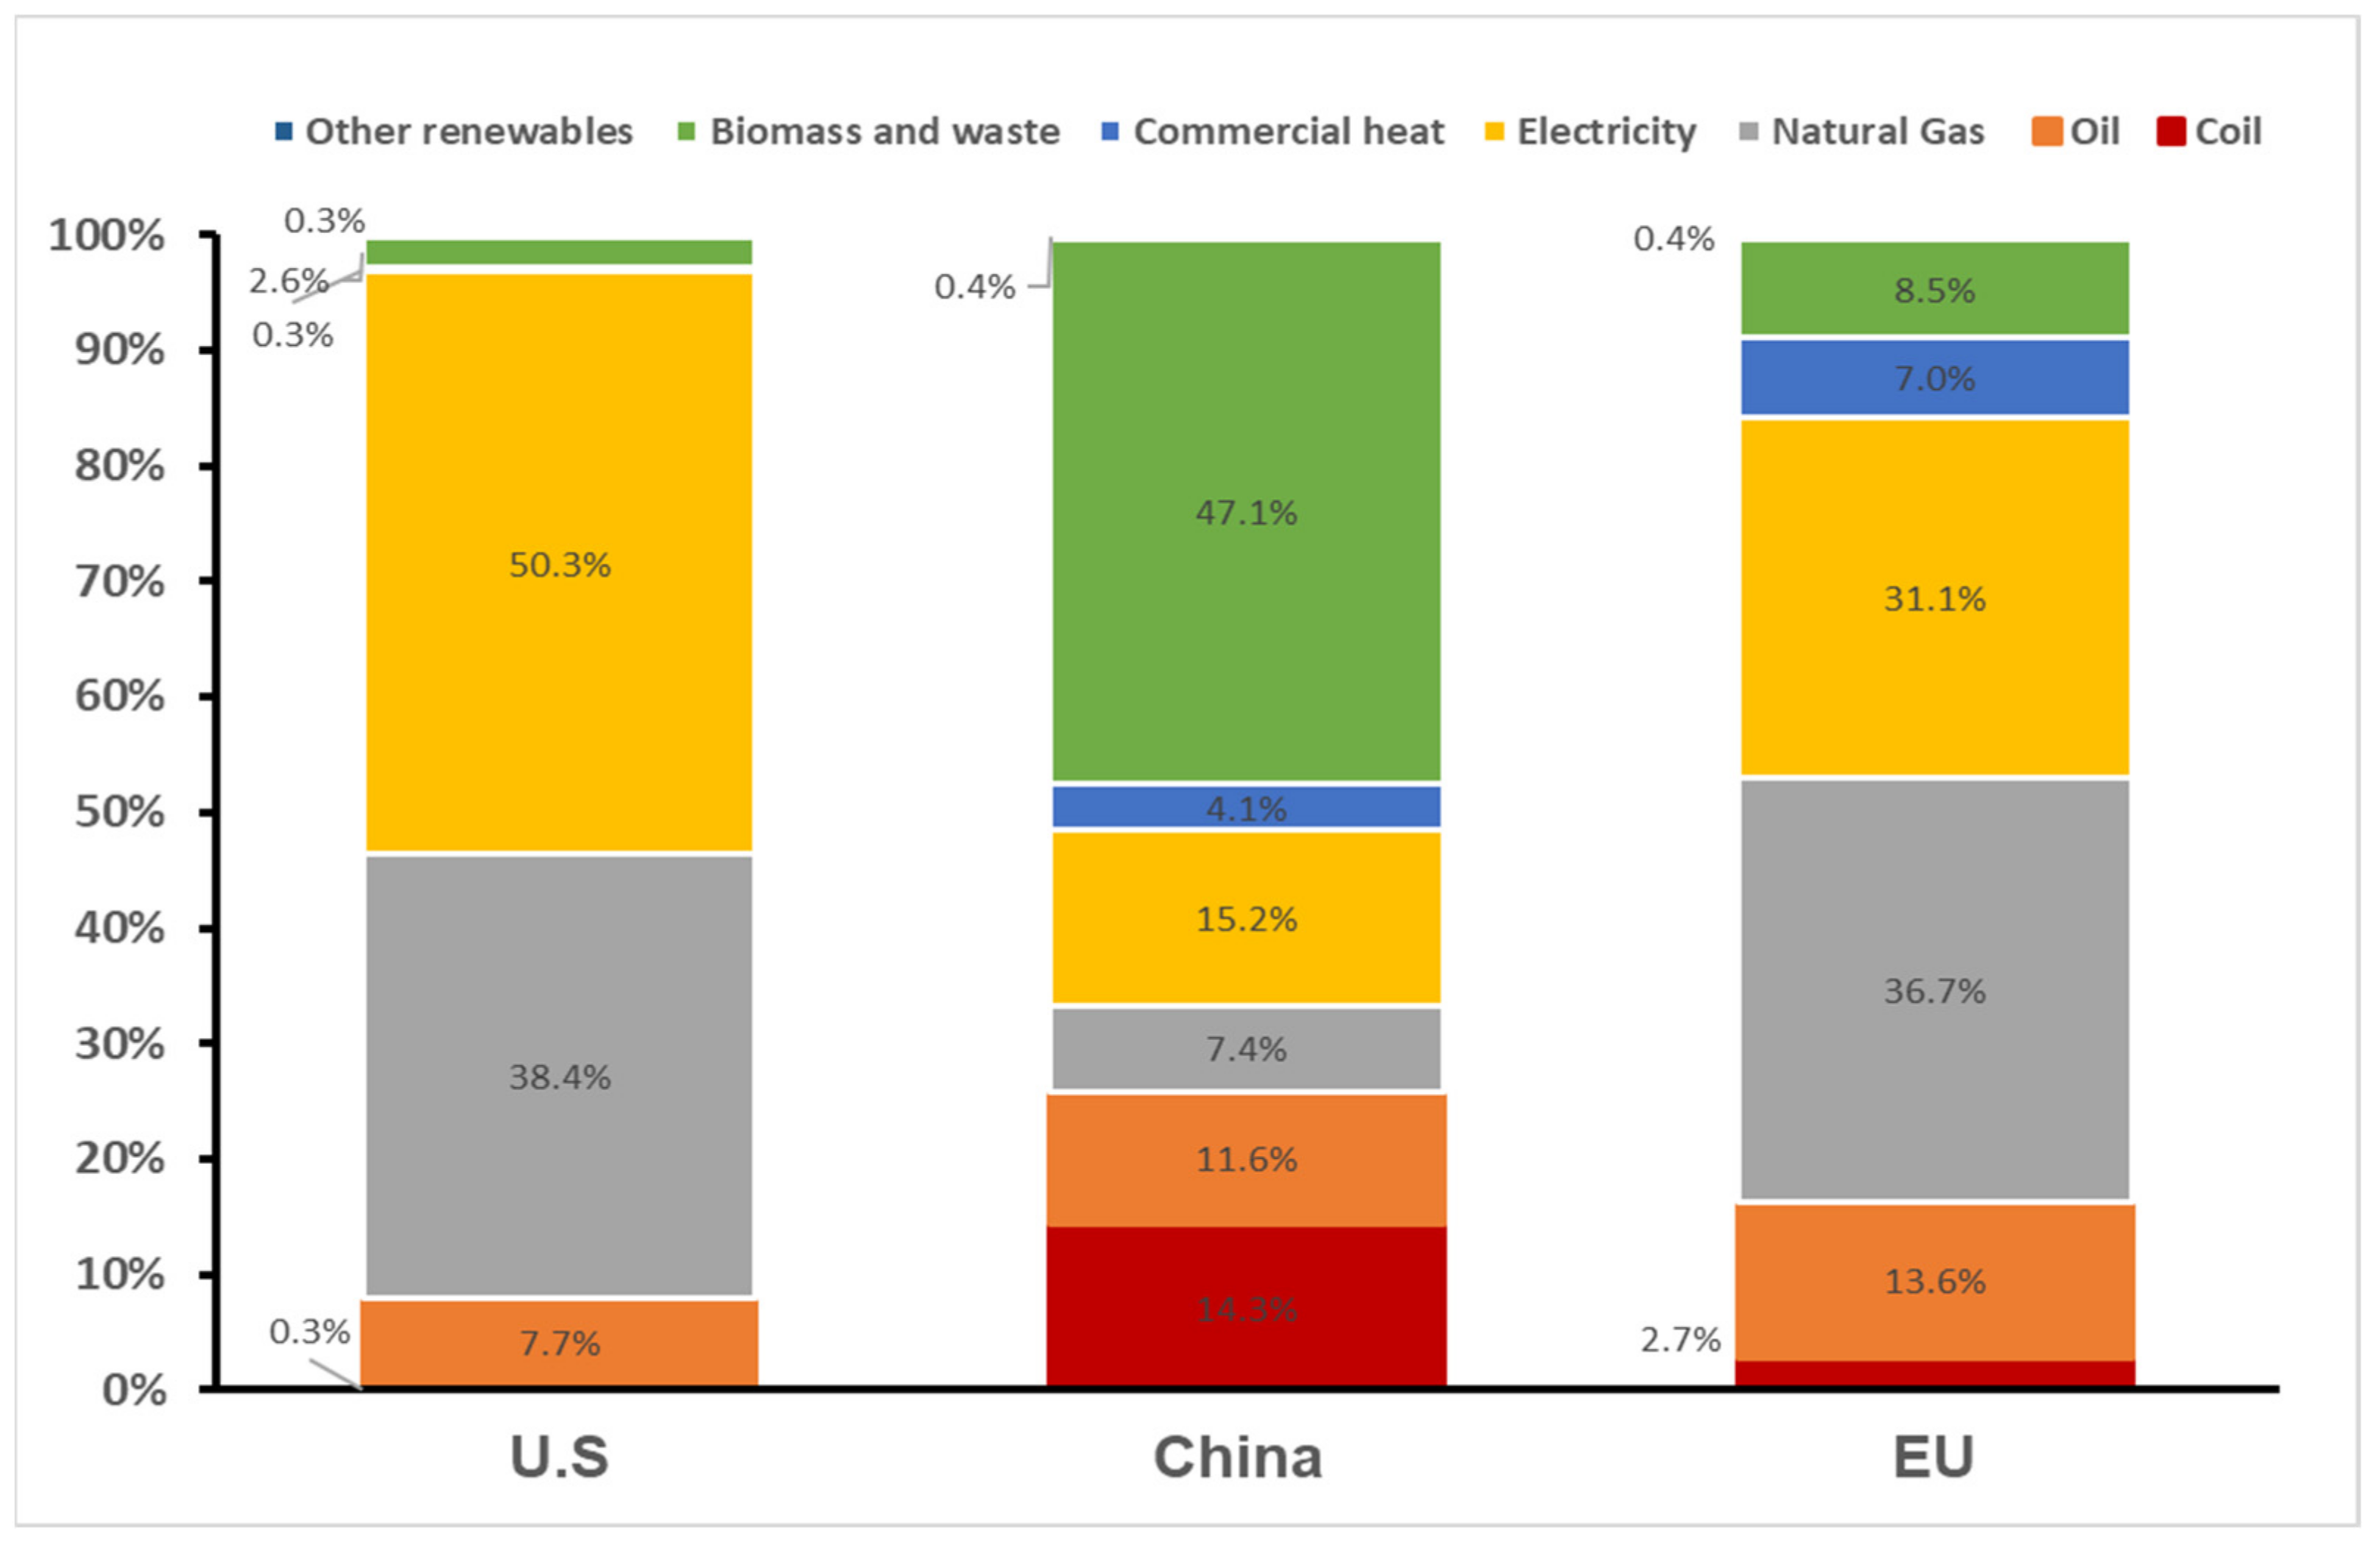
Generally, energy used in a building can be accrued in various ways and a statistical process can be used for studying the building’s overall performance and minimizing the energy requirement of the building. Different statistical models are used to interpret the real-world data in terms of individual theory to develop energy-efficient buildings. Underfloor air distribution, double-glazed windows, use of highly efficient electric motors and variable speed drives may play a great role in reducing building energy consumption. In the UK, the application of double-glazed windows in commercial buildings can save 39–53% energy. The proper maintenance of a building’s central heating system can save up to 11% energy. The automatic HVAC control system can reduce up to 20% of the building’s total heating load. Proper utilization of a VSD system in motor and building performance optimization by an ANOVA tool also proved instrumental in saving energy.
1. Introduction
2. Energy-Saving Technologies in Building System
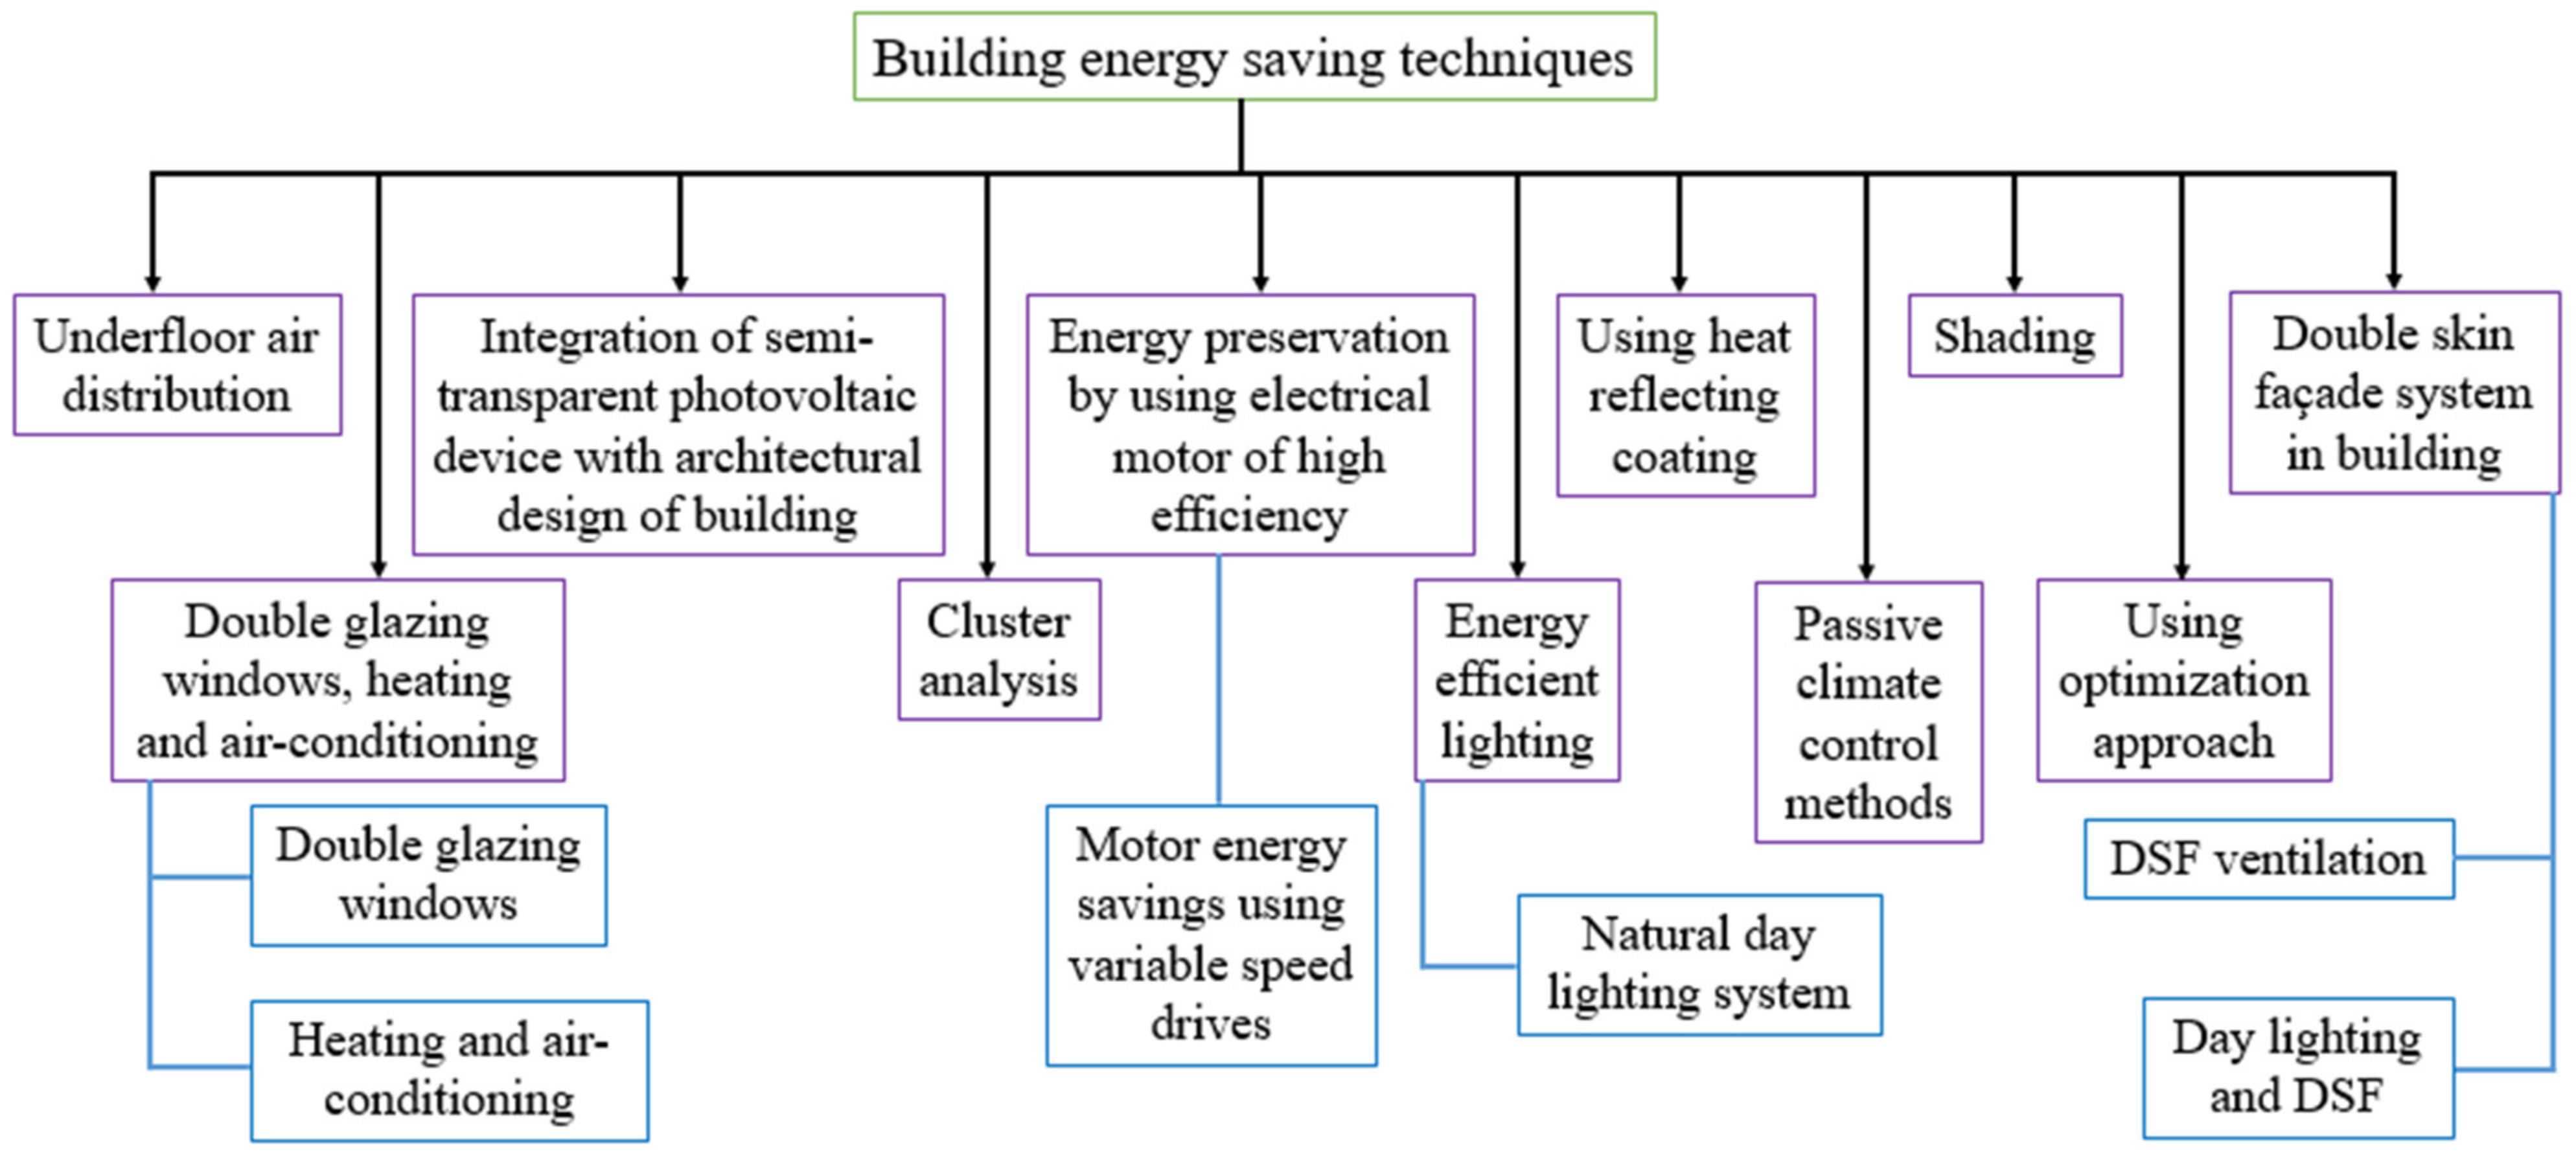
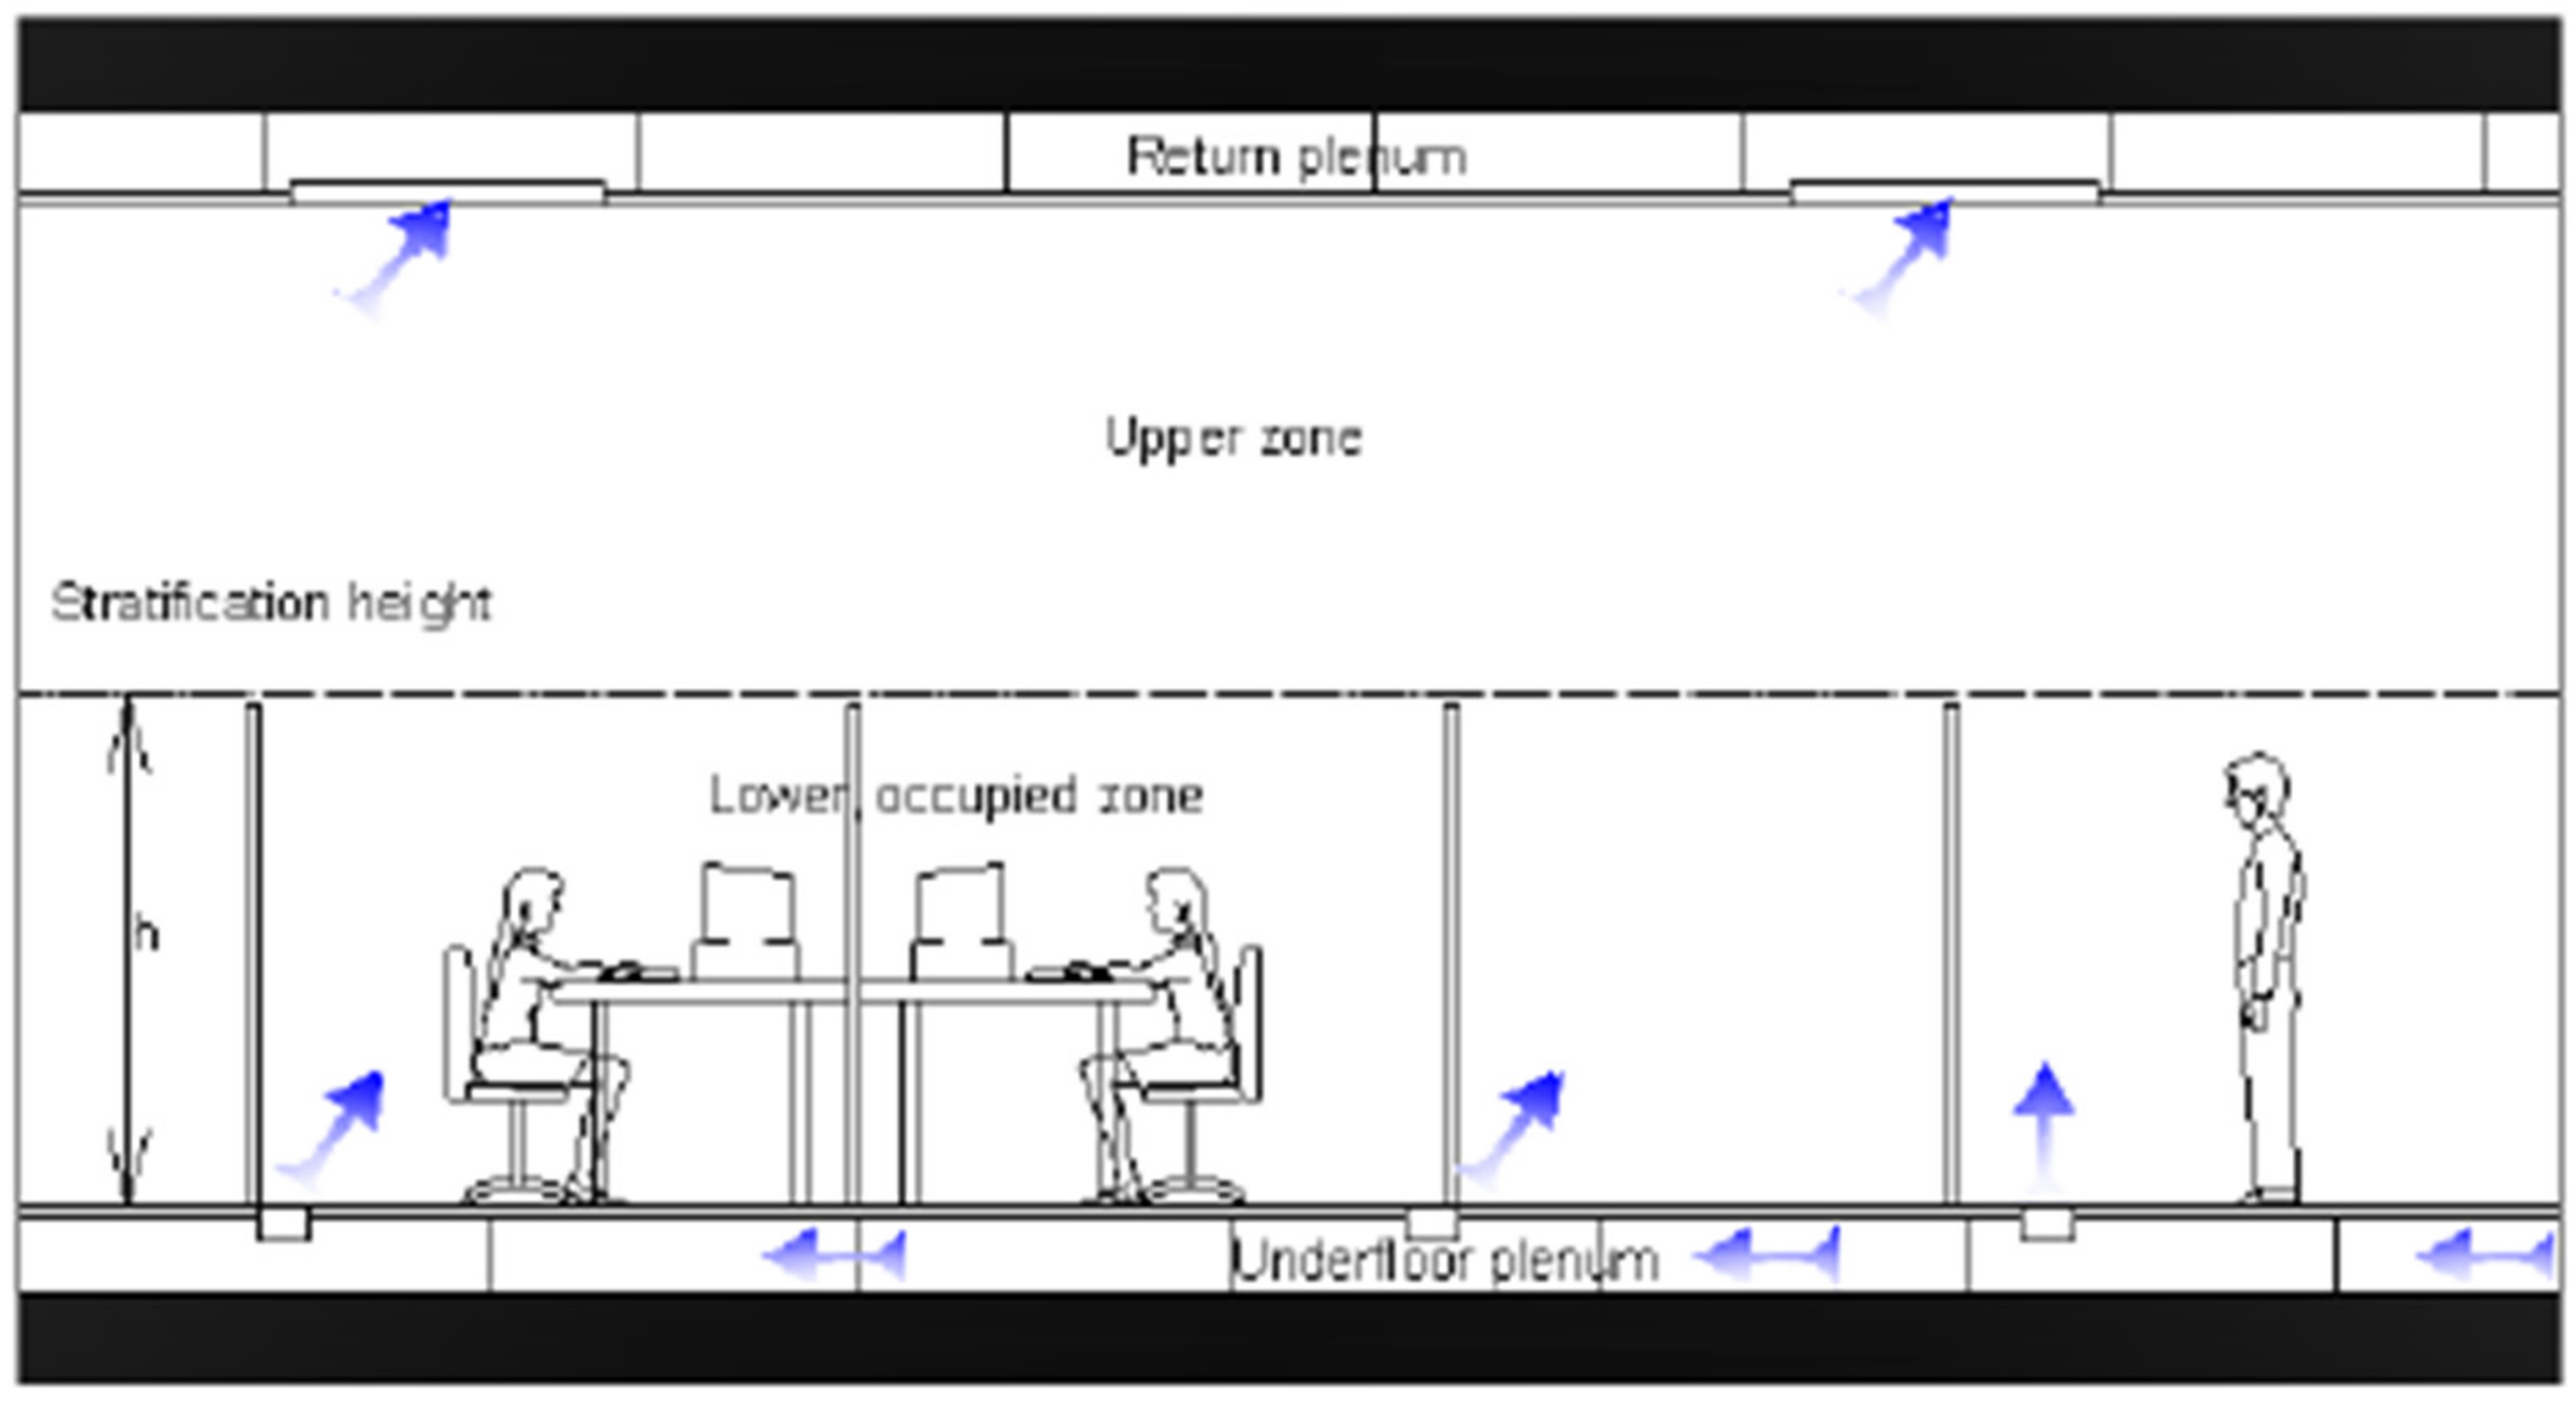
2.1. Underfloor Air Distribution (UFAD)
-
Local environment can be controlled to increase the thermal comfort for individual occupants.
-
Efficiency of ventilation and quality of indoor air can be improved by supplying fresh air at the zone of floor level or nearby the occupant.
-
Energy use in the building can be saved by controlling the temperature of supply air between 17 and 20 °C for the UFAD system, or at 13 °C for overhead systems, to improve COP of HVAC.
-
Energy savings from the fan are related to the lower atmospheric static pressure ranging from 12.5 to 5.0 Pascal. Depending on the design strategy it is necessary to reduce the central fan energy use compared to the overhead air distribution system because of extremely low operational statistic pressures (pressures are typically 0.1 in H2O (25 Pa) or less) in the underfloor air distribution system.
-
Height between two floors for newly developed construction can be decreased so that the average service plenum height would be reduced. About a 5–10% decrease in floor-to-floor heights could be reduced in a building that uses UFAD compared to CBAD. This can be achieved by minimizing the service plenum’s overall height and/or by using a concrete (flat slab) structural approach.
-
Health and productivity can be improved.
-
Expenditure related to inhabitant churn, varying interior and remodeling can be reduced [22].
-
Unfamiliar new technology that includes design of the entire building, construction of the building and its operation process.
-
The lack of understanding of some new but fundamental elements, such as stratification of indoor room air, plenum performance of underfloor airflow and leakage phenomena considerations, as well as the performance of the entire building.
-
Higher installation costs compared with the overhead system.
-
Mold growth and condensation might take place in concrete slabs when the temperature of supply air is lower than 17 °C or 63 °F.
-
Accumulation of mold and dirt, if a timely cleaning process is not conducted.
-
Difficulty to maintain necessary plenum pressure, as all surfaces must be leak-proof and air leakage into the occupied space is wasted energy [25].
-
The wall should be heat-insulating.
-
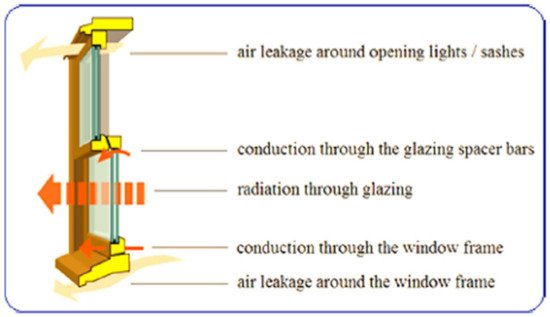
Architectural doors and windows for lower energy consumption. This is because the thermal characteristics of windows, as well as doors, give a major impact on air conditioning energy use which is the main thermal layout of winter and summer buildings.
-
Energy-saving glass should be used.
-
Composite doors or windows devoted to materials should be applied or improved.
-
The door, curtain, wall and windows installation system should be improved.
-
The roof should be heat insulating.
-
Building energy preservation technology should be developed effectively.
-
Building an energy management system should be implemented.
2.2. Heating, Cooling and Window Systems
2.2.1. Heating and Air Conditioning
2.2.2. Double Glazing Windows
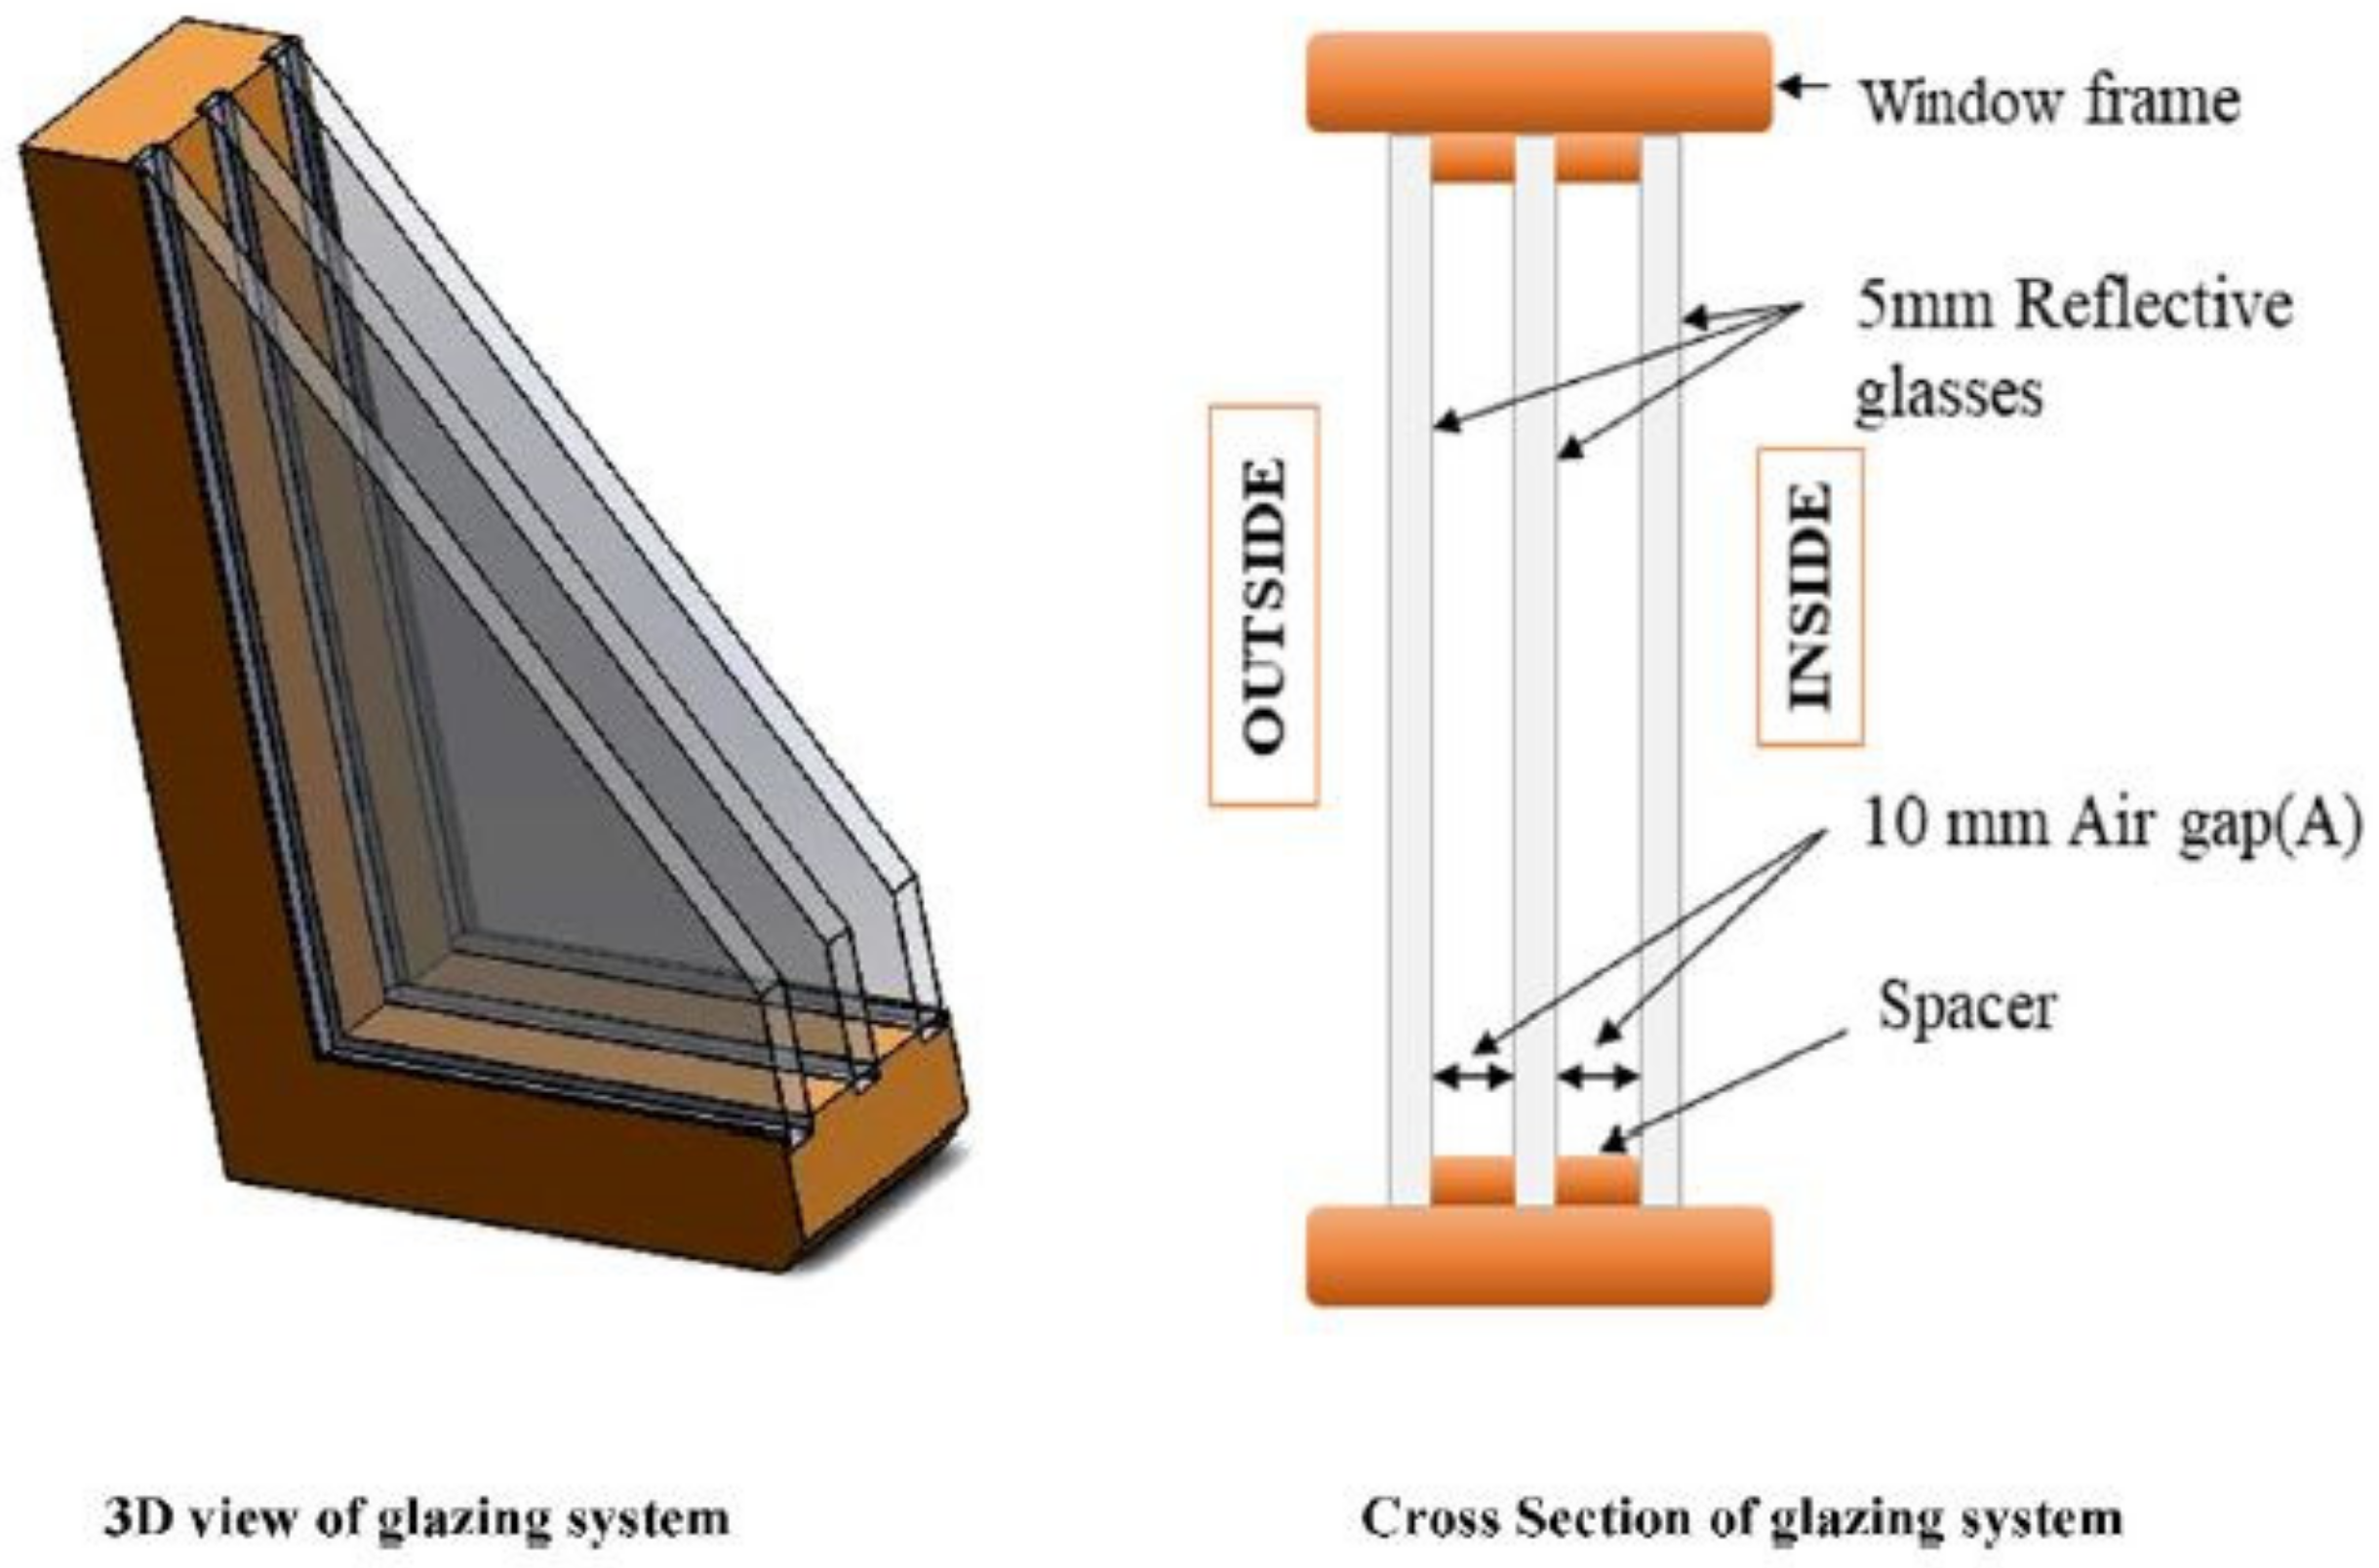
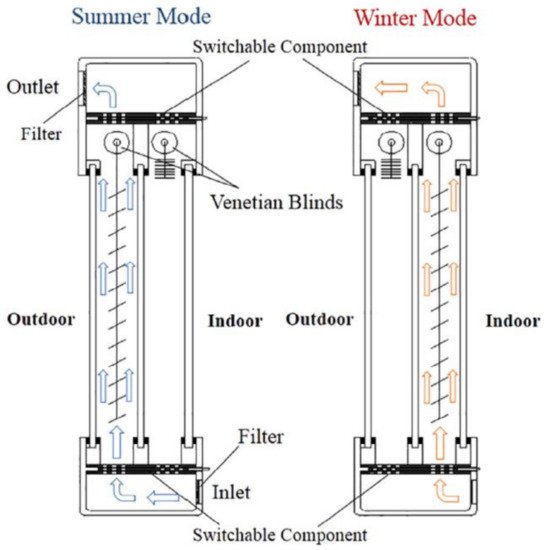
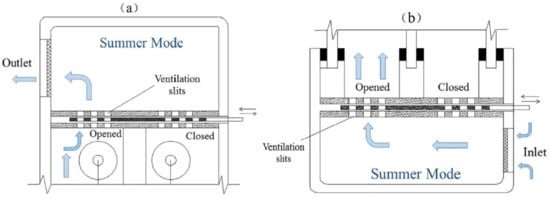
2.2.3. Triple Glazing and Super-Insulated Windows
2.3. Energy Preservation by Using the Electrical Motor of High-Efficiency
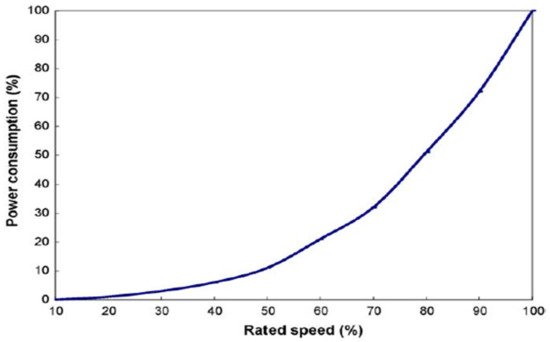
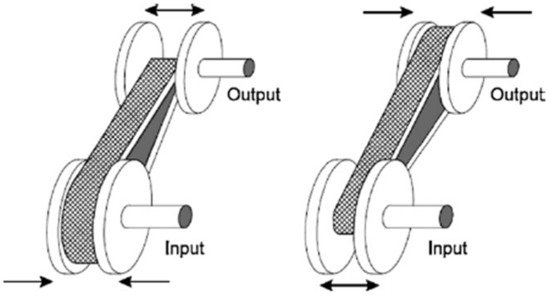
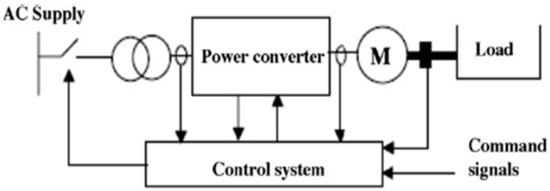
Motor Energy Savings Utilizing VSDs
-
Savings of energy.
-
Improvement of efficiency over increasing of power factor of the system.
-
Simplification of pipe systems (removal of by-pass lines and control valves).
-
Normal starting and stopping procedure.
-
Dynamic response leads to better control compared to DC drives.
2.4. Cluster Analysis
2.5. Performance Enhance by Using the Optimization Approach
References
- Jeon, J.; Lee, J.H.; Seo, J.; Jeong, S.G.; Kim, S. Application of PCM thermal energy storage system to reduce building energy consumption. J. Therm. Anal. Calorim. 2013, 111, 279–288.
- Fan, C.; Xiao, F.; Wang, S. Development of prediction models for next-day building energy consumption and peak power demand using data mining techniques. Appl. Energy 2014, 127, 1–10.
- Wan, K.K.W.; Li, D.H.W.; Liu, D.; Lam, J.C. Future trends of building heating and cooling loads and energy consumption in different climates. Build. Environ. 2011, 46, 223–234.
- Ma, H.; Du, N.; Yu, S.; Lu, W.; Zhang, Z.; Deng, N.; Li, C. Analysis of typical public building energy consumption in northern China. Energy Build. 2017, 136, 139–150.
- Rathore, S.P.K.; Shukla, S.K.; Gupta, N.K. Potential of microencapsulated PCM for energy savings in buildings: A critical review. Sust. Cities Soc. 2020, 53, 101884.
- Pérez-Lombard, L.; Ortiz, J.; Pout, C. A review on buildings energy consumption information. Energy Build. 2008, 40, 394–398.
- Amasyali, K.; El-Gohary, N.M. A review of data-driven building energy consumption prediction studies. Renew. Sust. Energy Rev. 2018, 81, 1192–1205.
- Berardi, U. A cross-country comparison of the building energy consumptions and their trends. Resour. Conserv. Recycl. 2017, 123, 230–241.
- Cao, X.; Dai, X.; Liu, J. Building energy-consumption status worldwide and the state-of-the-art technologies for zero-energy buildings during the past decade. Energy Build. 2016, 128, 198–213.
- Ekici, B.B.; Aksoy, U.T. Prediction of building energy consumption by using artificial neural networks. Adv. Eng. Softw. 2009, 40, 356–362.
- Yang, L.; Yan, H.; Lam, J.C. Thermal comfort and building energy consumption implications—A review. Appl. Energy 2014, 115, 164–173.
- Ma, M.; Ma, X.; Cai, W.; Cai, W. Low carbon roadmap of residential building sector in China: Historical mitigation and prospective peak. Appl. Energy 2020, 273, 115247.
- Chen, M.; Ma, M.; Lin, Y.; Ma, Z.; Li, K. Carbon Kuznets curve in China’s building operations: Retrospective and prospective trajectories. Sci. Total Environ. 2022, 803, 150104.
- Yang, Z.; Liu, B.; Zhao, H. Energy Saving in Building Construction in China: A Review. Int. J. Green Energy 2004, 1, 209–225.
- Santamouris, M.; Mihalakakou, G.; Patargias, P.; Gaitani, N.; Sfakianaki, K.; Papaglastra, M.; Pavlou, C.; Doukas, P.; Primikiri, E.; Geros, V.; et al. Using intelligent clustering techniques to classify the energy performance of school buildings. Energy Build. 2007, 39, 45–51.
- Saidur, R.; Rahim, N.A.; Hasanuzzaman, M. A review on compressed-air energy use and energy savings. Renew. Sust. Energy Rev. 2010, 14, 1135–1153.
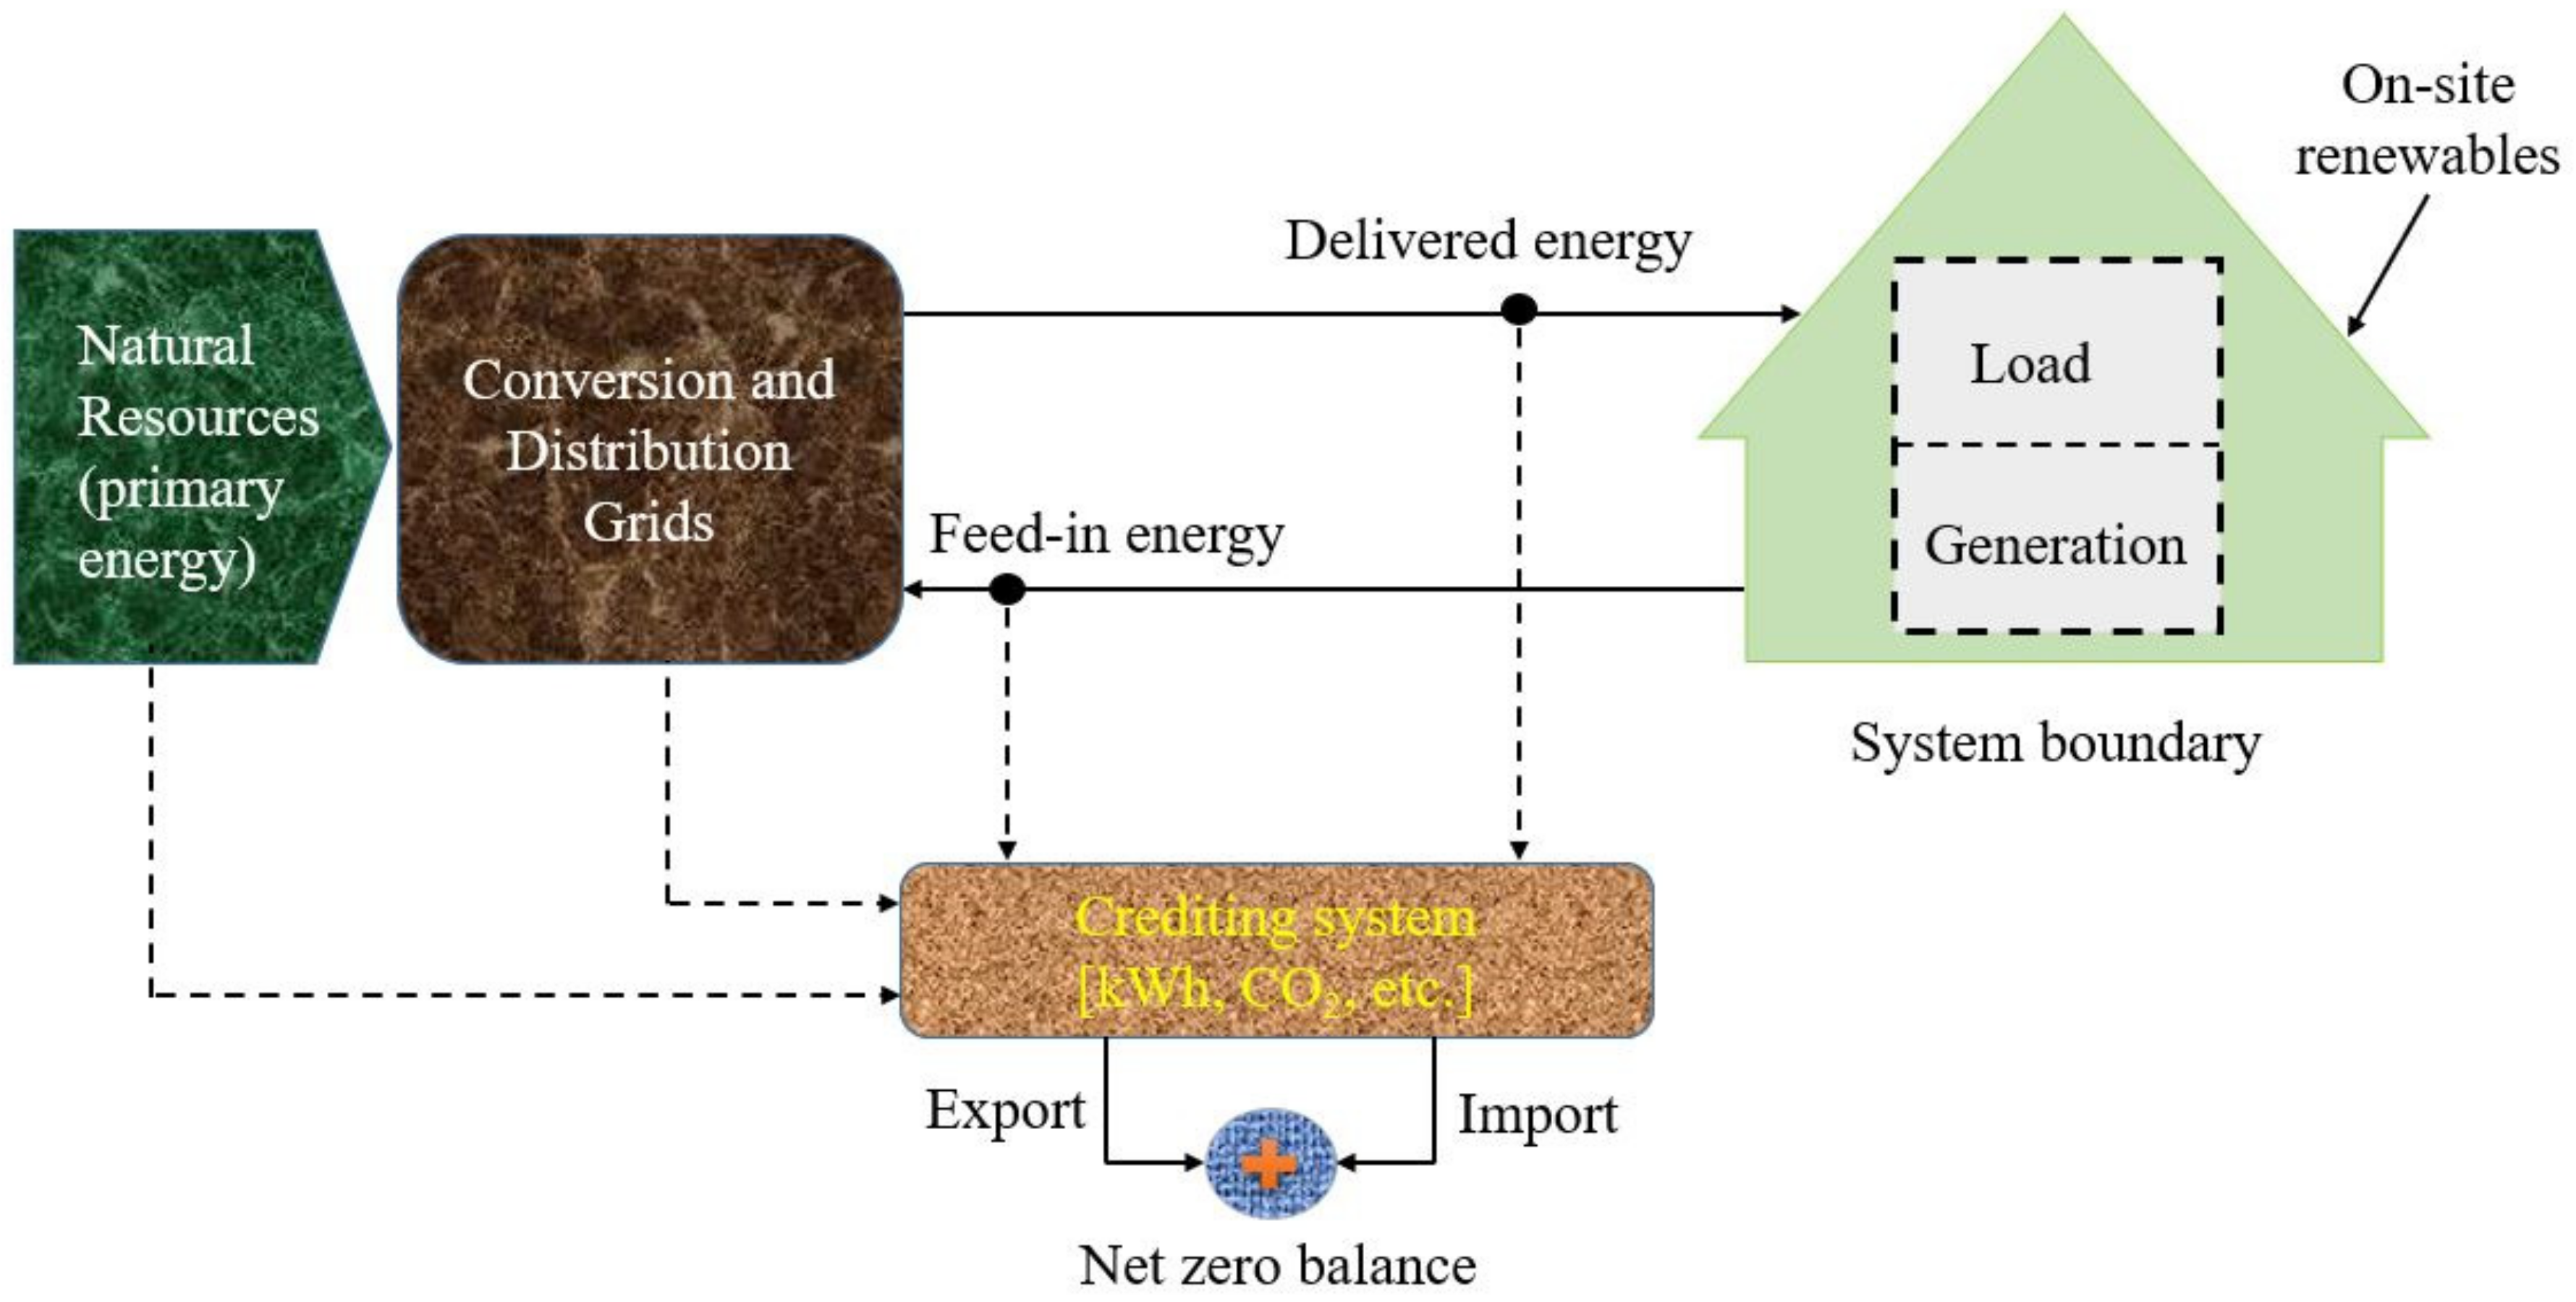
- Sartori, I.; Napolitano, A.; Marszal, A.; Pless, S.; Torcellini, P.; Voss, K. Criteria for Definition of Net Zero Energy Buildings. In Proceedings of the International Conference on Solar Heating, Cooling and Buildings (EuroSun 2010), Graz, Austria, 28 September–1 October 2010.
- Bauman, F.; Webster, T. Outlook for underfloor air distribution. ASHRAE J. 2001. Available online: https://escholarship.org/content/qt5v60x57q/qt5v60x57q.pdf?t=lptbr7 (accessed on 11 November 2021).
- Daly, A. Underfloor air distribution: Lessons learned. ASHRAE J. 2002, 44, 21–24.
- Hanl, H.; Chung, K.S.; Jang, K.J. Thermal and Ventilation Characteristics in a Room with Underfloor Air-Conditioning System. Available online: https://www.aivc.org/sites/default/files/members_area/medias/pdf/Conf/1999/paper061.pdf (accessed on 11 November 2021).
- Kim, G.; Schaefer, L.; Lim, T.S.; Kim, J.T. Thermal comfort prediction of an underfloor air distribution system in a large indoor environment. Energy Build. 2013, 64, 323–331.
- Bauman, F.; Pecora, P.; Webster, T. How Low Can You Go? Air Flow Performance of Low-Height Underfloor Plenums. 1999. Available online: https://escholarship.org/content/qt5rx3p5w4/qt5rx3p5w4.pdf (accessed on 11 November 2021).
- Addison, M.S.; Nall, D.H. Cooling via Underfloor Air Distribution: Current Design Issues and Analysis Options. Cool. Front. Adv. Edge Cool. Res. Appl. Built Environ. 2001. Available online: https://d1wqtxts1xzle7.cloudfront.net/34935734/addison-nall_underfloorairdistpaper_rev1.pdf?1412059352=&response-content-disposition=inline%3B+filename%3DCooling_via_Underfloor_Air_Distribution.pdf&Expires=1642792282&Signature=UqZCsHrTtcMjtZofBDAx43Zjpv1Tn2aENL-FSiE4zKzTT-qc~8S7glmcQh7ogTtfwIsRVlJQ4CrOS399FvVc-itJ~hg3nhVnNQQ6IxaIgFYJ3hskxhIzWSKPRVHObXi64e4ymFhNgngeEsfQ2n7KhePynhHJQQQBtYZrvVvZmK3ZuGbuuc0nTxRTEm18hOjVFEYbopAERFUVKeMPTNV5xDN1YuN65VZegfyGNezcwEDQIDtyzC90WhbEPNTQQdqdcrWHV445crR-XyuSciKorde09u2g-9AtYSafmpczUq5D65xI2iqG2-uw0qm5mnXukqkAK7pTVQ9aOKKTKMo5Rw__&Key-Pair-Id=APKAJLOHF5GGSLRBV4ZA (accessed on 11 November 2021).
- Webster, T.; Bauman, F.; Shi, M.; Reese, J. Thermal Stratification Performance of Underfloor Air Distribution (UFAD) Systems; Center for the Built Environment, University of California: Berkeley, CA, USA, 2002.
- Bauman, F. Underfloor Air Distribution (UFAD) Design Guide; American Society of Heating, Refrigerating and Air-Conditioning Engineers: Atlanta, GA, USA, 2003. Available online: https://www.academia.edu/35838362/Underfloor_Air_Distribution_UFAD_Design_Guide (accessed on 11 November 2021).
- Jing, G.; Yu, B.; Lisheng, L. Current Situation and Countermeasures of Energy-saving Buildings in Wuhan City Circle. Energy Procedia 2011, 5, 664–668.
- Ali, S.B.M.; Hasanuzzaman, M.; Rahim, N.A.; Mamun, M.A.A.; Obaidellah, U.H. Analysis of energy consumption and potential energy savings of an institutional building in Malaysia. Alex. Eng. J. 2021, 60, 805–820.
- Tsagarakis, K.P.; Karyotakis, K.; Zografakis, N. Implementation conditions for energy saving technologies and practices in office buildings: Part 2. Double glazing windows, heating and air-conditioning. Renew. Sust. Energy Rev. 2012, 16, 3986–3998.
- Bruhns, H.; Wyatt, P. A data framework for measuring the energy consumption of the non-domestic building stock. Build. Res. Inf. 2011, 39, 211–226.
- Siew, C.C.; Che-Ani, A.I.; Tawil, N.M.; Abdullah, N.A.G.; Tahir, M.M. Classification of Natural Ventilation Strategies in Optimizing Energy Consumption in Malaysian Office Buildings. Procedia Eng. 2011, 20, 363–371.
- Hu, S.; Zhang, Y.; Wang, S.; Sheng, X. Experimental Study on Air Conditioning Energy Consumption of an Office Building in Qingdao. In Proceedings of the 2011 International Conference on Computer Distributed Control and Intelligent Environmental Monitoring, Changsha, China, 19–20 February 2011.
- Rhodes, J.D.; Stephens, B.; Webber, M.E. Using energy audits to investigate the impacts of common air-conditioning design and installation issues on peak power demand and energy consumption in Austin, Texas. Energy Build. 2011, 43, 3271–3278.
- Perna, C.D.; Mengaroni, E.; Fuselli, L.; Stazi, A. Ventilation Strategies in School Buildings for Optimization of Air Quality, Energy Consumption and Environmental Comfort in Mediterranean Climates. Int. J. Vent. 2011, 10, 61–78.
- Panayiotou, G.P.; Kalogirou, S.A.; Florides, G.A.; Maxoulis, C.N.; Papadopoulos, A.M.; Neophytou, M.; Fokaides, P.; Georgiou, G.; Symeou, A.; Georgakis, G. The characteristics and the energy behaviour of the residential building stock of Cyprus in view of Directive 2002/91/EC. Energy Build. 2010, 42, 2083–2089.
- Murakami, Y.; Terano, M.; Obayashi, F.; Honma, M. Development of Cooperative Building Controller for Energy Saving and Comfortable Environment. In Human Interface and the Management of Information. Interacting in Information Environments; Springer: Berlin/Heidelberg, Germany, 2007.
- Balaras, C.A.; Gaglia, A.G.; Georgopoulou, E.; Mirasgedis, S.; Sarafidis, Y.; Lalas, D.P. European residential buildings and empirical assessment of the Hellenic building stock, energy consumption, emissions and potential energy savings. Build. Environ. 2007, 42, 1298–1314.
- Algburi, O.; Beyhan, F. Cooling Load Reduction in a Single–Family House, an Energy–Efficient Approach. Gazi Univ. J. Sci. 2019, 32, 385–400.
- Kolokotroni, M.; Robinson-Gayle, S.; Tanno, S.; Cripps, A. Environmental impact analysis for typical office facades. Build. Res. Informat. 2004, 32, 2–16.
- Mortimer, N.D.; Ashley, A.; Moody, C.A.C.; Rix, J.H.R.; Moss, S.A. Carbon dioxide savings in the commercial building sector. Energy Policy 1998, 26, 615–624.
- Wang, N.; Zhang, J.; Xia, X. Energy consumption of air conditioners at different temperature set points. Energy Build. 2013, 65, 412–418.
- Chinnakani, K.; Krishnamurthy, A.; Moyne, J.; Arbor, A.; Gu, F. Comparison of energy consumption in HVAC systems using simple ON-OFF, intelligent ON-OFF and optimal controllers. In Proceedings of the 2011 IEEE Power and Energy Society General Meeting, Detroit, MI, USA, 24–28 July 2011.
- Karabay, H.; Arıcı, M. Multiple pane window applications in various climatic regions of Turkey. Energy Build. 2012, 45, 67–71.
- Freire, R.Z.; Mazuroski, W.; Abadie, M.O.; Mendes, N. Capacitive effect on the heat transfer through building glazing systems. Appl. Energy 2011, 88, 4310–4319.
- Gasparella, A.; Pernigotto, G.; Cappelletti, F.; Romagnoni, P.; Baggio, P. Analysis and modelling of window and glazing systems energy performance for a well insulated residential building. Energy Build. 2011, 43, 1030–1037.
- Gijón-Rivera, M.; Álvarez, G.; Beausoleil-Morrison, I.; Xamán, J. Appraisal of thermal performance of a glazed office with a solar control coating: Cases in Mexico and Canada. Build. Environ. 2011, 46, 1223–1233.
- Garvin, S.L.; Wilson, J. Environmental conditions in window frames with double-glazing units. Constr. Build. Mater. 1998, 12, 289–302.
- Cuce, E. Accurate and reliable U -value assessment of argon-filled double glazed windows: A numerical and experimental investigation. Energy Build 2018, 171, 100–106.
- Gorantla, K.; Shaik, S.; Kontoleon, K.J.; Mazzeo, D.; Maduru, V.R.; Shaik, S.V. Sustainable reflective triple glazing design strategies: Spectral characteristics, air-conditioning cost savings, daylight factors, and payback periods. J. Build. Eng. 2021, 42, 103089.
- Zhang, C.; Wang, J.; Xu, X.; Zou, F.; Yu, J. Modeling and thermal performance evaluation of a switchable triple glazing exhaust air window. Appl. Therm. Eng. 2016, 92, 8–17.
- Liu, M.; Heiselberg, P.; Antonov, Y.; Mikkelsen, F. Parametric analysis on the heat transfer, daylight and thermal comfort for a sustainable roof window with triple glazing and external shutter. Energy Build. 2019, 183, 209–221.
- Su, L.; Fraaß, M.; Kloas, M.; Wondraczek, L. Performance Analysis of Multi-Purpose Fluidic Windows Based on Structured Glass-Glass Laminates in a Triple Glazing. Front. Mater. 2019, 6, 102.
- Liu, C.; Lyu, Y.; Li, C.; Li, J.; Zhuo, K.; Su, H. Thermal performance testing of triple-glazing water flow window in cooing operation. Sol. Energy 2021, 218, 108–116.
- Larsson, U.; Moshfegh, B.; Sandberg, M. Thermal analysis of super insulated windows (numerical and experimental investigations). Energy Build. 1999, 29, 121–128.
- Garnier, C.; Muneer, T.; McCauley, L. Super insulated aerogel windows: Impact on daylighting and thermal performance. Build. Environ. 2015, 94, 231–238.
- Akbaba, M. Energy conservation by using energy efficient electric motors. Appl. Energy 1999, 64, 149–158.
- Saidur, R. A review on electrical motors energy use and energy savings. Renew. Sust. Energy Rev. 2010, 14, 877–898.
- Garcia, A.G.P.; Szklo, A.S.; Schaeffer, R.; McNeil, M.A. Energy-efficiency standards for electric motors in Brazilian industry. Energy Policy 2007, 35, 3424–3439.
- Saidur, R.; Hasanuzzaman, M.; Mahlia, T.M.I.; Rahim, N.A.; Mohammed, H.A. Chillers energy consumption, energy savings and emission analysis in an institutional buildings. Energy 2011, 36, 5233–5238.
- Teitel, M.; Levi, A.; Zhao, Y.; Barak, M.; Bar-lev, E.; Shmuel, D. Energy saving in agricultural buildings through fan motor control by variable frequency drives. Energy Build. 2008, 40, 953–960.
- Saidur, R.; Mekhilef, S.; Ali, M.B.; Safari, A.; Mohammed, H. Applications of variable speed drive (VSD) in electrical motors energy savings. Renew. Sust. Energy Rev. 2012, 16, 543–550.
- Saidur, R.; Hasanuzzaman, M.; Yogeswaran, S.; Mohammed, H.A.; Hossain, M.S. An end-use energy analysis in a Malaysian public hospital. Energy 2010, 35, 4780–4785.
- Habib, M.; Hasanuzzaman, M.; Hosenuzzaman, M.; Salman, A.; Mehadi, M. Energy consumption, energy saving and emission reduction of a garment industrial building in Bangladesh. Energy 2016, 112, 91–100.
- Bishop, C.M. Pattern Recognition and Machine Learning; Springer: Berlin/Heidelberg, Germany, 2006.
- Ma, C.; Wu, J. Data Clustering: Theory, Algorithms, and Applications. Soc. Ind. Appl. Math. 2007, 20, 44–65.
- Gaitani, N.; Lehmann, C.; Santamouris, M.; Mihalakakou, G.; Patargias, P. Using principal component and cluster analysis in the heating evaluation of the school building sector. Appl. Energy 2010, 87, 2079–2086.
- Petcharat, S.; Chungpaibulpatana, S.; Rakkwamsuk, P. Assessment of potential energy saving using cluster analysis: A case study of lighting systems in buildings. Energy Build. 2012, 52, 145–152.
- Gómez-Muñoz, V.M.; Porta-Gándara, M.A. Local wind patterns for modeling renewable energy systems by means of cluster analysis techniques. Renew. Energy 2002, 25, 171–182.
- Srivastav, A.; Tewari, A.; Dong, B. Baseline building energy modeling and localized uncertainty quantification using Gaussian mixture models. Energy Build. 2013, 65, 438–447.
- Bourdeau, M.; Zhai, X.Q.; Nefzaoui, E.; Guo, X.; Chatellier, P. Modeling and forecasting building energy consumption: A review of data-driven techniques. Sust. Cities Soc. 2019, 48, 101533.
- McLachlan, G.J.; Krishnan, T. The EM Algorithm and Extensions, 2nd ed.; John Wiley & Sons: Hoboken, NJ, USA, 2007.
- Al-Homoud, M.S. Optimum thermal design of office buildings. Int. J. Energy Res. 1997, 21, 941–957.
- Mechri, H.E.; Capozzoli, A.; Corrado, V. USE of the ANOVA approach for sensitive building energy design. Appl. Energy 2010, 87, 3073–3083.
- Wang, W.; Rivard, H.; Zmeureanu, R. Floor shape optimization for green building design. Adv. Eng. Inform. 2006, 20, 363–378.
- Caldas, L.G.; Norford, L.K. A design optimization tool based on a genetic algorithm. Autom. Constr. 2002, 11, 173–184.
- Znouda, E.; Ghrab-Morcos, N.; Hadj-Alouane, A. Optimization of Mediterranean building design using genetic algorithms. Energy Build. 2007, 39, 148–153.

