Your browser does not fully support modern features. Please upgrade for a smoother experience.
Submitted Successfully!
 +1 credit
Thank you for your contribution! You can also upload a video entry or images related to this topic.
For video creation, please contact our Academic Video Service.
| Version | Summary | Created by | Modification | Content Size | Created at | Operation |
|---|---|---|---|---|---|---|
| 1 | Salvador Garcia-Ayllon | + 1985 word(s) | 1985 | 2021-12-30 07:57:27 | | | |
| 2 | Jason Zhu | Meta information modification | 1985 | 2021-12-31 02:45:57 | | | | |
| 3 | Jason Zhu | Meta information modification | 1985 | 2022-01-04 02:32:26 | | |
Video Upload Options
We provide professional Academic Video Service to translate complex research into visually appealing presentations. Would you like to try it?
Cite
If you have any further questions, please contact Encyclopedia Editorial Office.
Garcia-Ayllon, S. Analysis of SUMPs in Spain. Encyclopedia. Available online: https://encyclopedia.pub/entry/17651 (accessed on 26 July 2026).
Garcia-Ayllon S. Analysis of SUMPs in Spain. Encyclopedia. Available at: https://encyclopedia.pub/entry/17651. Accessed July 26, 2026.
Garcia-Ayllon, Salvador. "Analysis of SUMPs in Spain" Encyclopedia, https://encyclopedia.pub/entry/17651 (accessed July 26, 2026).
Garcia-Ayllon, S. (2021, December 30). Analysis of SUMPs in Spain. In Encyclopedia. https://encyclopedia.pub/entry/17651
Garcia-Ayllon, Salvador. "Analysis of SUMPs in Spain." Encyclopedia. Web. 30 December, 2021.
Copy Citation
Sustainable Urban Mobility Plans (SUMP) are increasingly popular planning tools in cities with environmental issues where numerous actions are usually proposed to reduce pollution from urban transport.
SUMP
urban mobility
city planning
hybrid methodology
multi-criteria decision making (MCDM)
1. Introduction
In Spain, the importance of urban mobility has been reflected in the regulatory framework since 2005, and has been supported by generalist decrees, ministerial orders and calls for aid promoting sustainable mobility [1]. This has led to the development of numerous sustainable urban mobility plans (SUMP) in many cities in Spain during the last 20 years, but has not been supported by a specific technical and regulatory framework. This tool has become quite popular in local planning, sometimes more in the effort to obtain subsidies and European funds for cohesion and development, rather than due to the existence of a true political commitment on the part of local administrations [2]. However, the non-existence of a specific regulatory framework on the matter has given rise to a wide technical heterogeneity, with different approaches both at the diagnostic field and at the level of proposing solutions.
One of the best-known proposals in this context in Spain has been the so-called “Madrid Central” plan approved by the Madrid city council in 2018 [3]. This plan restricted access to the urban center area to the most polluting vehicles, and after various political and social controversies is currently paralyzed due to a change of government in the municipal corporation. However, this is not an isolated case, since there are many urban mobility plans in Spain whose implementation has been defective or even non-existent [4][5][6]. This situation has occurred either due to the difficulty in generating the necessary consensus with the stakeholders to establish diagnoses and solutions to the current problems, or due to the lack of will of the municipal administrations when implementing the necessary actions [7].
In this context of policy implementation, the multi-criteria decision making (MCDM) methods approaches are currently a widely used tool in the field of multiparametric analysis for the diagnosis and resolution of complex planning problems. A huge amount of successful cases in their application may be found related to complex scenarios’ assessment [8] in fields such as logistics [9], environmental management [10], construction industry [11], carbon emissions [12] and even sports tourism [13] and medicine management [14]. Therefore, these tools, because of their characteristics, present a high degree of applicability to complex phenomena of urban planning, such as promoting sustainable mobility.
2. Analysis of SUMPs in Spain between 2006 and 2021
First, an analysis has been made of the level of presence from a statistical point of view of the different qualitative and quantitative indicators in the selected sample of 47 plans developed in 43 cities in Spain (four of them made second editions to update the previous plan) during the last 15 years. On the other hand, the level of interaction of the results of qualitative and quantitative statistical indicators has been evaluated, by means of a statistical correlation using a linear decision system by least squares (OLS). The results obtained can be seen in Figure 1 for indicators L1 (number of stakeholders), L2 (number of actions in SUMPs), L3 (number of months for implementation), L4 (amplitude of the participatory process of elaboration), L5 (existence of monitoring and verification indicators) and L6 (proven degree of fulfilment of the SUMP).
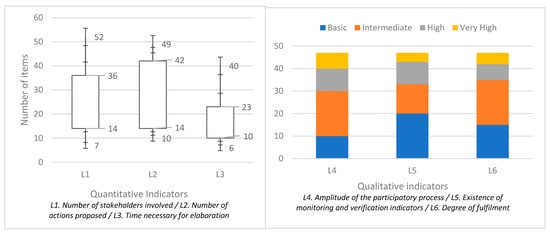
Figure 1. Results obtained for the quantitative and qualitative indicators analyzed in the 43 cities.
If researchers observe the results obtained, it can be seen that there is a clear statistical correlation between the scarce presence of stakeholders or the absence of a broad participatory process at the SUMP level with the comprehensive proposal of solutions to existing problems. There is also a clear relationship between the absence of follow-up and monitoring mechanisms for these instruments and the failure to achieve their objectives over time. According to what can be observed in the regression coefficients B, the qualitative indicators L4 (amplitude of the participatory process of the SUMP) and L6 (degree of SUMP fulfilment) present the highest level of correlation in general with the quantitative indicators L1 (number of stakeholders involved), L2 (number of actions proposed) and L3 (time necessary for elaboration). On the contrary, the L5 indicator (existence of monitoring and verification indicators) is the one with the weakest regression coefficients, with negative values in some cases (L3 case, close to zero, which rather denotes the absence of correlation). Among the quantitative indicators, the L1 indicator is the one with the most stable behavior, with the L3 being the one with the most heterogeneous values.
In relation to the evaluation of the performance of the model and the relative quality of the statistical model for the given set of data, obtained through the multiple R squared/adjusted R squared values and the Akaike information criterion, respectively, the statement in the previous paragraph is confirmed, with the most robust correlation model being the one that correlates the quantitative indicators with L4, the most robust, and L5, the weakest.
On the other hand, it is interesting to observe how the majority (62%) of the plans analyzed do not fairly contemplate structured methods of diagnosis and selection of alternatives in decision-making aid. Most of them use a rudimentary or qualitative approach type when this issue is addressed (34%). Only a very exceptional minority (4%) raises structured methods based on objective criteria (usually, type AHP or WSM). Finally, it is interesting to find out that, if applied, the implementation of these improvement mechanisms does not necessarily imply the generation of a longer processing time for the approval of the plan.
3. Application of the Hybrid Framework for the SUMP of the City of Cartagena
Based on the results obtained in the study of SUMPs in Spain, the previously explained methodology has been proposed to improve the implementation process of these planning instruments in cities. The methodological framework described has been applied to the case study of the city of Cartagena, a city that houses the usual characteristics of the statistical sample selected in the previous study.
As a consequence of the application of the proposed framework in its Phase 1, the following 18 × 22 decision matrix was obtained after the application of the sum weight method using weighting criteria obtained based on a review of scientific literature. The weighting criteria of the different coefficients have been established based on the following documents: general priorities established in the Transport White Paper “Towards a competitive and efficient transport system in the consumption of resources” [15] published in 2011 by the European Commission and the Sustainable Development Goals 2030 of the United Nations organization (Resolution A/RES/70/1 approved by the General Assembly on 25 September 2015 [16]), and specific technical criteria for strategic mobility planning, such as the practical guide for the preparation and implementation of SUMPs published in 2008 by the IDEA foundation [17] and the conclusions established at the Sustainable Urban Mobility Congress held in Bilbao in 2019 [18].
The weighting criteria of the different alternatives evaluated by the expert committee are described below:
-
Improvement of environmental quality (IEQ, 20%):
- ○Promotion of energy efficiency (EE, quotient × 0.3)
- ○Improvement of air quality (AQ, quotient × 0.3)
- ○Promotion of noise reduction (NR, quotient × 0.4)
-
Promotion of healthy habits (PHH, 20%):
- ○Safe and comfortable city for bicycle use (BS, quotient × 0.3)
- ○Rationalization of the use of the private car (CUR, quotient × 0.2)
- ○Safe and comfortable city for mobility on foot (PS, quotient × 0.3)
- ○Promotion of physical exercise (PE, quotient × 0.2)
-
Improving competitiveness (IC, 20%):
- ○Reduction of travel times (TTR, quotient × 0.2)
- ○Infrastructures for more efficient non-motorized mobility (NEVI, quotient × 0.3)
- ○Electric vehicle charging infrastructures (EVI, quotient × 0.2)
- ○Encouragement of bicycle travel (BUI, quotient × 0.3)
-
Improvement of public space (IPS, 20%):
- ○Elimination of architectural barriers (SB, quotient × 0.3)
- ○Decrease in the occupation of public space by motor vehicles (COR, quotient × 0.2)
- ○Promotion of comfortable, inclusive and safe mobility (ISM, quotient × 0.3)
- ○Creation of public space for coexistence (CS, quotient × 0.2)
-
Social justice (SJ, 20%):
- ○Goods accessible to all citizens (HG, quotient × 0.3)
- ○Reduction of territory fragmentation and barrier effect (EB, quotient × 0.3)
- ○Better quality of life for inhabitants and passers-by (LQ, quotient × 0.4)
Each cell contains the score given by the expert committee when assessing an alternative regarding a determined criterion, being the maximum score 9 and minimum 1. For this method, Alternative 3 “Building of an integrated and coherent bicycle lane network” is the one out of 26 which gets the highest score as it can be observed in the last row is consequently the first alternative.
As foreseen in the proposed framework, and aiming to check the robustness of previous Ranking 1, another ranking was obtained after the application of the SIMUS method. For the implementation of this second methodological approach, issues such as the precedence of the actions have been considered for evaluation of alternatives, in order to be able to assess the budgetary needs and technical feasibility of the actions in a combined way when establishing evaluation criteria to the different options. Values obtained with SIMUS algorithm and inputs criteria for scoring the alternatives evaluated can be observed in Table 1.
Table 1. SIMUS Efficient Result Matrix (ERM) and ranking of alternatives for Cartagena´s City SUMP.
| Promote Pedestrian Displacement |
Commuter Services | Bike Lanes | Electric MPV | Foster Bike Use | Car Parking | Taxi Fostering | Bus Lines Optimization |
Smart Paths | Green Paths | City Center and Suburbs Connections | Superblocks | Road Safety | Center Pedestrianization. |
Intercity Road Safety | Parking Management | Last Mile Logistics | Work Place Transport | IT Transport Manag. | School Paths | Intercity Public Transport | Collab. Public Transport | Traffic Management | 20/30 Zones | Intermodality | Cabo Palos Railway |
|
|---|---|---|---|---|---|---|---|---|---|---|---|---|---|---|---|---|---|---|---|---|---|---|---|---|---|---|
| EE | 0.06 | 0.06 | 0.06 | 0.06 | 0.06 | 0.06 | 0.06 | 0.06 | 0.06 | 0.06 | 0.06 | 0.06 | 0.06 | 0.06 | 0.06 | 0.06 | 0.06 | |||||||||
| AQ | 0.33 | 0.33 | 0.33 | |||||||||||||||||||||||
| NR | 0.33 | 0.33 | 0.33 | |||||||||||||||||||||||
| BS | 0.25 | 0.25 | 0.25 | 0.25 | ||||||||||||||||||||||
| PS | 0.50 | 0.50 | ||||||||||||||||||||||||
| CUR | 0.33 | 0.33 | 0.33 | |||||||||||||||||||||||
| PE | 0.33 | 0.33 | 0.33 | |||||||||||||||||||||||
| TTR | 0.50 | 0.50 | ||||||||||||||||||||||||
| NEVI | 0.25 | 0.25 | 0.25 | 0.25 | ||||||||||||||||||||||
| EVI | 0.07 | 0.07 | 0.07 | 0.07 | 0.07 | 0.07 | 0.07 | 0.07 | 0.07 | 0.07 | 0.07 | 0.07 | 0.07 | 0.07 | 0.07 | |||||||||||
| BUI | 1.00 | |||||||||||||||||||||||||
| SB | 0.33 | 0.33 | 0.33 | |||||||||||||||||||||||
| COR | 0.25 | 0.25 | 0.25 | 0.25 | ||||||||||||||||||||||
| ISM | 0.03 | 0.09 | 0.09 | 0.09 | 0.09 | 0.09 | 0.09 | 0.09 | 0.03 | 0.03 | 0.03 | 0.03 | 0.03 | 0.09 | 0.09 | |||||||||||
| CS | 0.25 | 0.25 | 0.25 | 0.25 | ||||||||||||||||||||||
| HG | 0.33 | 0.33 | 0.33 | |||||||||||||||||||||||
| EB | 0.33 | 0.33 | 0.33 | |||||||||||||||||||||||
| LQ | 0.33 | 0.33 | 0.33 | |||||||||||||||||||||||
| SOC | 0.06 | 0.06 | 0.06 | 0.06 | 0.06 | 0.06 | 0.06 | 0.06 | 0.06 | 0.06 | 0.06 | 0.06 | 0.06 | 0.06 | 0.06 | 0.06 | 0.06 | |||||||||
| PF | 3.67 | 0.16 | 4.67 | 0.22 | 0.22 | 0.06 | 0.00 | 0.06 | 1.22 | 1.22 | 0.00 | 0.22 | 0.22 | 3.67 | 0.22 | 0.00 | 0.00 | 0.16 | 0.16 | 1.00 | 0.16 | 0.16 | 0.16 | 0.22 | 0.22 | 0.00 |
| NPF | 12 | 3 | 13 | 3 | 3 | 1 | 0 | 1 | 5 | 5 | 0 | 3 | 3 | 12 | 3 | 0 | 0 | 3 | 3 | 4 | 3 | 3 | 3 | 3 | 3 | 0 |
| RESULT | 0.67 | 0.17 | 0.72 | 0.17 | 0.17 | 0.06 | 0.00 | 0.06 | 0.28 | 0.28 | 0.00 | 0.17 | 0.17 | 0.67 | 0.17 | 0.00 |
Table 1 shows the Efficient Result Matrix (ERM) where the 26 alternatives are in columns and the 18 criteria are in rows. The ERM matrix is Pareto Efficient since all scores or results of the different objectives are optimal, that is, they cannot be improved.
Consequently, the final scores for all alternatives are shown in the last row in solid black. According to these scores, Ranking 2 is given and is depicted in Table 2.
Table 2. Ranking 2 after Phase 2 of the methodology and the application of SIMUS method (only 10 most valued alternatives are shown).
| Ranking Position |
Alternative Number |
Alternative | Score |
|---|---|---|---|
| 1 | 3 | Building of an integrated and coherent bicycle lane network |
0.72 |
| 2 | 1 | Promotion of pedestrian movements | 0.67 |
| 3 | 14 | Pedestrianization of the Historic Center | 0.67 |
| 4 | 9 | Start-up of smart trails | 0.28 |
| 5 | 10 | Greenway Connection | 0.28 |
| 6 | 20 | Generation of safe school itineraries | 0.22 |
| 7 | 4 | Implementation of the use of VMP and electric vehicles | 0.17 |
| 8 | 5 | Recovery from bicycle use | 0.17 |
| 9 | 12 | Traffic calming through superblocks | 0.17 |
| 10 | 13 | Road safety improvements | 0.17 |
For a better comparison of Ranking 1 and Ranking 2, both are shown vis-a-vis in Table 3 to check differences. Horizontal arrows indicate exact correspondence between the two rankings. Obliquus arrows show the difference in positions between scores of the two rankings.
Table 3. Comparison of Ranking 1 and Ranking 2 to validate the proposed methodology.
| Alternatives | Ranking 1 Best Alternatives |
Ranking 2 Best Alternatives |
Scores WSM (Ranking 1) |
Scores SIMUS (Ranking 2) |
|---|---|---|---|---|
| Building a bicycle lane network | 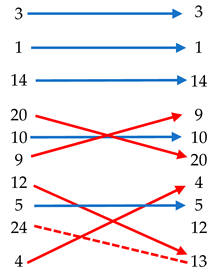 |
7.8 | 0.72 | |
| Promotion of pedestrian movements | 7.48 | 0.67 | ||
| Pedestrianization of the Historic Center | 7.48 | 0.67 | ||
| Generation of safe school itineraries | 7 | 0.28 | ||
| Greenway Connection | 6.92 | 0.28 | ||
| Start-up of smart trails | 6.80 | 0.22 | ||
| Traffic calming through superblocks | 6.12 | 0.17 | ||
| Recovery from bicycle use | 6.04 | 0.17 | ||
| Deploy zones 30 and 20 min | 5.84 | 0.17 | ||
| Implementation of the use of PMV and electric vehicles | 5.78 | 0.17 | ||
4. Conclusions
The development of Sustainable Urban Mobility Plans in numerous cities in Spain during the last 15 years without the existence of a specific regulatory framework has given rise to a varied catalogue of actions with various problems. In this study, 47 plans of this nature developed in different Spanish cities have been analyzed, observing how many of these planning instruments have had difficulties both in diagnosing problems and in implementing solutions. By means of a statistical analysis, it has been contrasted how there is a clear correlation between the implementation of these instruments with rudimentary participatory processes or the scarcity of indicators for subsequent monitoring with the failure of these strategies to improve urban mobility in cities.
Based on this diagnosis, a structured hybrid MCDM framework based on WSM and SIMUS methods has been proposed. The results obtained with the application of this methodology for the implementation of the SUMP of the city of Cartagena, show how the implementation of analytic mechanisms in the SUMPs of middle-sized cities such as Cartagena can facilitate the achievement of their objectives.
References
- Gonzalez, J.N.; Perez-Doval, J.; Gomez, J.; Vassallo, J.M. What impact do private vehicle restrictions in urban areas have on car ownership? Empirical evidence from the city of Madrid. Cities 2021, 116, 103301.
- Muñiz, I.; Sánchez, V. Urban Spatial form and Structure and Greenhouse-gas Emissions from Commuting in the Metropolitan Zone of Mexico Valley. Ecol. Econ. 2018, 147, 353–364.
- Romero, F.; Gomez, J.; Rangel, T.; Vassallo, J.M. Impact of restrictions to tackle high pollution episodes in Madrid: Modal share change in commuting corridors. Transp. Res. Part D Transp. Environ. 2019, 77, 77–91.
- Lopez-Carreiro, I.; Monzon, A. Evaluating sustainability and innovation of mobility patterns in Spanish cities. Analysis by size and urban typology. Sustain. Cities Soc. 2018, 38, 684–696.
- Santana-Santana, S.B.; Peña-Alonso, C.; Pérez-Chacón Espino, E. Assessing physical accessibility conditions to tourist attractions. The case of Maspalomas Costa Canaria urban area (Gran Canaria, Spain). Appl. Geogr. 2020, 125, 102327.
- Serrano-López, R.; Linares-Unamunzaga, A.; Muñoz San Emeterio, C. Urban sustainable mobility and planning policies. A Spanish mid-sized city case. Cities 2019, 95, 102356.
- Mozos-Blanco, M.Á.; Pozo-Menéndez, E.; Arce-Ruiz, R.; Baucells-Aletà, N. The way to sustainable mobility. A comparative analysis of sustainable mobility plans in Spain. Transp. Policy 2018, 72, 45–54.
- Munier, N.; Hontoria, E.; Jiménez-Saez, F. Strategic Approach in Multi-Criteria Decision Making—A Practical Guide for Complex Scenarios. In International Series in Operations Research & Management Science; Springer Nature Switzerland AG: Cham, Switzerland, 2019; Volume 275, pp. 3–13. ISBN 9783030027254.
- Wen, Z.; Liao, H.; Ren, R.; Bai, C.; Zavadskas, E.K.; Antucheviciene, J.; Al-Barakati, A. Cold chain logistics management of medicine with an integrated multi-criteria decision-making method. Int. J. Environ. Res. Public Health 2019, 16, 4843.
- García-Ayllón, S. New strategies to improve co-management in enclosed coastal seas and wetlands subjected to complex environments: Socio-economic analysis applied to an international recovery success case study after an environmental crisis. Sustainability 2019, 11, 1039.
- Heidary Dahooie, J.; Vanaki, A.S.; Firoozfar, H.R.; Zavadskas, E.K.; Čereška, A. An Extension of the Failure Mode and Effect Analysis with Hesitant Fuzzy Sets to Assess the Occupational Hazards in the Construction Industry. Int. J. Environ. Res. Public Health 2020, 17, 1442.
- Wang, C.; Yang, Q.; Dai, S. Supplier selection and order allocation under a carbon emission trading scheme: A case study from China. Int. J. Environ. Res. Public Health 2020, 17, 111.
- Yang, J.-J.; Chuang, Y.-C.; Lo, H.-W.; Lee, T.-I. A two-stage MCDM model for exploring the influential relationships of sustainable sports tourism criteria in Taichung City. Int. J. Environ. Res. Public Health 2020, 17, 2319.
- Huang, C.-Y.; Hsieh, H.-L.; Chen, H. Evaluating the investment projects of spinal medical device firms using the real option and DANP-mV based MCDM methods. Int. J. Environ. Res. Public Health 2020, 172, 3335.
- European Environment Agency Transport White Paper. Available online: https://www.eea.europa.eu/policy-documents/transport-white-paper-2011 (accessed on 25 November 2021).
- Macmillan, A.; Smith, M.; Witten, K.; Woodward, A.; Hosking, J.; Wild, K.; Field, A. Suburb-level changes for active transport to meet the SDGs: Causal theory and a New Zealand case study. Sci. Total Environ. 2020, 714, 136678.
- Instituto para la Diversificación y Ahorro de la Energía Guía Práctica para la Elaboración e Implantación de Planes de Movilidad Urbana Sostenible. Available online: https://www.idae.es/publicaciones/pmus-guia-practica-para-la-elaboracion-e-implantacion-de-planes-de-movilidad-urbana (accessed on 25 November 2021).
- Sustainable Urban Mobility Congress. Available online: https://sumbilbao19.com/documentos/ (accessed on 25 November 2021).
More
Information
Subjects:
Urban Studies
Contributor
MDPI registered users' name will be linked to their SciProfiles pages. To register with us, please refer to https://encyclopedia.pub/register
:
View Times:
1.2K
Entry Collection:
Environmental Sciences
Revisions:
3 times
(View History)
Update Date:
04 Jan 2022
Table of Contents


Notice
You are not a member of the advisory board for this topic. If you want to update advisory board member profile, please contact office@encyclopedia.pub.
OK
Confirm
Only members of the Encyclopedia advisory board for this topic are allowed to note entries. Would you like to become an advisory board member of the Encyclopedia?
Yes
No
${ textCharacter }/${ maxCharacter }
Submit
Cancel
Back
Comments
${ item }
|
${ item.createdUser.fullName }
${ item.createdAt }
${ item.vote }
${ item.reply }
Delete
${ reply.createdUser.fullName }
${ reply.createdAt }
${ reply.vote }
Delete
There is no reply to this comment~
${ item.replyTextCharacter }/${ item.replyMaxCharacter }
Submit
Cancel
More
No more~
There is no comment~
${ textCharacter }/${ maxCharacter }
Submit
Cancel
${ selectedItem.replyTextCharacter }/${ selectedItem.replyMaxCharacter }
Submit
Cancel
Confirm
Are you sure to Delete?
Yes
No