Your browser does not fully support modern features. Please upgrade for a smoother experience.
Submitted Successfully!
 +1 credit
Thank you for your contribution! You can also upload a video entry or images related to this topic.
For video creation, please contact our Academic Video Service.
| Version | Summary | Created by | Modification | Content Size | Created at | Operation |
|---|---|---|---|---|---|---|
| 1 | Artur Jorge Ferreira | -- | 1373 | 2024-04-09 12:00:12 | | | |
| 2 | Rita Xu | -207 word(s) | 1166 | 2024-04-10 03:19:12 | | |
Video Upload Options
We provide professional Academic Video Service to translate complex research into visually appealing presentations. Would you like to try it?
Cite
If you have any further questions, please contact Encyclopedia Editorial Office.
Dias, R.; Ferreira, A.; Pinto, I.; Geraldes, C.; Von Rekowski, C.; Bento, L. Statistical Analysis of Intensive Care Unit COVID-19 Data. Encyclopedia. Available online: https://encyclopedia.pub/entry/56573 (accessed on 21 July 2026).
Dias R, Ferreira A, Pinto I, Geraldes C, Von Rekowski C, Bento L. Statistical Analysis of Intensive Care Unit COVID-19 Data. Encyclopedia. Available at: https://encyclopedia.pub/entry/56573. Accessed July 21, 2026.
Dias, Rúben, Artur Ferreira, Iola Pinto, Carlos Geraldes, Cristiana Von Rekowski, Luís Bento. "Statistical Analysis of Intensive Care Unit COVID-19 Data" Encyclopedia, https://encyclopedia.pub/entry/56573 (accessed July 21, 2026).
Dias, R., Ferreira, A., Pinto, I., Geraldes, C., Von Rekowski, C., & Bento, L. (2024, April 09). Statistical Analysis of Intensive Care Unit COVID-19 Data. In Encyclopedia. https://encyclopedia.pub/entry/56573
Dias, Rúben, et al. "Statistical Analysis of Intensive Care Unit COVID-19 Data." Encyclopedia. Web. 09 April, 2024.
Copy Citation
COVID-19 caused a pandemic, due to its ease of transmission and high number of infections. The evolution of the pandemic and its consequences for the mortality and morbidity of populations, especially the elderly, generated several scientific studies and many research projects. Among them, researchers have the Predictive Models of COVID-19 Outcomes for Higher Risk Patients Towards a Precision Medicine (PREMO) research project. For such a project with many data records, it is necessary to provide a smooth graphical analysis to extract value from it.
COVID-19
dashboard
data visualization
intensive care unit
1. Introduction
COVID-19 is caused by the SARS-CoV-2 coronavirus identified for the first time in humans in the city of Wuhan, China, in November 2019. This led to a pandemic, due to its high number of cases and ease of transmission. This disease causes respiratory infections, flulike symptoms, and may evolve to more serious conditions, such as pneumonia causing death.
The evolution of this pandemic and its consequences were reflected in the mortality and morbidity of populations, leading to the development of several scientific studies and research projects all over the world [1][2][3][4][5][6][7][8][9][10][11]. For instance, the study carried out by Florensa et al. [1] was carried out in Lleida, Spain, and compared the Alpha variant, first detected in the United Kingdom, and the Delta variant, first detected in India. It concluded that the Alpha variant was more aggressive, with a wider range of symptoms when compared to the Delta variant, mostly due to the lack of vaccination, as the existing one was aimed at the Delta variant [1]. The work of Amin et al. [2] compared the first five waves of COVID-19 in Tehran, Iran. It showed that the aggressiveness of the virus, and consequently the probability of death, worsened from the first to the third wave, in which the most serious cases were identified. In the fourth and fifth waves, the gravity of the pandemic gradually decreased.
2. Preliminary Work on the PREMO Project—The Starting Point
The work arises within the scope of the PREMO project, following the study carried out by Rekowski [12] aimed to identify predictive biomarkers for severe outcomes in the context of COVID-19, namely, death, in critically ill patients admitted to the ICU. To this end, clinical, demographic, and laboratory data collected along the patients’ stay in the ICU were analyzed. It is important to distinguish two different types of data: longitudinal data (LD) and cross-sectional data (CD). In CD, there is one set of measurements with multiple observations on the relevant variables, taken at approximately the same point in time. In LD, records for the same entities are obtained over multiple moments in time, making it possible to obtain information about the trajectory of variables over time, as described by Molenberghs and Verbeke [13].
To infer the evolution of the patients’ clinical condition in the first week of ICU hospitalization, a comparative analysis was carried out between data from the second and seventh day. The statistical distribution for the laboratory parameters of interest were compared between the group of deceased patients and the group of patients who were discharged. Survival analysis studies were also carried out, through the estimation of Kaplan–Meier survival curves [14][15]. To compare survival curves for patients characterized by distinct risk patterns, according to biomarker cutoffs, for example, the cut-off point that separates the normal and non-normal reference values of a biomarker, the log-rank (Mantel–Cox) [16][17], Breslow (generalized Wilcoxon) [18][19], and Tarone–Ware tests were carried out [20]. The analysis of associations between biomarkers and death was tested using univariate models suitable for LD, acquired throughout the stay of patients in the ICU. It was concluded that the patients who died were considerably older, had a larger number of comorbidities, required more often the use of IMV support, and spent less time in the hospital, as compared to patients who were discharged. This analysis was carried out with standard software tools, and there was no programming involved.
As a first programming approach to support the study by Rekowski [12], the work of Ribeiro [21] used data from the first three waves of COVID-19, from one hospital in Lisbon, Portugal with the following objectives:
-
To devise a relational database with the LD of the patients admitted to the ICU, using scripts written in Python. The database was set up dynamically allowing rapid adaptation depending on the number of biomarkers that may arise.
-
To perform the necessary data transformations before being stored in the database, without providing any dashboard nor visualization capabilities.
The data were initially stored in Excel files, with one file per patient, with each row representing a biomarker measurement within the collection from the patient. The contents of these Excel files were transposed to the database, after some data preprocessing steps. All files were scanned, extracting the data, excluding columns with meaningless or erroneous values. The devised relational database had the following tables:
-
COLLECTION—identifies the patient, a collection date, and the service that requested the collection.
-
PARAMETER—stores different variables (parameters), such as the name of the laboratory, the parameter name, and reference values, among others.
-
RESULT—the patient’s analysis results for each parameter.
The corresponding entity relationship (ER) model is depicted in Figure 1. Regarding the COLLECTION attributes, the ID-PACIENTE attribute is a sequential number that identifies a patient but hides their identity, under the General Data Protection Regulation (GDPR) guidelines. Only the authorized hospital personnel can access the mapping between this database’s ID-PACIENTE and the real patient identification.
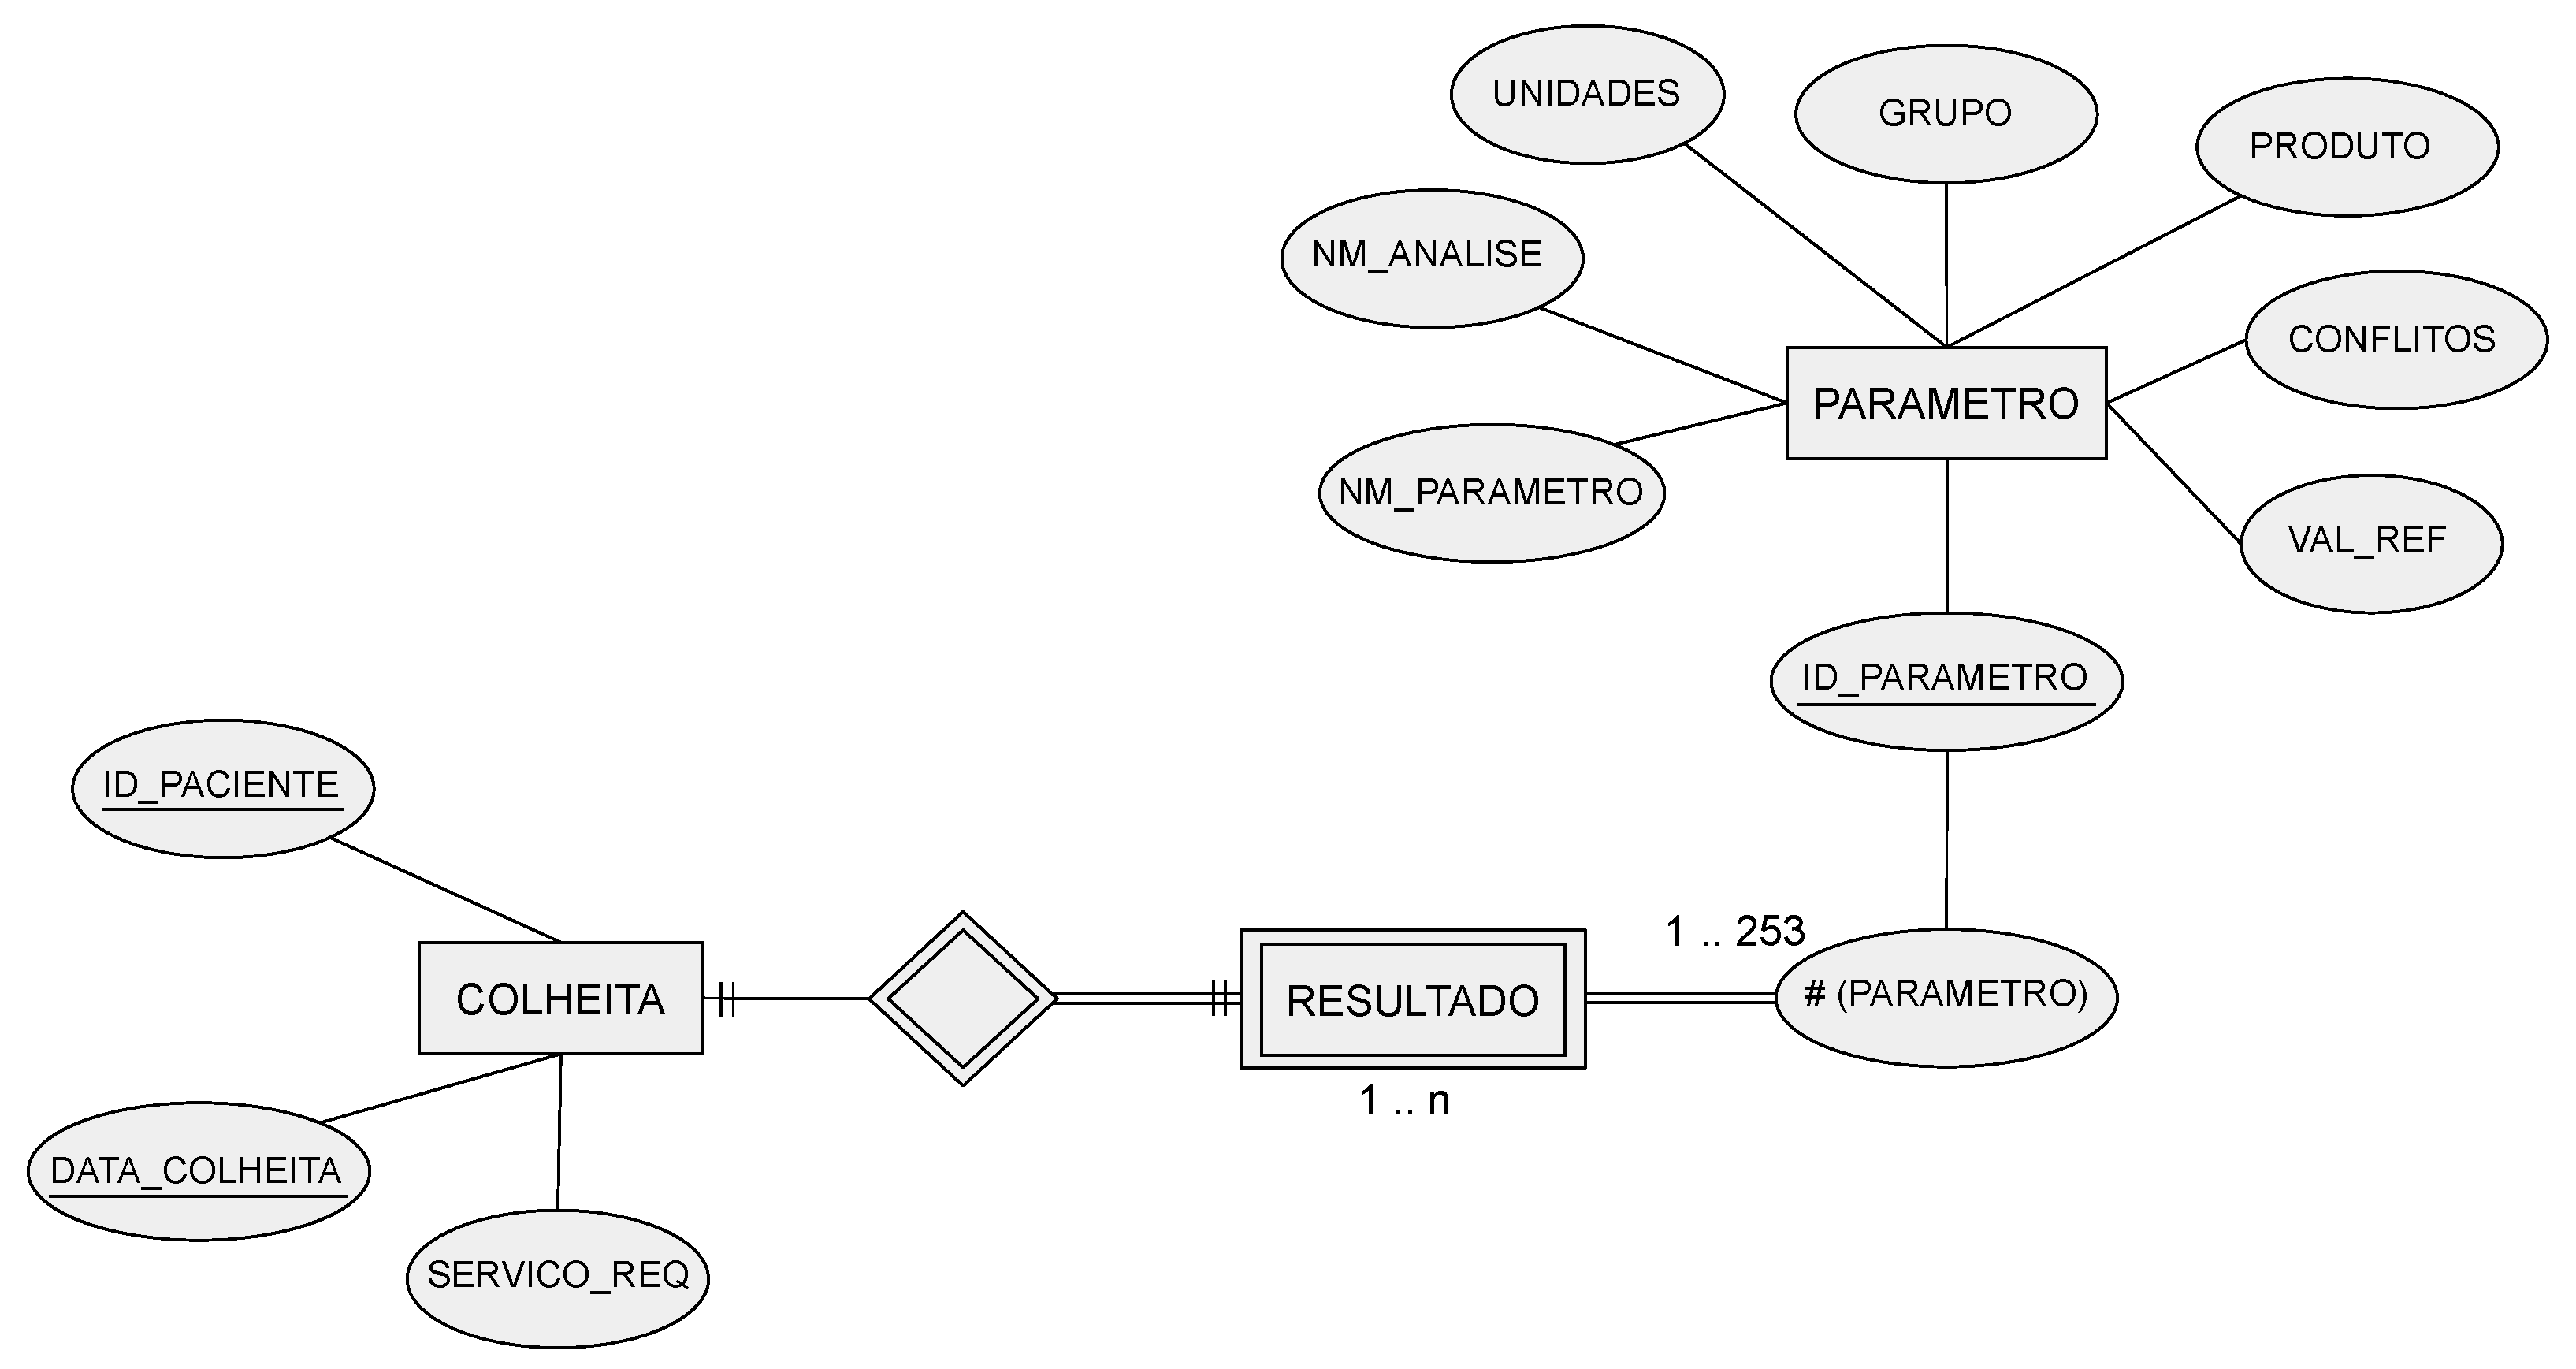
Figure 1. The original entity relationship (ER) model developed in the preliminary work on the technical report of Ribeiro, with entities named in Portuguese (COLHEITA translates to COLLECTION, PARAMETRO translates to PARAMETER, and RESULTADO translates to RESULT).
3. Dashboards for COVID-19 and Clinical Data
A dashboard refers to the representation of useful information to the user. As stated by Wexler et al. [22] “A dashboard is a visual display of data used to monitor and/or facilitate understanding”. A dashboard is typically composed of graphs, diagrams, and numbers providing adequate data visualization and interpretation. The proper use of a dashboard on the data allows the extraction of information and knowledge about the disease and the pandemic, according to the data, information, knowledge, and wisdom (DIKW) model [23][24][25].
Some COVID-19-related projects also address the development of dashboards. Some of them report the largest number of infections, number of recoveries, number of vaccinations, number of deaths, among other indicators, to monitor the spread of the SARS-CoV-2 virus and its variants. An example of this type of dashboard is the one developed by the Johns Hopkins University Center for Systems Science and Engineering [26]. Another example is the COVID-19 Watcher dashboard to monitor the disease spread in the United States [27]. The dashboard developed by Ibrahim et al. [28], depicted in Figure 2, concerns the management of infected and noninfected patients. The dashboard identifies the hospitalized patients’ location and their status through a color scheme. It allows users to monitor patients in multiple wards and intervene when clinically necessary or to relocate patients, yielding better resource management.
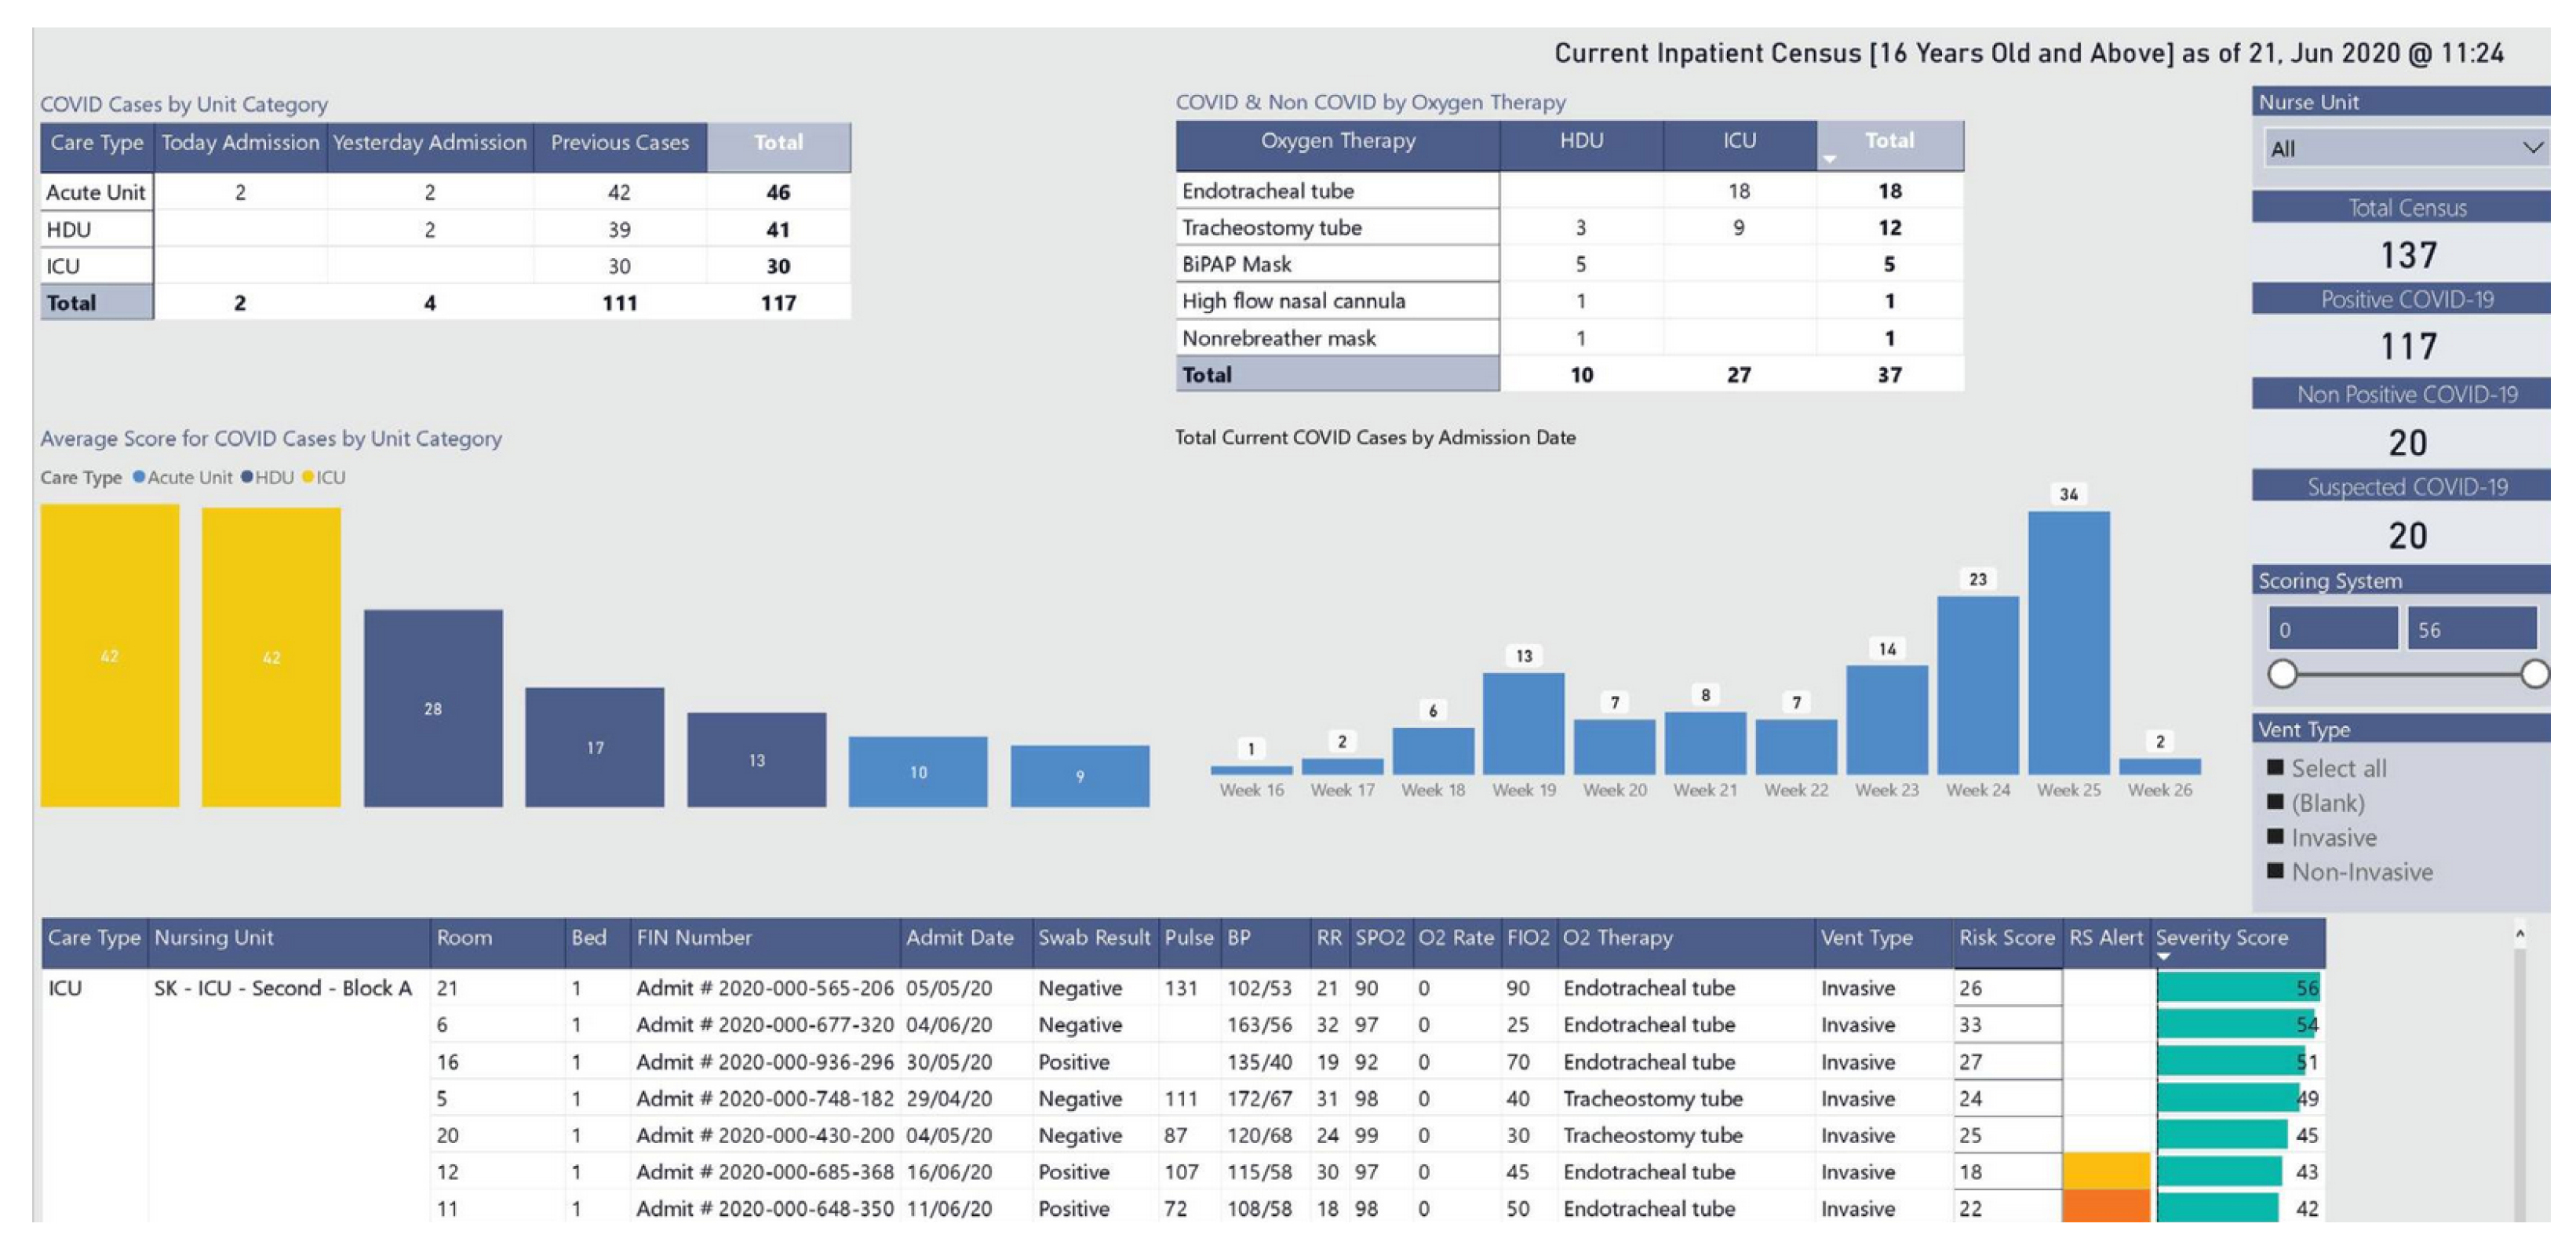
Figure 2. Dashboard visualization for resource and patient management.
References
- Florensa, D.; Mateo, J.; Spaimoc, R.; Miret, C.; Godoy, S.; Solsona, F.; Godoy, P. Severity of COVID-19 cases in the months of predominance of the Alpha and Delta variants. Sci. Rep. 2022, 12, 15456.
- Amin, R.; Sohrabi, M.R.; Hannani, K. Five consecutive epidemiological waves of COVID-19: A population-based cross-sectional study on characteristics, policies, and health outcome. BMC Infect. Dis. 2023, 22, 906.
- Abati, E.; Stellio, L.; Manini, A.; Moroni, F.; Azzalini, L.; Vilca, L. A cross-sectional survey study of the impact of COVID-19 pandemic on the training and quality of life of Italian medical residents in the Lombardy region. Ann. Med. 2022, 54, 2326–2339.
- Collis, A.; Garimella, K.; Moehring, A.; Rahimian, M.A.; Babalola, S.; Gobat, N.H.; Shattuck, D.; Stolow, J.; Aral, S.; Eckles, D. Global survey on COVID-19 beliefs, behaviors and norms. Nat. Hum. Behav. 2022, 6, 1310–1317.
- Novais, F.; Cordeiro, C.; Câmara Pestana, P.; Côrte-Real, B.; Reynolds Sousa, T.; Delerue Matos, A.; Telles-Correia, D. The Impact of COVID-19 in Older People in Portugal: Results from the Survey of Health, Ageing and Retirement (SHARE). Acta Médica Port. 2021, 34, 761–766.
- Hart, W.; Miller, E.; Andrews, N.; Waight, P.; Maini, P.; Funk, S.; Thompson, R. Generation time of the alpha and delta SARS-CoV-2 variants: An epidemiological analysis. Lancet—Infect. Dis. 2022, 22, 603–610.
- Bahl, A.; Mielke, N.; Johnson, S.; Desai, A.; Qu, L. Severe COVID-19 outcomes in pediatrics: An observational cohort analysis comparing Alpha, Delta, and Omicron variants. Lancet Reg. Health—Am. 2023, 18, 100405.
- Uemura, K.; Kanata, T.; Ono, S.; Michihata, N.; Yasunaga, H. The disease severity of COVID-19 caused by Omicron variants: A brief review. Ann. Clin. Epidemiol. 2023, 5, 31–36.
- Petrone, D.; Mateo-Urdiales, A.; Sacco, C.; Riccardo, F.; Bella, A.; Ambrosio, L.; Presti, A.L.; Martino, A.D.; Ceccarelli, E.; Manso, M.D.; et al. Reduction of the risk of severe COVID-19 due to Omicron compared to Delta variant in Italy (November 2021–February 2022). Int. J. Infect. Dis. 2023, 129, 135–141.
- Mondal, M.; Bharati, S.; Podder, P.; Kamruzzaman, J. Deep Learning and Federated Learning for Screening COVID-19: A Review. BioMedInformatics 2023, 3, 691–713.
- Rocchi, E.; Peluso, S.; Sisti, D.; Carletti, M. A New Epidemic Model for the COVID-19 Pandemic: The θ-SI(R)D Model. BioMedInformatics 2022, 2, 398–404.
- Rekowski, C. Development of Predictive Models for COVID-19 Prognosis Based on Patients’ Demographic and Clinical Data. Master’s Thesis, Instituto Superior de Engenharia de Lisboa, Lisboa, Portugal, 2022.
- Molenberghs, V.; Verbeke, V. Linear Mixed Models for Longitudinal Data, 3rd ed.; Springer: New York, NY, USA, 2009.
- Kaplan, E.; Meier, P. Nonparametric estimation from incomplete observations. J. Am. Stat. Assoc. 1958, 53, 457–481.
- Collett, D. Modelling Survival Data in Medical Research, 3rd ed.; Chapman and Hall/CRC: Boca Raton, FL, USA, 2014.
- Mantel, N. Evaluation of survival data and two new rank order statistics arising in its consideration. Cancer Chemother. Rep. 1966, 50, 163–170.
- Cox, D. Regression Models and Life-tables (with discussion). J. R. Stat. Soc. 1972, 34, 187–220.
- Gehan, E. A Generalized Wilcoxon Test for Comparing Arbitrarily Singly-Censored Samples. Biometrika 1965, 52, 203–223.
- Breslow, N. A generalized Kruskal-Wallis test for comparing K samples subject to unequal patterns of censorship. Biometrika 1970, 57, 579–594.
- Daniel, W.; Cross, C. Biostatistics: A Foundation for Analysis in the Health Sciences, 10th ed.; John Wiley & Sons: Hoboken, NJ, USA, 2013.
- Ribeiro, D. Project Report—PREMO. Technical Report, Instituto Superior de Engenharia de Lisboa. 2022. Available online: www.isel.pt (accessed on 21 October 2023).
- Wexler, S.; Shaffer, J.; Cotgreave, A. The Big Book of Dashboards: Visualizing Your Data Using Real-World Business Scenarios; John Wiley & Sons: Hoboken, NJ, USA, 2017.
- Intezari, A.; Pauleen, D.J.; Taskin, N. The DIKW hierarchy and management decision-making. In Proceedings of the Hawaii International Conference on System Sciences (HICSS), Koloa, HI, USA, 5–8 January 2016; pp. 4193–4201.
- Rowley, J. The wisdom hierarchy: Representations of the DIKW hierarchy. J. Inf. Commun. Sci. 2007, 33, 163–180.
- Zins, C. Conceptual approaches for defining data, information, and knowledge. J. Am. Soc. Inf. Sci. Technol. 2007, 58, 479–493.
- Dong, E.; Ratcliff, J.; Goyea, T.D.; Katz, A.; Lau, R.; Ng, T.K.; Garcia, B.; Bolt, E.; Prata, S.; Zhang, D.; et al. The Johns Hopkins University Center for Systems Science and Engineering COVID-19 Dashboard: Data collection process, challenges faced, and lessons learned. Lancet Infect. Dis. 2022, 22, e370–e376.
- Wissel, B.D.; Van Camp, P.; Kouril, M.; Weis, C.; Glauser, T.A.; White, P.S.; Kohane, I.S.; Dexheimer, J.W. An interactive online dashboard for tracking COVID-19 in US counties, cities, and states in real time. J. Am. Med. Inform. Assoc. 2020, 27, 1121–1125.
- Ibrahim, H.; Sorrell, S.; Nair, S.C.; Al Romaithi, A.; Al Mazrouei, S.; Kamour, A. Rapid development and utilization of a clinical intelligence dashboard for frontline clinicians to optimize critical resources during COVID-19. Acta Inform. Medica 2020, 28, 209.
More
Information
Contributors
MDPI registered users' name will be linked to their SciProfiles pages. To register with us, please refer to https://encyclopedia.pub/register
:
View Times:
2.4K
Entry Collection:
COVID-19
Revisions:
2 times
(View History)
Update Date:
10 Apr 2024
Table of Contents


Notice
You are not a member of the advisory board for this topic. If you want to update advisory board member profile, please contact office@encyclopedia.pub.
OK
Confirm
Only members of the Encyclopedia advisory board for this topic are allowed to note entries. Would you like to become an advisory board member of the Encyclopedia?
Yes
No
${ textCharacter }/${ maxCharacter }
Submit
Cancel
Back
Comments
${ item }
|
${ item.createdUser.fullName }
${ item.createdAt }
${ item.vote }
${ item.reply }
Delete
${ reply.createdUser.fullName }
${ reply.createdAt }
${ reply.vote }
Delete
There is no reply to this comment~
${ item.replyTextCharacter }/${ item.replyMaxCharacter }
Submit
Cancel
More
No more~
There is no comment~
${ textCharacter }/${ maxCharacter }
Submit
Cancel
${ selectedItem.replyTextCharacter }/${ selectedItem.replyMaxCharacter }
Submit
Cancel
Confirm
Are you sure to Delete?
Yes
No