 +1 credit
| Version | Summary | Created by | Modification | Content Size | Created at | Operation |
|---|---|---|---|---|---|---|
| 1 | Masayuki Takahashi | -- | 2087 | 2023-11-22 12:57:58 | | | |
| 2 | Jason Zhu | Meta information modification | 2087 | 2023-11-23 04:00:45 | | |
Video Upload Options
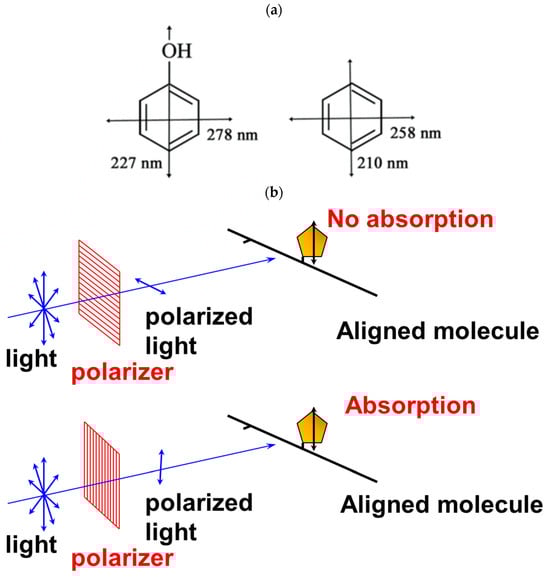
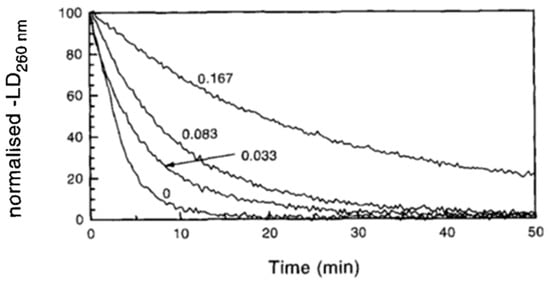
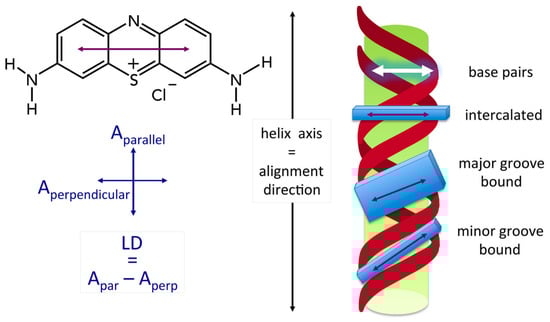
Linear dichroism (LD) is a differential polarized light absorption spectroscopy used for studying filamentous molecules such as DNA and protein filaments. Here shows the applications of LD for the analysis of DNA-protein interactions. LD signals can be measured in a solution by aligning the sample using flow-induced shear force or a strong electric field. The signal generated is related to the local orientation of chromophores, such as DNA bases, relative to the filament axis. LD can thus assess the tilt and roll of DNA bases and distinguish intercalating from groove-binding ligands. The intensity of the LD signal depends upon the degree of macroscopic orientation. Therefore, DNA shortening and bending can be detected by a decrease in LD signal intensity.
1. Introduction
2. Principles and Measurements
2.1. Principle of Linear Dichroism
2.2. Utility and Advantages of LD Measurements
Detection of Changes in Shape and Flexibility of DNA
2.3. Binding Mode (Intercalation or Groove Binding)
2.4. Advantages of LD Measurements
2.5. Difficulties in the Analysis of LD Signals
3. Measurements
4. Methods of Sample Alignment
4.1. Couette Cells
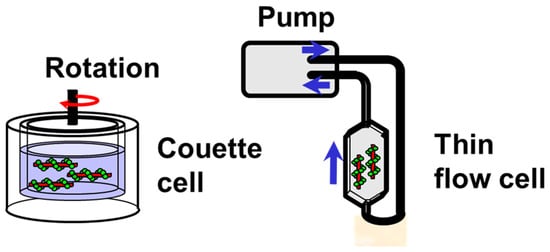
4.2. Flow Cells
4.3. Application of Electric or Magnetic Field
4.4. Deformation of Sample-Loaded Film or Gel
References
- Norden, B.; Kubista, M.; Kurucsev, T. Linear dichroism spectroscopy of nucleic acids. Q. Rev. Biophys. 1992, 25, 51–170.
- Rodgers, A. How to study DNA and proteins by linear dichroism spectroscopy. Sci. Prog. 2008, 91, 377–396.
- Bloemendal, M.; van Grondelle, R. Linear-dichroism spectroscopy for the study of structural properties of proteins. Mol. Biol. Rep. 1993, 18, 49–69.
- Norden, B.; Elvingson, C.; Kubista, M.; Sjöberg, B.; Ryberg, H.; Ryberg, M.; Mortensen, K.; Takahashi, M. Structure of RecA-DNA complexes studied by combination of linear dichroism and small angle neutron scattering measurements on flow-oriented samples. J. Mol. Biol. 1992, 226, 1175–1191.
- Tuite, E.; Sehlstedt, U.; Hagmar, P.; Norden, B.; Takahashi, M. Effects of minor and major groove binding drugs and intercalators on the DNA association of minor-groove binding proteins RecA and DNaseI detected by flow linear dichroism. Eur. J. Biochem. 1997, 243, 482–492.
- Hicks, M.; Rodger, A.; Thomas, C.; Batt, S.; Dafforn, T. Restriction enzyme kinetics monitored by U.V. linear dichroism. Biochemistry 2006, 45, 8912–8917.
- Porschke, D.; Hillen, W.; Takahashi, M. The change of DNA structure by specific binding of the cAMP receptor protein from rotation diffusion and dichroism measurement. EMBO J. 1984, 3, 2873–2878.
- Takahashi, M.; Bertrand, E.; Fuchs, R.P.P.; Norden, B. Structure of UvrABC excinuclease-DNA complexes studied by flow linear dichroism: DNA curved by UvrB and UvrC. FEBS Lett. 1992, 314, 10–12.
- Takahashi, M.; Kubista, M.; Nordén, B. Linear dichroism study of RecA-DNA complexes: Structural evidence and stoichiometries. J. Biol. Chem. 1987, 262, 8109–8111.
- Maeshima, K.; Maraboeuf, F.; Morimatsu, K.; Horii, T.; Takahashi, M. Nucleotide dependent structural and kinetic changes in Xenopus Rad51.1-DNA complex stimulating the strand exchange reaction: Destacking of DNA bases and restriction of their local motion. J. Mol. Biol. 1998, 284, 689–697.
- Hagmar, P.; Dahlman, K.; Takahashi, M.; Carlstedt-Duke, J.; Gustafsson, J.A.; Norden, B. Unspecific DNA binding of the DNA binding domain of the glucocorticoid receptor studied with flow linear dichroism. FEBS Lett. 1989, 253, 28–32.
- Nordén, B.; Kurucsev, T. Analysing DNA complexes by circular and linear dichroism. J. Mol. Recognit. 1994, 7, 141–155.
- Colson, P.; Bailly, C.; Houssier, C. Electric linear dichroism as a new tool to study sequence preference in drug binding to DNA. Biophys. Chem. 1996, 58, 125–140.
- Lincoln, P.; Nordén, B. DNA Binding Geometries of Ruthenium(II) Complexes with 1,10-Phenanthroline and 2,2′-Bipyridine Ligands Studied with Linear Dichroism Spectroscopy. J. Phys. Chem. B 1998, 102, 9583–9594.
- Tuite, E.M.; Nordén, B. Linear and circular dichroism characterization of thionine binding mode with DNA polynucleotides. Spectrochim. Acta Part A Mol. Biomol. Spectrosc. 2018, 189, 86–92.
- Matsuoka, Y.; Nordén, B. Linear dichroism studies of nucleic acids. II. Calculation of reduced dichroism curves of A-and B-form DNA. Biopolymers 1982, 21, 2433–2452.
- Fornander, L.H.; Renodon-Corniere, A.; Kuwabara, N.; Ito, K.; Tsutsui, Y.; Shimizu, T.; Iwasaki, H.; Norden, B.; Takahashi, M. Swi5-Sfr1 protein stimulates Rad51-mediated DNA strand exchange reaction through organization of DNA bases in the presynaptic filament. Nucleic Acids Res. 2014, 42, 2358–2365.
- Fornander, L.H.; Frykholm, K.; Reymer, A.; Renodon-Cornière, A.; Takahashi, M.; Nordén, B. Ca2+ improves organization of single-stranded DNA bases in human Rad51 filament, explaining stimulatory effect on gene recombination. Nucleic Acids Res. 2011, 40, 4904–4913.
- Marrington, R.; Dafforn, T.R.; Halsall, D.J.; Rodger, A. Micro-volume Couette flow sample orientation for absorbance and fluorescence linear dichroism. Biophys. J. 2004, 87, 2002–2012.
- Morimatsu, K.; Takahashi, M. Structural analysis of RecA protein-DNA complexes by fluorescence-detected linear dichroism: Absence of structural change of filament for pairing of complementary DNA strands. Anal. Biochem. 2006, 358, 192–198.
- Wemyss, A.M.; Chmel, N.P.; Lobo, D.P.; Sutherland, J.A.; Dafforn, T.R.; Rodger, A. Fluorescence detected linear dichroism spectroscopy: A selective and sensitive probe for fluorophores in flow-oriented systems. Chirality 2018, 30, 227–237.
- Phelps, C.; Lee, W.; Jose, D.; Marcus, A.H. Single-molecule FRET and linear dichroism studies of DNA breathing and helicase binding at replication fork junctions. Proc. Natl. Acad. Sci. USA 2013, 110, 17320–17325.
- Adachi, R.; Yamaguchi, K.; Yagi, H.; Sakurai, K.; Naiki, H.; Goto, Y. Flow-induced alignment of amyloid protofilaments revealed by Linear Dichroism. J. Biol. Chem. 2007, 282, 8978–8983.
- Diekmann, S.; Hillen, W.; Morgeneyer, B.; Wells, R.D.; Pörschke, D. Orientation relaxation of DNA restriction fragments and the internal mobility of the double helix. Biophys. Chem. 1982, 15, 263–270.
- Diekmann, S.; Pörschke, D. Electro-optical analysis of ‘curved’ DNA fragments. Biophys Chem. 1987, 26, 207–216.
- Porschke, D. Electric dichroism and bending amplitudes of DNA fragments according to a simple orientation function for weakly bent rods. Biopolymers 1989, 28, 1383–1396.
- Jonsson, M.; Jacobsson, U.; Takahashi, M.; Norden, B. Orientation of large DNA during free solution electrophoresis studied by linear dichroism. J. Chem. Soc. Faraday Trans. 1993, 89, 2791–2798.
- Choi, E.; Lee, S.-H.; Kang, K.-T. DNA Alignment-Induced Linear Dichroism via Magnetic Field Assisted Electrospray: Implications for Optical Applications. ACS Appl. Nano Mater. 2023, 6, 7150–7155.
- Matsuoka, Y.; Nordén, B. Linear Dichroism Studies of Nucleic Acid Bases In Stretched Poly(Vlnyl Alcohol) Molecular Orientation and Electronic Transition Moment Directions. J. Phys. Chem. 1982, 86, 1378–1386.
- Razmkhah, K.; Chmel, N.; Gibson, M.; Rodger, A. Oxidized polyethylene films for orienting polar molecules for linear dichroism spectroscopy. Analyst 2014, 139, 1372–1382.
- Van Amerongen, H.; Vasmel, H.; Van Grondelle, R. Linear dichroism of chlorosomes from Chloroflexus aurantiacus in compressed gels and electric fields. Biophys. J. 1998, 54, 65–76.

