Linear Dichroism Measurements for Protein-DNA Interactions: History
Please note this is an old version of this entry, which may differ significantly from the current revision.

Linear dichroism (LD) is a differential polarized light absorption spectroscopy used for studying filamentous molecules such as DNA and protein filaments. Here shows the applications of LD for the analysis of DNA-protein interactions. LD signals can be measured in a solution by aligning the sample using flow-induced shear force or a strong electric field. The signal generated is related to the local orientation of chromophores, such as DNA bases, relative to the filament axis. LD can thus assess the tilt and roll of DNA bases and distinguish intercalating from groove-binding ligands. The intensity of the LD signal depends upon the degree of macroscopic orientation. Therefore, DNA shortening and bending can be detected by a decrease in LD signal intensity. 

  • linear dichroism (LD)
  • DNA/protein complex
  • RecA
  • Rad51
  • homologous recombination
  • cyclic AMP receptor protein (CRP)

1. Introduction

Linear dichroism (LD), a polarized light spectroscopy method, is useful for studying filamentous molecules, such as DNA and protein filaments. These molecules can be easily macroscopically oriented by shear flow or electric fields [1][2][3]. Since long filamentous molecules are generally difficult to study by X-ray crystallography or NMR [2], LD can provide important complementary information about their structures in solution, including information about reaction mechanisms through time-resolved measurements. LD has long been considered a rather exotic technique, which may explain why it is not used more frequently. However, it has advantages over techniques. For instance, it can be readily performed in solution under variable conditions using current commercially available devices.

2. Principles and Measurements

2.1. Principle of Linear Dichroism
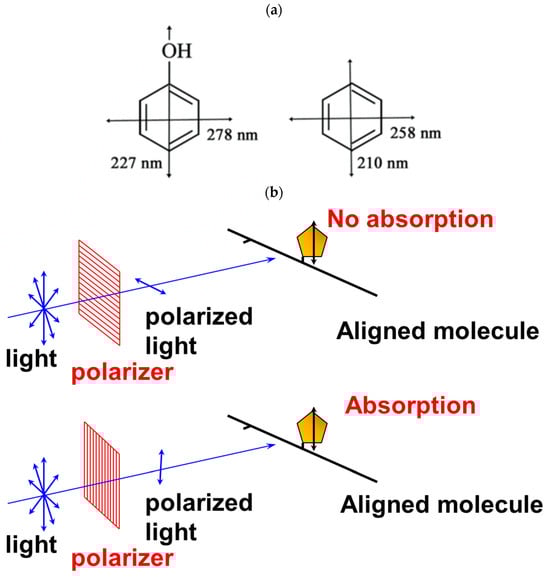
LD measures the differential absorption of orthogonal forms of linearly polarized light [1][2][3]. Chromophores absorb UV/visible light, polarized in specific directions, according to their electric dipole transition moments (Figure 1a). Therefore, when all molecules are perfectly aligned, the absorption of polarized light will be at its maximum when the electric field is parallel to the transition moment. The difference between the absorption of light polarized parallel and perpendicular to a macroscopic (laboratory) axis is denoted as LD = Absparallel − Absperpendicular [1][2][3]. In addition to chromophore orientation, the LD signal intensity linearly depends on the optical pathway, sample concentration, and the absorption coefficient of the chromophore. Therefore, the ‘reduced’ LD (LDr = LD/isotropic absorbance) is independent of these parameters and only depends on the macroscopic molecular orientation, thus reflecting the transition moment orientation. In addition to the local orientation of the transition moment, LDr scales with the macroscopic alignment of sample molecules, which is denoted by the orientation factor S (0 ≤ S ≤ 1):
LDr = S × 3/2 × (3 × <cos2Θ> − 1)
Figure 1. Transition dipole moments in a chromophore (a) and principle of linear dichroism (b).
S is 1 for perfect alignment and 0 for random orientation. Equation (1) contains two unknown parameters, S and Θ, which require extra information. The orientation factor, S, may, for example, be determined from small-angle X-ray scattering (SAXS) or small-angle neutron scattering (SANS) measurements under identical alignment conditions [4].
Since each chromophore generally absorbs light at different wavelengths, and due to transition moments at different angles within a specific plane for an aromatic chromophore (Figure 1a) [1][2], chromophore orientation can be assessed from the LD signal measured at corresponding wavelengths and related to the respective orientations of transition moments. The spectral shape of LD is generally independent of the orientation factor, although the LD amplitude is scaled by it, and is obviously 0 for random orientation [1][2]. Therefore, in favorable cases, chromophore orientation can be determined without the need to independently determine the orientation factor.
The orientation factor itself provides information about the size, shape, and stiffness of molecules because the signal intensity depends on the alignment degree of the sample molecules according to Equation (1). Stiff, long, and straight molecules produce a maximum signal (large S), while short, flexible, or bent molecules produce a weak signal (small S).

2.2. Utility and Advantages of LD Measurements

Detection of Changes in Shape and Flexibility of DNA
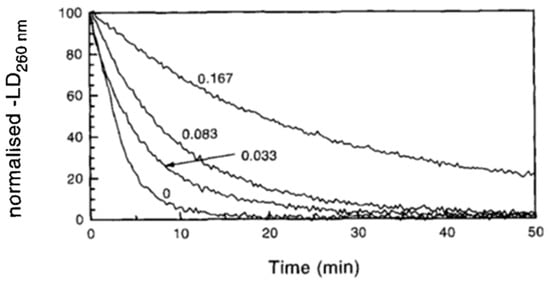
Long DNA align better than short DNA fragments and produce a strong LD signal. Therefore, DNA digestion by endonucleases can be measured in situ by observing a decrease in LD signal intensity (Figure 2) [5][6]. In this way, LD allows for continuous real-time observation of DNA digestion.
Figure 2. Linear dichroism observation of DNA digestion by endonuclease I in the presence of various concentrations of ethidium bromide [5].
The degree of alignment of DNA fragments (S) also depends on their straightness and stiffness. Straight DNA aligns better than curved DNA. Thus, it is possible to detect the bending of DNA caused by proteins [7][8]. Protein binding to DNA usually stiffens the DNA, which facilitates the alignment of DNA and increases LD signal intensity. The stiffening of DNA by RecA and Rad51 recombinases and the glucocorticoid receptor protein has been observed using LD [9][10][11]. The increase in LD signal intensity has been used to study the DNA binding of RecA and Rad51 [5][9].

2.3. Binding Mode (Intercalation or Groove Binding)
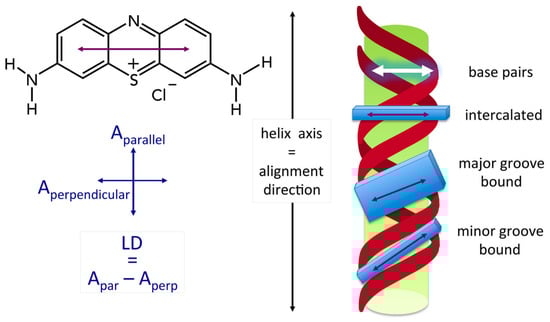
LD can determine the binding mode of ligands to DNA, which is essential for understanding various mechanisms, including those related to medicinal drug action. In the case of intercalation, the orientations of the ligand and the DNA bases are expected to be the same, with both having molecular (aromatic) planes approximately perpendicular to the DNA helix axis in B conformation DNA (Figure 3). In the case of groove binding, the ligand plane is not perpendicular to the DNA helix axis but is generally parallel to the groove direction (45° to the helix axis for the minor groove) [1][2][12][13][14]. When researchers insert Θ = 90° into Equation (1), corresponding to intercalation, it gives a strong negative LD value, similar to that observed for transition moments in the likewise perpendicular nucleobases. However, with Θ = 45°, a positive LD occurs with a weaker magnitude. It is important to note that <cos2Θ> means that researchers are dealing with an ensemble average over a potentially broad distribution over different angles, so caution must be exercised when interpreting the data. Due to some dynamics for DNA in solution, Θ, as determined from Equation (1), is thus often less than 90°, but the same ‘effective’ angle is generally found for an intercalation molecule, as if it is moving in synchrony with the bases. In Equation (1), LD vanishes for Θ = 54.7°, and this structure cannot be distinguished from a case of isotropic orientation, where LD vanishes due to S = 0. For this reason, it is often advisable to get information about S from an independent source, such as SANS [4].
Figure 3. Schematic presentation of the geometry of groove binding and intercalation ligands. From [15].
By exploiting the fact that there are transition moments with different directions in nucleic acid base pairs, LD can be used to determine the tilt and roll angles of DNA bases, thus distinguishing A-form from B-form DNA [1][2][16]. LD measurements have demonstrated that the binding of RecA and Rad51 recombinases promotes a perpendicular orientation of the DNA bases of single-stranded DNA (ssDNA) [4][9][17][18]. In the absence of protein, the DNA bases of free ssDNA move relatively freely and do not exhibit any preferential orientation (extremely small LD). This structural change, a reflection of how the protein steers the orientation of the nucleic bases, is probably essential for the strand exchange activity of these proteins.

2.4. Advantages of LD Measurements

One of the advantages of LD is that it can be used to perform structural measurements in solution under various solvent conditions. Thus, the structural modifications of molecules caused by effectors and changes in solvent conditions (salts, pH, temperature, etc.) can be examined by LD. In contrast to another type of polarized spectroscopy, circular dichroism (CD), which provides information in terms of relative chromophore-chromophore orientation, LD provides information about the orientation of individual chromophores. The analysis is also more straightforward, although the two methods are complementary [1][2].
Since small molecules do not become flow-oriented and therefore do not produce any LD signal, the LD signal of the complex can be selectively measured, even in the presence of excess non-bound ligands or proteins. Furthermore, LD is a sensitive method that can be performed in relatively dilute solutions, allowing for good signals to be obtained in the µM (in bases) range of DNA concentration. The sample can be aligned in a commercialized mini-Couette cell with a volume of less than 100 µL [19].

2.5. Difficulties in the Analysis of LD Signals

One of the main difficulties in analyzing LD signals of DNA-protein complexes lies in the presence of several chromophores simultaneously absorbing light in the same wavelength region. The absorption bands of DNA bases and the aromatic residues (Tyr and Trp) of proteins overlap. Furthermore, because identical chromophores (Trp and Tyr residues) can occupy different positions within a protein, it is challenging to get information about one specific chromophore within a complex. One approach is to replace a target chromophore with a structurally similar chromophore that absorbs light differetly. Changes in LD spectra after such chromophore replacements can provide valuable information about the target chromophore. Another approach is to detect the LD signal through fluorescence, since fluorescence measurements tend to be more selective.
Another difficulty and associated ambiguity, as mentioned above, is that the orientation factor must be determined for angular analysis. The orientation factor can be estimated by performing SAXS (or SANS) scattering and LD measurements on the same sample [4]. However, this method consumes a large amount of materials. Furthermore, the orientation factor may change upon complex formation. For instance, the orientation factor of a complex with one protein differs from that of a complex with two proteins. One must verify the binding stoichiometry using independent measurements [9].

3. Measurements

The LD signal (absorption difference) can be measured with high sensitivity using a CD spectrometer adapted to work in LD mode. Recent CD spectrometers can perform measurements in LD detection mode. LD signals can also be detected by measuring fluorescence instead of absorption [2][19][20][21][22], which allows for the selective analysis of fluorescent chromophores in the sample. It can even be used for single-molecule observations [22].

4. Methods of Sample Alignment

4.1. Couette Cells
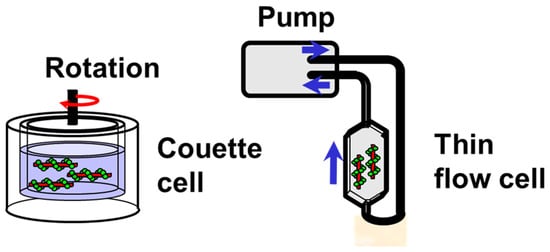
A Couette cell is comprised of two co-axial cylinders with a small gap (Figure 4). The sample solution is introduced into this gap. Rotating one of the cylinders creates a shear force that aligns the elongated sample molecules. The LD signal can be continuously observed, allowing measurements throughout the entire spectrum (signal variation with wavelengths), including real-time kinetic analysis. However, this method can only align relatively long DNA (>2000 bp long). The shear force can be changed by changing the rotation speed to observe the effects of different shear forces, which provides further information about the stiffness and straightness of the molecules. Many of the LD analyses presented below were performed using Couette cells.
Figure 4. Couette cell and flow-through cell for LD measurements.

4.2. Flow Cells

The shear force can also be created by passing the sample solution through a thin flow cell (Figure 4). However, the shear force generated in this way is usually weaker than that produced by a Couette cell. It varies over the cross-section of the thin flow cell, whereas it is constant in a Couette flow cell. The solution is circulated using a pulsation-free peristaltic pomp. The volume of sample solution required for this system is larger than that required for a mini-Couette cell. In contrast, this cell type is free of optical defects caused by the strain birefringence of thick cylindrical silica windows and generally provides a better baseline extending into the far UV. The cell is also better adapted for fluorescence measurements. Another advantage is that the flow direction can be changed by rotating the cell, which facilitates signal analyses [23].

4.3. Application of Electric or Magnetic Field

A high electric field can align even short DNA fragments (43 base pairs long) [24][25]. However, a high electric field can only be applied briefly (as a pulse). The sample molecules are aligned for a short time and then disoriented. Although the entire LD spectrum cannot be measured using this method, the time required for the loss of orientation after pulse termination can be measured, which provides information about the shape of the DNA (length and straightness). This method can detect DNA bending promoted by protein-binding or DNA-bending sequences [7][24][25][26]. However, it is limited because it can only be performed under very low salt conditions.
Applying a weaker electric field promotes the electrophoretic movement of DNA in electrophoretic gels, which can be used to align long DNA molecules due to the mechanical interaction between the DNA and the gel fibers [27]. Alignment of single-stranded DNA has been reported using a very strong magnetic field [28].

4.4. Deformation of Sample-Loaded Film or Gel

One method to align small molecules is to deposit the sample on a film or a polyacrylamide gel and stretch the film or deform the gel. This technique can align small molecules that cannot be aligned using other methods [29][30][31].

This entry is adapted from the peer-reviewed paper 10.3390/ijms242216092

References

  1. Norden, B.; Kubista, M.; Kurucsev, T. Linear dichroism spectroscopy of nucleic acids. Q. Rev. Biophys. 1992, 25, 51–170.
  2. Rodgers, A. How to study DNA and proteins by linear dichroism spectroscopy. Sci. Prog. 2008, 91, 377–396.
  3. Bloemendal, M.; van Grondelle, R. Linear-dichroism spectroscopy for the study of structural properties of proteins. Mol. Biol. Rep. 1993, 18, 49–69.
  4. Norden, B.; Elvingson, C.; Kubista, M.; Sjöberg, B.; Ryberg, H.; Ryberg, M.; Mortensen, K.; Takahashi, M. Structure of RecA-DNA complexes studied by combination of linear dichroism and small angle neutron scattering measurements on flow-oriented samples. J. Mol. Biol. 1992, 226, 1175–1191.
  5. Tuite, E.; Sehlstedt, U.; Hagmar, P.; Norden, B.; Takahashi, M. Effects of minor and major groove binding drugs and intercalators on the DNA association of minor-groove binding proteins RecA and DNaseI detected by flow linear dichroism. Eur. J. Biochem. 1997, 243, 482–492.
  6. Hicks, M.; Rodger, A.; Thomas, C.; Batt, S.; Dafforn, T. Restriction enzyme kinetics monitored by U.V. linear dichroism. Biochemistry 2006, 45, 8912–8917.
  7. Porschke, D.; Hillen, W.; Takahashi, M. The change of DNA structure by specific binding of the cAMP receptor protein from rotation diffusion and dichroism measurement. EMBO J. 1984, 3, 2873–2878.
  8. Takahashi, M.; Bertrand, E.; Fuchs, R.P.P.; Norden, B. Structure of UvrABC excinuclease-DNA complexes studied by flow linear dichroism: DNA curved by UvrB and UvrC. FEBS Lett. 1992, 314, 10–12.
  9. Takahashi, M.; Kubista, M.; Nordén, B. Linear dichroism study of RecA-DNA complexes: Structural evidence and stoichiometries. J. Biol. Chem. 1987, 262, 8109–8111.
  10. Maeshima, K.; Maraboeuf, F.; Morimatsu, K.; Horii, T.; Takahashi, M. Nucleotide dependent structural and kinetic changes in Xenopus Rad51.1-DNA complex stimulating the strand exchange reaction: Destacking of DNA bases and restriction of their local motion. J. Mol. Biol. 1998, 284, 689–697.
  11. Hagmar, P.; Dahlman, K.; Takahashi, M.; Carlstedt-Duke, J.; Gustafsson, J.A.; Norden, B. Unspecific DNA binding of the DNA binding domain of the glucocorticoid receptor studied with flow linear dichroism. FEBS Lett. 1989, 253, 28–32.
  12. Nordén, B.; Kurucsev, T. Analysing DNA complexes by circular and linear dichroism. J. Mol. Recognit. 1994, 7, 141–155.
  13. Colson, P.; Bailly, C.; Houssier, C. Electric linear dichroism as a new tool to study sequence preference in drug binding to DNA. Biophys. Chem. 1996, 58, 125–140.
  14. Lincoln, P.; Nordén, B. DNA Binding Geometries of Ruthenium(II) Complexes with 1,10-Phenanthroline and 2,2′-Bipyridine Ligands Studied with Linear Dichroism Spectroscopy. J. Phys. Chem. B 1998, 102, 9583–9594.
  15. Tuite, E.M.; Nordén, B. Linear and circular dichroism characterization of thionine binding mode with DNA polynucleotides. Spectrochim. Acta Part A Mol. Biomol. Spectrosc. 2018, 189, 86–92.
  16. Matsuoka, Y.; Nordén, B. Linear dichroism studies of nucleic acids. II. Calculation of reduced dichroism curves of A-and B-form DNA. Biopolymers 1982, 21, 2433–2452.
  17. Fornander, L.H.; Renodon-Corniere, A.; Kuwabara, N.; Ito, K.; Tsutsui, Y.; Shimizu, T.; Iwasaki, H.; Norden, B.; Takahashi, M. Swi5-Sfr1 protein stimulates Rad51-mediated DNA strand exchange reaction through organization of DNA bases in the presynaptic filament. Nucleic Acids Res. 2014, 42, 2358–2365.
  18. Fornander, L.H.; Frykholm, K.; Reymer, A.; Renodon-Cornière, A.; Takahashi, M.; Nordén, B. Ca2+ improves organization of single-stranded DNA bases in human Rad51 filament, explaining stimulatory effect on gene recombination. Nucleic Acids Res. 2011, 40, 4904–4913.
  19. Marrington, R.; Dafforn, T.R.; Halsall, D.J.; Rodger, A. Micro-volume Couette flow sample orientation for absorbance and fluorescence linear dichroism. Biophys. J. 2004, 87, 2002–2012.
  20. Morimatsu, K.; Takahashi, M. Structural analysis of RecA protein-DNA complexes by fluorescence-detected linear dichroism: Absence of structural change of filament for pairing of complementary DNA strands. Anal. Biochem. 2006, 358, 192–198.
  21. Wemyss, A.M.; Chmel, N.P.; Lobo, D.P.; Sutherland, J.A.; Dafforn, T.R.; Rodger, A. Fluorescence detected linear dichroism spectroscopy: A selective and sensitive probe for fluorophores in flow-oriented systems. Chirality 2018, 30, 227–237.
  22. Phelps, C.; Lee, W.; Jose, D.; Marcus, A.H. Single-molecule FRET and linear dichroism studies of DNA breathing and helicase binding at replication fork junctions. Proc. Natl. Acad. Sci. USA 2013, 110, 17320–17325.
  23. Adachi, R.; Yamaguchi, K.; Yagi, H.; Sakurai, K.; Naiki, H.; Goto, Y. Flow-induced alignment of amyloid protofilaments revealed by Linear Dichroism. J. Biol. Chem. 2007, 282, 8978–8983.
  24. Diekmann, S.; Hillen, W.; Morgeneyer, B.; Wells, R.D.; Pörschke, D. Orientation relaxation of DNA restriction fragments and the internal mobility of the double helix. Biophys. Chem. 1982, 15, 263–270.
  25. Diekmann, S.; Pörschke, D. Electro-optical analysis of ‘curved’ DNA fragments. Biophys Chem. 1987, 26, 207–216.
  26. Porschke, D. Electric dichroism and bending amplitudes of DNA fragments according to a simple orientation function for weakly bent rods. Biopolymers 1989, 28, 1383–1396.
  27. Jonsson, M.; Jacobsson, U.; Takahashi, M.; Norden, B. Orientation of large DNA during free solution electrophoresis studied by linear dichroism. J. Chem. Soc. Faraday Trans. 1993, 89, 2791–2798.
  28. Choi, E.; Lee, S.-H.; Kang, K.-T. DNA Alignment-Induced Linear Dichroism via Magnetic Field Assisted Electrospray: Implications for Optical Applications. ACS Appl. Nano Mater. 2023, 6, 7150–7155.
  29. Matsuoka, Y.; Nordén, B. Linear Dichroism Studies of Nucleic Acid Bases In Stretched Poly(Vlnyl Alcohol) Molecular Orientation and Electronic Transition Moment Directions. J. Phys. Chem. 1982, 86, 1378–1386.
  30. Razmkhah, K.; Chmel, N.; Gibson, M.; Rodger, A. Oxidized polyethylene films for orienting polar molecules for linear dichroism spectroscopy. Analyst 2014, 139, 1372–1382.
  31. Van Amerongen, H.; Vasmel, H.; Van Grondelle, R. Linear dichroism of chlorosomes from Chloroflexus aurantiacus in compressed gels and electric fields. Biophys. J. 1998, 54, 65–76.
More
This entry is offline, you can click here to edit this entry!
ScholarVision Creations