Your browser does not fully support modern features. Please upgrade for a smoother experience.
Submitted Successfully!
 +1 credit
Thank you for your contribution! You can also upload a video entry or images related to this topic.
For video creation, please contact our Academic Video Service.
| Version | Summary | Created by | Modification | Content Size | Created at | Operation |
|---|---|---|---|---|---|---|
| 1 | John Hulme | -- | 2965 | 2023-09-14 14:41:26 | | | |
| 2 | Peter Tang | Meta information modification | 2965 | 2023-09-15 02:40:33 | | |
Video Upload Options
We provide professional Academic Video Service to translate complex research into visually appealing presentations. Would you like to try it?
Cite
If you have any further questions, please contact Encyclopedia Editorial Office.
Wu, S.; Hulme, J.P. Detection of Antibiotic and Multi-Drug Resistant Salmonella. Encyclopedia. Available online: https://encyclopedia.pub/entry/49181 (accessed on 27 May 2026).
Wu S, Hulme JP. Detection of Antibiotic and Multi-Drug Resistant Salmonella. Encyclopedia. Available at: https://encyclopedia.pub/entry/49181. Accessed May 27, 2026.
Wu, Siying, John P. Hulme. "Detection of Antibiotic and Multi-Drug Resistant Salmonella" Encyclopedia, https://encyclopedia.pub/entry/49181 (accessed May 27, 2026).
Wu, S., & Hulme, J.P. (2023, September 14). Detection of Antibiotic and Multi-Drug Resistant Salmonella. In Encyclopedia. https://encyclopedia.pub/entry/49181
Wu, Siying and John P. Hulme. "Detection of Antibiotic and Multi-Drug Resistant Salmonella." Encyclopedia. Web. 14 September, 2023.
Copy Citation
Antibiotic and multi-drug resistant (MDR) Salmonella poses a significant threat to public health due to its ability to colonize animals (cold and warm-blooded) and contaminate freshwater supplies. Monitoring antibiotic resistant Salmonella is traditionally costly, involving the application of phenotypic and genotypic tests over several days.
multi-drug resistant
Salmonella
detection
phenotypic
genotypic
1. Introduction
Salmonella is a Gram-negative bacterium accounting for 41% of diarrhea-associated deaths globally [1][2] The highly diverse pathogen is divided into two species: Salmonella bongori and Salmonella enterica. More than 2600 serotypes have been catalogued, with 1500 of those belonging to six subspecies of S. enterica (Subsp. enterica), namely enterica (I), salamae (II), arizonae (IIIa), diarizonae (IIIb), houtenae (IV), and indica (VI) [1]. Each serotype is identifiable via a unique variable region of the lipopolysaccharide (LPS) O-antigen and the flagellin structural proteins. Causative serotypes vary from continent to continent, with typhoidal Salmonellae (serotypes Typhi and Paratyphi A) common in South East Asia and non-typhoidal Salmonella (NTS) serovars common in Africa [3]. The infectious doses for typhoid and non-typhoid salmonellosis are 1000 colony forming units (CFU) and 1 CFU, respectively. NTS serovars generally induce mild gastroenteritis; exceptions include S. Dublin and S. Chloleraesius, which can result in bacteremia [4][5][6]. The severity of Salmonella disease (salmonellosis) depends on several factors, such as serotype (typhoid, non-typhoidal), gut colonization resistance, and the host’s immunosusceptibility to intracellular infection. Currently, there are four toxins produced from S. enterica, namely, SpvB, ArtAB, SboC/SeoC, and typhoid, all exhibiting ADP-ribosyltransferase activity resulting in actin depolymerization in the host [7][8][9][10].
According to recent reports by the Center for Disease Control and Prevention (CDC), the largest recorded Salmonella outbreak occurred in the USA in 2019, with 1134 reported cases, 219 hospitalizations resulting in the death of two people [11]. Serotypes Typhimurium, Newport, Heidelberg, and Hadar are currently listed by the CDC as “most threatening to public health” due to their frequent adulteration of beef and poultry food products and their association with multi-drug resistance [12][13]. The accepted definition of MDR is co-resistance to three or more classes of antimicrobial drugs [12]. Multiple molecular assays based on the detection of conserved genes invA and ttrC have been developed for the overall detection of the Salmonella genus [2]. Whereas genotypic identification of antibiotic resistance strains primarily focuses on the detection of integrons.
The most common integron found in isolates associated with multi drug resistant (MDR) is type I. Although antibiotic stewardships [14] have significantly curbed the number of Salmonella isolates exhibiting resistance to broad-spectrum antibiotics (Figure 1), isolates from US chicken and turkey foods frequently harbor plasmids for extended-spectrum β-lactamases (ESBLs).
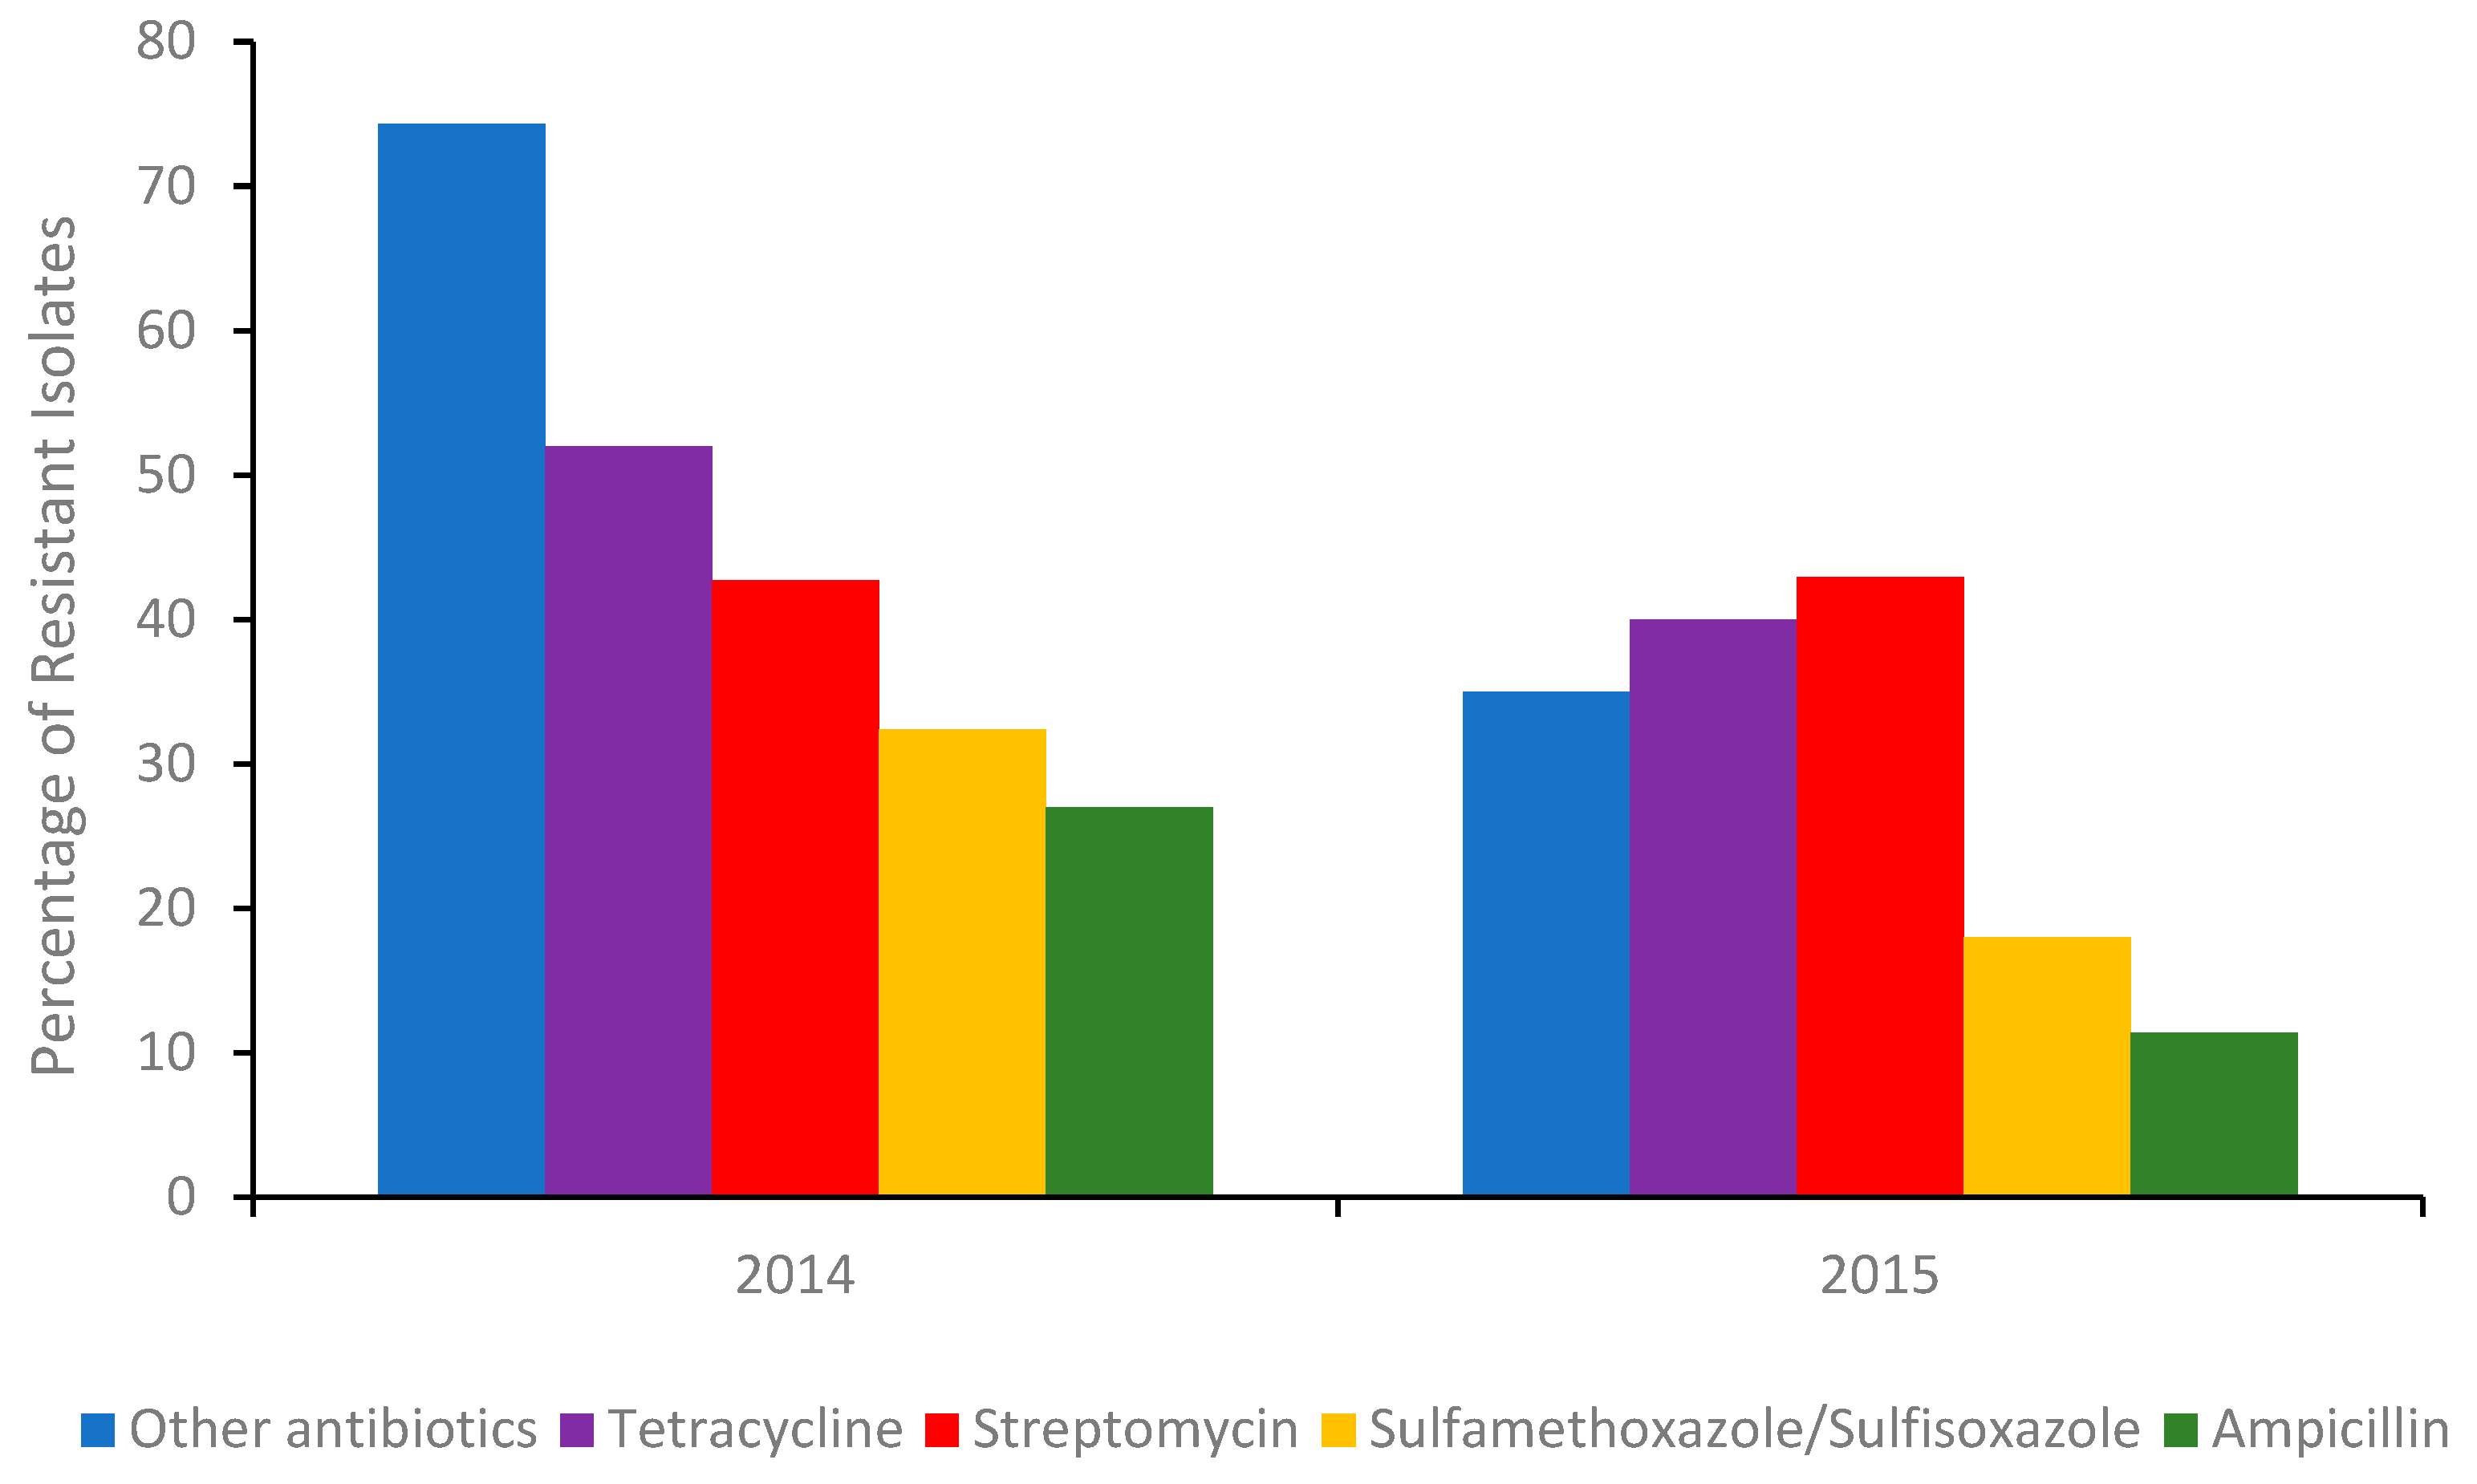
Figure 1. Percentage of the total number of Salmonella isolates in 2014 (Δ number of isolates 262) and the first half of 2015 (Δ number of isolates 114) detected in poultry, cattle, and swine meats containing a gene/genes conferring resistance to an antibiotic or other antibiotics. Sourced with permission (15). The percentage of isolates resistant to other antibiotics, were calculated from the sum of isolates conferring resistance to gentamicin, amoxicillin-clavulanic acid, cefoxitin, ceftiofur, ceftriaxone, azithromycin, chloramphenicol, ciprofloxacin, nalidixic acid, and trimethoprim-sulfamethoxazole respectively.
Many of these plasmids also encode for blaCTX-M and blaSHV-5 gene derivatives, conferring resistance to 3rd generation or last line cephalosporins.
The success of antibiotic stewardship programs in reducing the prevalence of MDR genes in foods is clearly evident (Figure 1). However, recent reports from India suggest [15] that antibiotic alternatives (dietary probiotic supplements) known to reduce MDR S. Typhimurium colonization in pigs can harbor resistance to many antibiotics, including ceftazidime, when misused. Moreover, a recent outbreak of Salmonellosis in China involving MDR S. Typhimurium [16] further highlighted the need for training and rigorous monitoring of these programs. Gene analysis of the serovar showed it contained several resistant genes, including blaOXA-1, blaTEM-1, and β-lactamase. In addition, an MDR S. Typhimurium co-harboring mcr-1, fosA3, blaCTX-M-14, was recently detected in the feces of a food production worker in China [17]. Thus, in order to better evaluate the roles of humans and animals in antibiotic resistance dissemination, the application of in-field rapid sero specific assays are urgently needed [18]. Recently, advances in nucleic acid automated amplification technologies, whole genome sequencing (WGS), phenotypic testing, and smartphone technologies have resulted in quicker identification times [19][20][21].
2. Conventional Isolation, Enrichment and Detection Methods
The cultivation of potential antibiotic resistant Salmonella colonies from human fecal and food samples involves five stages: pre-enrichment incubation, enrichment, plating, screening, and confirmation [4]. Pre-enrichment incubation (24 h) employs non-selective (35 °C) media such as peptone water and lactose broth to expedite the recovery of sub-level injured Salmonella. Although for resistant Salmonella and cells that have entered the viable but non-culturable (VBNC) state, an antibiotic or selenite broth may be preferred. The pre-enriched media is then inoculated into selective media containing inhibitory bile salts such as thiosulphate malachite green, thiosulphate, sulphamethazine or novobiocin promoting the growth of Salmonella over other bacteria [22][23]. Alternatively, official (Bacteriological Analytical manual (BAM)) inhibitory media such as Rappaport–Vassiliadis (RV) or tetrathionate broth can be employed. After sufficient enrichment (104 cells mL−1), cells from the chosen media are plated onto selective agars. Commonly used agars include xylose-lysine-deoxycholate agar (XLD), brilliant green agar (BGA), Salmonella–Shigella agar (SS), bismuth-sulfite agar (BSA) and Hektoen enteric (HE). Colonies from different serotypes present in various colors black (S. Typhi) or pink (S. Arizonae), depending on the agar medium. Occasionally, serotypes (S. Montevideo) are not distinctive and are even missed (Lac+ Salmonella enterica Virchow, S. enterica Newport or S. enterica Typhi) and cannot be reliably identified at this stage of the process. After plating, suspected Salmonella colonies undergo incubation in/on a group specific media such as a triple sugar iron (TSI) or lysine iron agar (LIA) slant [22] followed by a confirmatory test for urease negative cultures. Cultures giving typical Salmonella reactions are then selected for further biochemical and serological testing. However, the same serotype can vary with antigenicity. In such cases a polyvalent Salmonella O antisera or a polyvalent Salmonella bacteriophage O1-OE serological confirmatory test maybe also be employed [6][22][23]. It should be noted that antimicrobial resistant Salmonella spp. can be recovered by incorporating antibiotics in pre-enrichment and selective media [24].
3. Automated Whole Genome Sequencing
Whole genome sequencing (WGS) is a powerful, inexpensive open access epidemiological tool that can predict the genotypic and phenotypic resistance of a suspected bacterium in just a few days. Multi-locus sequence typing (MLST), multiple-locus variable number of tandem repeats analysis (MLVA), single-nucleotide polymorphism (SNP) analysis, [25], CRISPR-multi-locus virulence sequence typing (CRISPR-MVLST) [26] and next-generation sequencing (NGS) are some of the techniques [27] used in the sequencing of NTS antibiotic-resistant gene clusters.
Upon acquisition, sequences are then compared to reference sets sourced from databases such as (ResFinder [Center for Genomic Epidemiology, DTU]), BLAST (blastn) and ARG-ANNOT, followed by a phenotypic test to validate the predicted accuracy. Typically, an isolate will be genotypically resistant if a suspected antimicrobial resistant (AMR) gene is 75% identical to a reference sequence. Mismatches naturally arise, resulting in errors; Broadly, there are two mismatch categories, very major errors (VME) and major errors (ME). VME’s occur when a microbial sequence is predicted to be genotypically susceptible yet is phenotypically resistant. Conversely, major errors arise when a microbe identified as genetically resistant expresses phenotypic susceptibility [28].
ME discrepancies seem to be associated with the breakpoints used for phenotypic testing. In some cases, the minimum inhibitory concentrations (MIC) are just below the recommended breakpoints suggesting technical variations in the agar dilution method may result in isolates being falsely classified as susceptible. Moreover, some plasmids encoding for antimicrobial resistance genes can be damaged during storage and sub-culturing, further affecting the ME rate. In the VME category, mismatches are generally attributed to the presence of resistance determinants absent in the reference database or novel resistance mechanisms whose genetic determinants have yet to be determined.
These mismatches seem to be a relevant issue [29], especially when predicting streptomycin resistance. Despite these issues, ME and VME rates from numerous antibiotic resistant Salmonella WGS studies remain below the acceptable FDA cut-offs of 3 and 1.5%. In an extensive WGS study [30] involving 640 NTS Salmonellae, the susceptibility of 43 different serotypes to 14 antimicrobials was tested. Using the phenotypic results as the reference outcome, the authors calculated sensitivities by dividing the number of isolates that were genotypically resistant by the total number of isolates exhibiting clinical resistance phenotypes. Specificity was calculated by dividing the number of isolates that were genotypically susceptible by the total number of isolates with susceptible phenotypes. A total of 65 unique resistance genes plus mutations in two structural resistance loci were identified. Minimal sensitivity and specificity values of 86.4 (sulfisoxazole) and 90.8% (streptomycin) were reported.
In another WGS study, AMR Salmonella enterica serovars (Typhimurium, Newport, and Dublin) from 90 isolates sourced from humans and cattle were compared. Isolates were screened for phenotypic resistance to 12 antibiotics. Genotypic prediction of phenotypic resistance resulted in a mean sensitivity of 97.2 and specificity of 85.2, respectively [31]. Additional work [28] confirmed [30] previous observations regarding discrepancies between phenotypic resistance and genotypic resistance of aminoglycoside resistant genes. The authors concluded that 35 isolates carrying streptomycin resistance genes were phenotypically susceptible to the drug.
In 2019, a WGS study [32] involving multiple phenotypic susceptibility testing methods produced ME and VME rates of 4.5% and 17%. Fifty-one of the VME’s were the result of discordant sulfisoxazole and sulfamethoxazole predictions. Interpretation of seven antimicrobials using Salmonella clinical breakpoints produced low genotyping sensitivity and specificities values of 0.84 and 0.88, respectively. Upon exclusion of the VME rates for streptomycin and sulfamethoxazole, said values increased to 0.89 and 0.97. Notably, the WGS-based genotyping methods used in the study did not account for attenuation mechanisms or reliably predict for underlying temporary genetic features (tandem repeats) present in subpopulations (heteroresistance) during phenotypic testing [33].
Whether heteroresistance will prevent WGS from becoming the primary diagnostic tool for antibiotic resistant pathogens is debatable, given the techniques improving resolution and increasing usage by food and drug industries. It is worth mentioning that for the past thirty years, the evolution of MDR S. enterica serotype Kentucky and the subsequent emergence of the MDR clone in Africa and the EU were successfully mapped using WGS [34]. During that time, WGS has undoubtedly improved the understanding of serovar resistome profiles and the employment of smarter antibiotic resistance combat strategies.
4. Automated Phenotypic Testing
4.1. Manual and Semi-Automated Antimicrobial Susceptibility Test (AST)
AST is used to determine the MIC of an antimicrobial required to limit a pathogen’s growth in accordance with guidelines provided by the Clinical and Laboratory Standards Institute (CLSI) or the European Committee on Antimicrobial Susceptibility Testing (EU- CAST in optimized media for a standardized period [35]. Traditionally that media is a broth or agar in which microdilution tests or disk diffusion tests between 35−37 °C are conducted. Tests performed using liquid-based methods measure change in optical density whilst disk diffusion methods estimate the antibiotic inhibition zone on agar plates following 24 h incubation. The size of the zone is a direct measure of the susceptibility of the bacteria to an antibiotic and is inversely related to the minimum inhibitory concentration MIC). Agar and broth dilution are some of the earliest techniques used to measure MIC. The advantages of broth dilution are its reproducibility and cost-effectiveness. A modern version of the technique called microbroth dilution, is now commonly employed.
Minimum inhibitory values are also determined by several other methods such as paper diffusion, E-tests, Biolog MT plate, turbidity and absorbance assays. Although relatively inexpensive many of these growth dependent methods are hindered by long incubation periods sometimes taking more than 16 h to complete [36]. As a matter of urgency, the FDA recently approved five semi-automated systems for clinical use, including Phoenix™ (Becton Dickinson Diagnostic Systems, https://www.bd.com/en-us, accessed on 1 February 2021), Sensititer ARIS 2X™ (Trek Diagnostic Systems, https://www.thermofisher.com, accessed on 1 February 2021), WalkAway™ (Siemens Medical Solutions Diagnostics, https://www.beckmancoulter.com, accessed on 1 February 2021), and the VITEK systems 2™, https://www.biomerieux-usa.com/vitek-2, accessed on 1 February 2021). The VITEK system employs three sensing modalities, absorbance, fluorescence, and turbidity, to determine an antibiotic’s MIC. The average time of an MIC for an antibiotic using the said system is 8 h. Recent work [37] showed that the performance (sensitivity and range) of the VITEK system could be significantly enhanced when a mono-sulfonated tetrazolium salt such as “EZMTT” is added to the growth medium. Alternatively, one can use the highly automated fluorescent-based DxM Micro Scan WalkAway™ system. The advantage of DxM is that each MicroScan Dried Gram-Negative (MSDGN) MIC panel is pre-packaged with a tailored growth medium, fluorogenic panel and an antibiotic. Hydrolysis of the fluorogenic panel correlates directly to enzymatic activity, permitting the inclusion of persistent Salmonella in the MIC measurement [38].
Isolation, identification, and AST procedures can take from 2–7 days, depending on the number of samples and availability of automated culturing equipment (ACE). For example, the “Walk Away” specimen processor unit (WASP™) and BDs Kiestra TLA™ or BACTEC MGIT™ can reliably detect antibiotic resistant Salmonella in a much shorter period compared to manual approaches [39]. In 2018 initial trials of the Accelerated PhenoTest BC™ (Accelerated Diagnostics) showed it was possible to combine the identification and AST stages in a single test [40].
The PhenoTest utilizes a combination of fluorescence in situ hybridization (FISH) and electro-kinetic focusing to concentrate and identify bacteria. The concentrated cells then undergo analysis via automated dark field microscopy (ADFM). ADFM utilizes a series of stacked z-images to monitor changes in colony shape, surface area, and segmentation. The compiled image permits the differentiation of bacterial growth, death, and elongation. When combined with deep learning processes, the Accelerated PhenoTest BC™ and the recently introduced QMAC-dRAST™ (QuantaMatrix, Inc.; Seoul, Korea) can generate a MIC in less than 7 h. Unfortunately, the FDA recalled the Accelerated PhenoTest BC™ kit in late 2018 due to the high number of false positives [40]. For readers seeking an in-depth perspective regarding commercial AST testing, multiple reviews are recommended [36][40].
4.2. Detection of Intracellular Resistance Salmonella Using Flow Cytometry
Flow cytometry (FC) is an optical technique that measures the fluorescent and scattering properties of a laser integrated single line of cells as they continuously flow by a detector or detectors [41]. Differing flow rates can be used to study antibiotic-induced changes in cellular morphology, intracell heterogeneity, cell-to-cell interaction (e.g., quorum sensing), and in the analysis of subpopulations of persistent and moderately resistant strains of Salmonella [42]. As well as persistence, FC has also been used to measure the transfer ratios of the multi-antibiotic resistant plasmid pB10 in multiple strains of Salmonella [43] and reliably determine antibiotic susceptible gram-negative phenotypes albeit in the absence of mammalian cells [44]. In addition to susceptibility, the re-potentiation of antibiotics in the presence of primary metabolites and subsequent elimination of persistent Salmonella from macrophages was also evaluated [45] with FC.
Elimination of persistent Salmonella residing in the lymph nodes of animals and humans remains a costly and significant challenge. Some of the initial work in 2014 [46] using FC, a mouse typhoid fever model and the single-cell growth reporter (DsRed S197T) showed that differential host nutrient supply contributed to the heterogeneity of Salmonella subsets. Assessment of the antimicrobial tolerance of the various subsets showed overall eradication was delayed primarily by abundant moderately growing Salmonella with partial tolerance.
In another study, GFP-expressing S. Dublin (SD3246-GFP) was used to estimate the degree of intracellular infection in bovine-derived macrophages sourced from 3 and 28-day-old Friesian bull calves. Confirmation by gentamicin-protection assay showed S. Dublin intracellular replication and survival were arrested after 6 h and up to 24 h, respectively [47]. Interestingly, FC results revealed that the majority of infected cells expressed MHCII, CD40, CD80, CD86, CD11b and CD11c but did not express CD1 Further analysis revealed that infected MHCII+ macrophage-like cells expressed elevated levels of MHCII and CD40 compared to uninfected cells, which is in contrast to observations reported with murine models. The authors attributed these inconsistencies to unnatural target species used in previous studies [48].
Given FC’s ability to simultaneously measure susceptible, intermediate, and resistant (SIR) phenotypes, several initiatives have been proposed by various national, European, and international bodies to promote the development of rapid FC based AST assays. Of note is the commercialized FASTvet assay (FASTinov®) developed by the Fast-Bac European consortium. In a recent study, the kit-assay exceeded expectations demonstrating an AST turn-around time of 2 h for 13 antimicrobials [49], which is significantly faster than dRAST and many other automated phenotypic and genotypic platforms described herein. However, the authors did note that further testing using whole blood samples was required for veterinary usage.
Flow cytometry remains a highly versatile measurement tool, capable of determining the susceptibility of pre-enriched bacterial isolates, the transfer ratios of antibiotic resistant plasmids in multiple strains of Salmonella and mammalian cells that harbor antibiotic resistant species. Moreover, with the advent of the FASTvet assay, FC has the potential to rapidly identify and monitor antibiotic resistance bacteria in food animals.
5. Emerging Biosensors
Depending on the application (microbiology or biological), many definitions of a biosensor have been reported in the literature [50][51]. According to the International Union of Pure and Applied Chemistry, a biosensor is an integrated receptor (protein or DNA) transducer device capable of providing specific quantitative or qualitative information via a biological recognition element (BRE). Simply put, when a specific analyte binds to a receptor, a transfer (mass, electrical, thermal, magnetic, or photonic energy) occurs between the two, which is detected via a prescribed transduction element (e.g., electrode pattern, optical waveguide, fiber, cantilever, etc.). The transduction element then relays the information to an integrated (small screen) or separate (human, laptop) monitoring component. A “device” is a single entity upon which binding, transfer, and monitoring occur. Biological recognition elements used in microbial sensing include antibodies, toxins, nucleic acids, whole cells, and biomimetic materials [52][53][54].
A summary of the biosensors used in the detection of antibiotic resistant serotypes discussed herein is shown Table 1.
Table 1. Biosensors used in the detection of antibiotic-resistant Salmonella serotypes. SERS (surface enhanced Raman spectroscopy).
|
Salmonella Serotypes |
Sensing Method |
Sample Matrix |
Analysis Time (min) |
Detection Limit (CFU/mL) |
Reference |
|---|---|---|---|---|---|
|
S. Typhimurium DT104 |
SERS |
Assay media |
30 |
105 |
[53] |
|
S. Typhimurium DT104 |
SERS |
Assay media |
15 |
105 |
[55] |
|
S. Typhimurium |
SERS |
H2O & milk |
120 |
20 |
[54] |
|
S. enterica |
Raman Spectroscopy |
Urine |
150 |
n/a |
[56] |
|
S. Enteritidis, |
Fluorescence |
Water, milk, and beef |
30 |
2.0 × 10² |
[57] |
|
S. Typhimurium DT104 and S. Typhi |
SERS |
Assay media |
120 |
100 |
[58] |
References
- Grimont, P.A.; Weill, F.X. Antigenic. Formulae of Salmonella Serovars, 9th ed.; WHO Collaborating Centre for Reference and Research on Salmonella: Geneva, Switzerland, 2007.
- Bugarel, M.; Granier, S.A.; Weill, F.X.; Fach, P.; Brisabois, A. A multiplex real-time PCR assay targeting virulence and resistance genes in Salmonella enterica serotype Typhimurium. BMC Microbiol. 2011, 11, 151.
- WHO. WHO Estimates of the Global Burden of Foodborne Diseases: Foodborne Disease Burden Epidemiology Reference Group 2007–2015; WHO: Geneva, Switzerland, 2016.
- Lee, K.M.; Runyon, M.; Herrman, T.J.; Phillips, R.; Hsieh, J. Review of Salmonella detection and identification methods: Aspects of rapid emergency response and food safety. Food Control. 2015, 47, 264–276.
- Stephen Inbaraj, B.; Chen, B.H. Nanomaterial-based sensors for detection of foodborne bacterial pathogens and toxins as well as pork adulteration in meat products. J. Food. Drug. Anal. 2016, 24, 15–28.
- Farooq, U.; Yang, Q.; Ullah, M.W.; Wang, S. Bacterial biosensing: Recent advances in phage-based bioassays and biosensors. Biosens. Bioelectron. 2018, 118, 204–216.
- Chong, A.; Lee, S.; Yang, Y.A.; Song, J. The role of typhoid toxin in Salmonella Typhi virulence. Yale J. Biol. Med. 2017, 90, 283–290.
- Tamamura, Y.; Tanaka, K.; Uchida, I. Characterization of pertussis-like toxin from Salmonella spp. that catalyzes ADP-ribosylation of G proteins. Sci. Rep. 2017, 7, 2653.
- Miller, R.A.; Betteken, M.I.; Guo, X.; Altier, C.; Duhamel, G.E.; Wiedmann, M. The typhoid toxin produced by the Non-typhoidal Salmonella enterica Serotype javiana is required for induction of a DNA damage response in Vitro and systemic spread in Vivo. MBio 2018, 9, e00467-18.
- Cheng, R.A.; Wiedmann, M. The ADP-ribosylating toxins of Salmonella. Toxins 2019, 11, 416.
- Outbreaks of Salmonella Infections Linked to Backyard Poultry. Final Update; 2019. Available online: https://www.cdc.gov/salmonella/backyardpoultry-05-19/index.html/ (accessed on 2 March 2020).
- CDC 2011. National Enteric Disease Surveillance: Salmonella Annual Summary; US Department of Health and Human Services, CDC: Atlanta, GA, USA, 2011.
- Gebreyes, W.A.; Thakur, S. Multidrug-resistant Salmonella enterica serovar Muenchen from pigs and humans and potential interserovar transfer of antimicrobial resistance. Antimicrob. Agents. Chemother. 2005, 49, 503–511.
- Srinivasan, A. Antibiotic stewardship: Why we must, how we can. Clevel. Clin. J. Med. 2017, 84, 673–679.
- Selvin, J.; Maity, D.; Sajayan, A.; Kiran, G.S. Revealing antibiotic resistance in therapeutic and dietary probiotic supplements. J. Glob. Antimicrob. Resist. 2020, 22, 202–205.
- Xiang, Y.; Li, F.; Dong, N.; Tian, S.; Zhang, H.; Du, X.; Zhou, X.; Xu, X.; Yang, H.; Xie, J.; et al. Investigation of a Salmonellosis Outbreak Caused by Multidrug Resistant Salmonella Typhimurium in China. Front. Microbiol. 2020, 11, 1–12.
- Wang, Z.; Xu, H.; Tang, Y.; Li, Q.; Jiao, X. A Multidrug-resistant Monophasic Salmonella bla CTX-M-14 in a Transferable IncHI2 Plasmid from a Healthy Catering Worker in China. Infect. Drug. Resist. 2020, 13, 3569–3574.
- Besser, J.M. Salmonella epidemiology: A whirlwind of change. Food Microbiol. 2018, 71, 55–59.
- Aydindogan, E.; Guler Celik, E.; Timur, S. Paper-Based Analytical Methods for Smartphone Sensing with Functional Nanoparticles: Bridges from Smart Surfaces to Global Health. Anal. Chem. 2018, 90, 12325–12333.
- Kanchi, S.; Sabela, M.I.; Mdluli, P.S.; Inamuddin; Bisetty, K. Smartphone based bioanalytical and diagnosis applications: A review. Biosens. Bioelectron. 2018, 102, 136–149.
- Yang, Q.; Domesle, K.J.; Ge, B. Loop-Mediated Isothermal Amplification for Salmonella Detection in Food and Feed: Current Applications and Future Directions. Foodborne Pathog. Dis. 2018, 15, 309–331.
- McLain, J.E.; Cytryn, E.; Durso, L.M.; Young, S. Culture-based Methods for Detection of Antibiotic Resistance in Agroecosystems: Advantages, Challenges, and Gaps in Knowledge. J. Environ. Qual. 2016, 45, 432–440.
- Nair, D.V.T.; Thomas, J.V.; Dewi, G.; Johnson, T.; Noll, S.; Cardona, C.; Kollanoor-Johny, A. Effects of Multiple Alternatives-To-Antibiotic Interventions on Multidrug-Resistant Salmonella Heidelberg in Turkey Poults. In Proceedings of the 2017 PSA Annual Meeting, Orlando, FL, USA, 17–20 July 2017; Volume 96, p. 24.
- Carrique-Mas, J.J.; Davies, R.H. Sampling and bacteriological detection of Salmonella in poultry and poultry premises: A review. Rev. Sci. Tech. 2008, 27, 665–677.
- Shah, D.H.; Casavant, C.; Hawley, Q.; Addwebi, T.; Call, D.R.; Guard, J. Salmonella Enteritidis strains from poultry exhibit differential responses to acid stress, oxidative stress, and survival in the egg albumin. Foodborne Pathog. Dis. 9, 258–264.
- Brown, E.; Dessai, U.; Mcgarry, S.; Gerner-Smidt, P. Use of Whole-Genome Sequencing for Food Safety and Public Health in the United States. Foodborne Pathog. Dis. 2019, 16, 441–450.
- Gupta, S.K.; Sharma, P.; McMillan, E.A.; Jackson, C.R.; Hiott, L.M.; Woodley, T.; Humayoun, S.B.; Barrett, J.B.; Frye, J.G.; McClelland, M. Genomic comparison of diverse Salmonella serovars isolated from swine. PLoS ONE 2019, 14, e0224518.
- Almeida, F.; Seribelli, A.A.; Cazentini Medeiros, M.I.; Rodrigues, D.d.P.; de MelloVarani, A.; Luo, Y.; Allard, M.W.; Falcão, J.P. Phylogenetic and antimicrobial resistance gene analysis of Salmonella Typhimurium strains isolated in Brazil by whole genome sequencing. PLoS ONE 2018, 13, e0201882.
- Garcia-Migura, L.; Sunde, M.; Karlsmose, S.; Veldman, K.; Schroeter, A.; Guerra, B.; Granier, S.A.; Perrin-Guyomard, A.; Gicquel-Bruneau, M.; Franco, A.; et al. Establishing streptomycin epidemiological cut-off values for Salmonella and Escherichia coli. Microb. Drug Resist. 2012, 18.
- McDermott, P.F.; Tyson, G.H.; Kabera, C.; Chen, Y.; Li, C.; Folster, J.P.; Ayers, S.L.; Lam, C.; Tate, H.P.; Zhao, S. Whole-genome sequencing for detecting antimicrobial resistance in non-typhoidal Salmonella. Antimicrob. Agents Chemother. 2016, 60, 5515–5520.
- Carroll, L.M.; Wiedmann, M.; den Bakker, H.; Siler, J.; Warchocki, S.; Kent, D.; Lyalina, S.; Davis, M.; Sischo, W.; Besser, T.; et al. Whole-Genome Sequencing of Drug-Resistant Salmonella enterica Isolates from Dairy Cattle and Humans in New York and Washington States Reveals Source and Geographic Associations. Appl. Environ. Microbiol. 2017, 83, e00140-17.
- Mensah, N.; Tang, Y.; Cawthraw, S.; Abuoun, M.; Fenner, J.; Thomson, N.R.; Mather, A.E.; Petrovska-Holmes, L. Determining antimicrobial susceptibility in Salmonella enterica serovar Typhimurium through whole genome sequencing: A comparison against multiple phenotypic susceptibility testing methods. BMC Microbiol. 2019, 19, 148.
- Zwe, Y.H.; Chin, S.F.; Kohli, G.S.; Aung, K.T.; Yang, L.; Yuk, H.G. Whole genome sequencing(WGS) fails to detect antimicrobial resistance (AMR) from heteroresistant subpopulation of Salmonella enterica. Food Microbiol. 2020, 91, 103530.
- Hawkey, J.; le Hello, S.; Doublet, B.; Granier, S.A.; Hendriksen, R.S.; Florian Fricke, W.; Ceyssens, P.J.; Gomart, C.; Billman-Jacobe, H.; Holt, K.E.; et al. Global phylogenomics of multidrug-resistant salmonella enterica serotype kentucky ST198. Microb. Genom. 2019, 5, e000269.
- European Committee on Antimicrobial Susceptibility Testing. MIC and Zone Diameter Distributions and ECOFFs. EUCAST, 2018. Available online: http://www.eucast.org/mic_distributions_and_ecoffs/ (accessed on 24 December 2020).
- Choi, J.R.; Yong, K.W.; Choi, J.Y.; Cowie, A.C. Emerging point-of-care technologies for food safety analysis. Sensors 2019, 19, 817.
- Kim, S.; Masum, F.; Jeon, J.S. Recent Developments of Chip-based Phenotypic Antibiotic Susceptibility Testing. Biochip J. 2019.
- Hu, Q.; Yu, Y.; Gu, D.; Xie, L.; Chen, X.; Xu, N.; Ruan, J.J.; Dowson, C.; Ruan, B.H. Detection of “hidden” Antimicrobial Drug Resistance. ACS Infect. Dis. 2019, 5, 1252–1263.
- Garner, O.; Traczewski, M.M.; Beasley, D.; Harrington, A.; DesJarlais, S.; Hastey, C.; Brookman, R.; Lockett, Z.; Chau, J. 667. Multicenter Assessment of Enterobacterales, Salmonella spp. and Pseudomonas aeruginosa Using Updated CLSI Levofloxacin Breakpoints on MicroScan Dried Gram-Negative MIC Panels. Open Forum Infect. Dis. 2020, 7 (Suppl. S1), S388–S389.
- Leonard, H.; Colodner, R.; Halachmi, S.; Segal, E. Recent Advances in the Race to Design a Rapid Diagnostic Test for Antimicrobial Resistance. ACS Sens. 2018, 3, 2202–2217.
- Adan, A.; Alizada, G.; Kiraz, Y.; Baran, Y.; Nalbant, A. Flow cytometry: Basic principles and applications. Crit. Rev. Biotechnol. 2017, 37, 163–176.
- Ambriz-Aviña, V.; Contreras-Garduño, J.A.; Pedraza-Reyes, M. Applications of Flow Cytometry to Characterize Bacterial Physiological Responses. BioMed Res. Int. 2014, 461941.
- Van Meervenne, E.; van Coillie, E.; Kerckhof, F.M.; Devlieghere, F.; Herman, L.; de Gelder, L.S.P.; Top, E.M.; Boon, N. Strain-specific transfer of antibiotic resistance from an environmental plasmid to foodborne pathogens. J. Biomed. Biotechnol. 2012, 834598.
- Huang, T.H.; Tzeng, Y.L.; Dickson, R.M. FAST: Rapid determinations of antibiotic susceptibility phenotypes using label-free cytometry. Cytom. Part A. 2018, 93, 639–648.
- Rishi, P.; Bhagat, N.R.; Thakur, R.; Pathania, P. Tackling Salmonella Persister Cells by Antibiotic-Nisin Combination via Mannitol. Indian J. Microbiol. 2018, 58, 239–243.
- Claudi, B.; Spröte, P.; Chirkova, A.; Personnic, N.; Zankl, J.; Schürmann, N.; Schmidt, A.; Bumann, D. Phenotypic variation of Salmonella in host tissues delays eradication by antimicrobial chemotherapy. Cell 2014, 158, 722–733.
- Vohra, P.; Vrettou, C.; Hope, J.C.; Hopkins, J.; Stevens, M.P. Nature and consequences of Interactions between Salmonella enterica serovar Dublin and host cells in cattle. Vet. Res. 2019, 50, 99.
- Tsolis, R.M.; Adams, L.G.; Ficht, T.A.; Baumler, A.J. Contribution of Salmonella typhimurium virulence factors to diarrheal disease in calves. Infect. Immun. 1999, 67, 4879–4885.
- Andrade, F.F.; Gomes, R.; Martins-Oliveira, I.; Dias, A.; Rodrigues, A.G.; Pina-Vaz, C. A Rapid Flow Cytometric Antimicrobial Susceptibility Assay (FASTvet) for Veterinary Use-Preliminary Data. Front. Microbiol. 2020, 11, 1944.
- Jamerlan, A.; An, S.S.A.; Hulme, J. Advances in amyloid beta oligomer detection applications in Alzheimer’s disease. TrAC Trends Anal. Chem. 2020, 129, 115919.
- Giau, V.V.; An, S.S.A.; Hulme, J. Recent advances in the treatment of pathogenic infections using antibiotics and nano-drug delivery vehicles. Drug Des. Devel. Ther. 2019, 13, 327–343.
- Paniel, N.; Noguer, T. Detection of Salmonella in food matrices, from conventional methods to recent aptamer-sensing technologies. Foods 2019, 8, 371.
- Khan, S.A.; Singh, A.K.; Senapati, D.; Fan, Z.; Ray, P.C. Bio-conjugated popcorn shaped gold nanoparticles for targeted photothermal killing of multiple drug resistant Salmonella DT104. J. Mater. Chem. 2011, 21, 17705–17709.
- Jia, M.; Liu, Z.; Wu, C.; Zhang, Z.; Ma, L.; Lu, X.; Mao, Y.; Zhang, H. Detection of Escherichia coli O157:H7 and Salmonella enterica serotype Typhimurium based on cell elongation induced by beta-lactam antibiotics. Analyst 2019, 144, 4505–4512.
- Lin, Y.; Hamme, A.T. Targeted highly sensitive detection/eradication of multidrug resistant Salmonella DT104 through gold nanoparticle-SWCNT bioconjugated nanohybrids. Analyst 2014, 139, 3702–3705.
- Yang, K.; Li, H.Z.; Zhu, X.; Su, J.Q.; Ren, B.; Zhu, Y.G.; Cui, L. Rapid Antibiotic Susceptibility Testing of Pathogenic Bacteria Using Heavy-Water-Labeled Single-Cell Raman Spectroscopy in Clinical Samples. Anal. Chem. 2019, 91, 6296–6303.
- Zeinhom, M.M.A.; Wang, Y.; Sheng, L.; Du, D.; Li, L.; Zhu, M.J.; Lin, Y. Smart phone based immunosensor coupled with nanoflower signal amplification for rapid detection of Salmonella Enteritidis in milk, cheese and water. Sens. Actuators B Chem. 2018, 261, 75–82.
- Pramanik, A.; Davis, D.; Patibandla, S.; Begum, S.; Ray, P.; Gates, K.; Gao, Y.; Chandra Ray, P. A WS2-gold nanoparticle heterostructure-based novel SERS platform for the rapid identification of antibiotic-resistant pathogens. Nanoscale Adv. 2020, 2025–2033.
More
Information
Subjects:
Food Science & Technology
Contributors
MDPI registered users' name will be linked to their SciProfiles pages. To register with us, please refer to https://encyclopedia.pub/register
:
View Times:
645
Revisions:
2 times
(View History)
Update Date:
15 Sep 2023
Table of Contents


Notice
You are not a member of the advisory board for this topic. If you want to update advisory board member profile, please contact office@encyclopedia.pub.
OK
Confirm
Only members of the Encyclopedia advisory board for this topic are allowed to note entries. Would you like to become an advisory board member of the Encyclopedia?
Yes
No
${ textCharacter }/${ maxCharacter }
Submit
Cancel
Back
Comments
${ item }
|
${ item.createdUser.fullName }
${ item.createdAt }
${ item.vote }
${ item.reply }
Delete
${ reply.createdUser.fullName }
${ reply.createdAt }
${ reply.vote }
Delete
There is no reply to this comment~
${ item.replyTextCharacter }/${ item.replyMaxCharacter }
Submit
Cancel
More
No more~
There is no comment~
${ textCharacter }/${ maxCharacter }
Submit
Cancel
${ selectedItem.replyTextCharacter }/${ selectedItem.replyMaxCharacter }
Submit
Cancel
Confirm
Are you sure to Delete?
Yes
No