Your browser does not fully support modern features. Please upgrade for a smoother experience.
Submitted Successfully!
 +1 credit
Thank you for your contribution! You can also upload a video entry or images related to this topic.
For video creation, please contact our Academic Video Service.
| Version | Summary | Created by | Modification | Content Size | Created at | Operation |
|---|---|---|---|---|---|---|
| 1 | Yue Dong | -- | 2163 | 2023-06-13 12:11:55 | | | |
| 2 | Alfred Zheng | -2 word(s) | 2161 | 2023-06-14 04:21:17 | | | | |
| 3 | Alfred Zheng | -205 word(s) | 1956 | 2023-06-15 09:00:51 | | |
Video Upload Options
We provide professional Academic Video Service to translate complex research into visually appealing presentations. Would you like to try it?
Cite
If you have any further questions, please contact Encyclopedia Editorial Office.
Chen, S.; Dong, Y.; Chen, X.; Xu, X.; Gong, J. Ancient Urban Land-Use Based on Geographic Information System. Encyclopedia. Available online: https://encyclopedia.pub/entry/45497 (accessed on 21 July 2026).
Chen S, Dong Y, Chen X, Xu X, Gong J. Ancient Urban Land-Use Based on Geographic Information System. Encyclopedia. Available at: https://encyclopedia.pub/entry/45497. Accessed July 21, 2026.
Chen, Siliang, Yue Dong, Xiangyu Chen, Xinyue Xu, Jiangbo Gong. "Ancient Urban Land-Use Based on Geographic Information System" Encyclopedia, https://encyclopedia.pub/entry/45497 (accessed July 21, 2026).
Chen, S., Dong, Y., Chen, X., Xu, X., & Gong, J. (2023, June 13). Ancient Urban Land-Use Based on Geographic Information System. In Encyclopedia. https://encyclopedia.pub/entry/45497
Chen, Siliang, et al. "Ancient Urban Land-Use Based on Geographic Information System." Encyclopedia. Web. 13 June, 2023.
Copy Citation
As ancient cities are spaces that represent the development of civilization, it is worth exploring and studying their characteristics and conceptions of land use. The city plan was calibrated with the help of satellite remote sensing images and sites. By constructing the “urban element area acquisition and analysis model”, various operations for areas in the city plan were realized, including an area value calculation, land use structure calculation, area modulus analysis, area ratio analysis between areas, and determination of the cultural significance of numbers and ratios. Taking the Sui and Tang dynasties capital city of Chang'an as an example, it will be described in detail below.
GIS
geographic information system
ancient urban land use
Chang’an City of the Sui and Tang Dynasties
1. Introduction
A city is the spatial representation of a particular human civilization. The function and distribution modes of land in the city relate to the quality and efficiency of the city’s operations and also highlight the idea of urban planning. Ancient urban heritage is an important aspect of human cultural heritage, and exploring its planning concepts is of great significance. However, as few drawings or detailed texts related to the planning of ancient cities have been preserved, modern people can only study the land use characteristics of ancient cities based on sites or relics and then speculate on the urban planning ideas of the ancients. This creates research difficulties that must be solved using multidisciplinary knowledge.
The study of ancient urban land planning involves a variety of issues, of which two challenges stand out: the extraction and quantitative analysis of data on ancient urban land use, and the intelligent exploration and interpretation of planning ideas based on land use characteristics.
1.1. The Extraction and Quantitative Analysis of Data on Ancient Urban Land Use
In terms of data extraction, quantity structure, spatial structure, and intensity are the main indicators used to measure urban land use. The quantity structure is fundamentally related to the allocation of related urban resources, and the spatial structure is intuitively correlated to the urban form; meanwhile, there are few research results on land use intensity due to the lack of ancient data. Scholars have mainly extracted relevant data by measuring satellite images (often in conjunction with geographic information system (GIS)s) [1][2], measuring archaeological sites in the field [3], and searching ancient literature and maps [4][5], and other scholars have worked with algorithms for image recognition to achieve the functional classification of land [6]. In terms of quantitative analysis, scholars have used statistical tables, GISs, and other research tools to conduct analysis. The statistical table is a more traditional tool, but its analytical power is limited and not suitable for the intuitive analysis of large amounts of data [7][8]. The GIS is a good tool that integrates data acquisition and analysis, specific plug-ins can be developed to achieve specific research functions, and there are also analyses that combine GISs with spatial syntax theory [9][10][11][12][13][14][15][16][17]. This theory abstracts the interrelation between spaces into a connection graph and then carries out the relevant numerical analysis [18][19]. The main variables used for calculation include connectivity, depth, control, integration, and choice. This can effectively transform perceptual visual analysis into rational mathematical analysis, which has certain advantages for the analysis of urban form.
The above tools can be used to analyze the composition and size (area) of each functional land space in the city, obtaining the percentage of each area in the whole city area through a calculation. According to these results, different attribute areas of the city can be compared [20][21].There are also analyses of broader regions (such as provinces) [22][23][24]. Furthermore, the same functional area can also be compared between different cities, considering questions such as the difference in the proportion of residential land in city A and city B [7]. Ancient and modern comparisons can also be made in order to examine the evolution of specific functional spaces over hundreds of years [8][25], allowing researchers to reach some valuable conclusions. However, due to the limited types of functional zones (generally no more than 10) in a specific city, only some preliminary understanding can be obtained merely by analyzing the share of each area, and it is difficult to carry out in-depth urban data analysis.
At present, the analysis of the internal relationships between various spatial areas in ancient cities is very scarce, and it is also difficult to answer key questions such as whether there is an area modulus (minimum area unit) in urban design. Therefore, in order to solve the problems related to ancient cities, researchers should undertake the necessary optimization according to the specific research needs of urban land use analysis, strengthening the secondary development of existing GISs and other tools to achieve specific research functions.
1.2. The Intelligent Exploration and Interpretation of Planning Ideas Based on Land Use Characteristics
Ancient planning ideas are embodied in land use characteristics, and it is necessary to find suitable methods to reveal the links between characteristic data and planning ideas, and to interpret the relevant ideas as a whole. The characteristics of land use mainly relate to the distribution of land use structures and the ratio between areas; multiple characteristics based on the specific area modulus may also exist, which all involve a number of specific numerical values and numerical ratios. Ancient people tended to select culturally significant numbers or numerical ratios and integrate them into the design to highlight the planning ideas. In most of the current studies, the data (especially the ratio data) are obtained by manual graphing analysis. The comparison and interpretation of data are also done manually; if these data are consistent with the knowledge already obtained by experts, it is concluded that they may represent a certain strain of cultural thought. For example, Andrea Palladio (1570) conducted a graphic analysis of the ratio of ancient cities and gave explanations of the cultural aspects of these ratios [26]. Kostof (1999) studied the land division mode of ancient urbans and analyzed the order reflected in their dimensions and proportions through a number of examples of cities with a grid pattern [27]; Wang Nan (2018) analyzed hundreds of ancient Chinese cities and architectures using the circle and square graphing method and posited that most of these cases fit the ratio of √2, 3:2 and √3:2 [28] (which he called “the harmonious ratio between heaven and earth”). Fu Xi’nian (1995) found that the length and width of many ancient capital cities in China were proportional to those of the Imperial Cities and explained this as the “emperor-centered” planning idea [29]. Wang Shusheng (2009) found evidence of the use of nine and five to symbolize imperial power (the Chinese called the emperor “Nine-Five Extreme”) in Chinese ancient capitals [30]. Peixoto, R. F. (2021) investigated the urban grid of Thourioi and revealed its orthogonal planning technique and thoughts [31]. Park, E. and J. M. Shaikh. (2023) analyzed the spatial framework of the ancient Indian urban space and found that its significance derived from the Indus Script Pictorial Form [32].
Despite the many trends found by the above research, this method also has some limitations, which largely arise from the fact that there are many accidental factors involved in analysis based on expert experience, and there is a lack of intelligent and standardized analysis. For example, the objects in the analysis and the values and ratios of these objects may be deliberately screened rather than comprehensively investigated; when dozens of groups of ratios or values appear in the same city object, there is no clear countermeasure on how to choose between them. There is actually a limited number of important values and ratios in a specific culture, but their boundaries have not yet been defined, and a standard database for repeated use has not been established. In addition, there is no uniform threshold standard for screening the analysis results obtained in previous studies, which greatly affects the scientificity and reliability of the analysis. In fact, most of the values and ratios in a specific culture have been established by academics (in line with the cultural consensus and specific mathematical laws). The process of revealing cultural ideas is the process of comparing the values and ratios discovered in cases where the target values and ratios are established. If there are many consistent phenomena, this may be evidence of some kind of cultural idea. This process can be fully realized by computer intelligence; on this basis, a more in-depth analysis of planning ideas can be carried out.
2. Characteristics and Ideas of Ancient Urban Land-Use Based on GIS
Chang’an City of the Sui and Tang Dynasties
Chang’an City of the Sui and Tang Dynasties (hereinafter referred to as “Chang’an City”) was located near Xi’an, Shaanxi Province, China, with geographic coordinates of 108.88°–108.99°E, 34.19°–34.31°N. The city (Figure 1 and Figure 2) was founded in 582 AD by Yang Jian (杨坚), Emperor Wen of the Sui Dynasty; Gao Jiong (高颎), Yu Wenkai (宇文恺), Liu Long (刘龙), and others were responsible for its planning and construction. After its founding, the city was the national capital of the Sui Dynasty. After the collapse of the Sui Dynasty, the Tang Dynasty continued to use it as the national capital. Chang’an City was one of the largest (over 80 square km) capitals in the world from the 6th to the 10th centuries, accommodating up to one million people. It is currently an important heritage site under state protection in China, and the Daming Palace site in the northeast of the city is a world cultural heritage site; therefore, the city has prominent historical and cultural value and research significance [33].
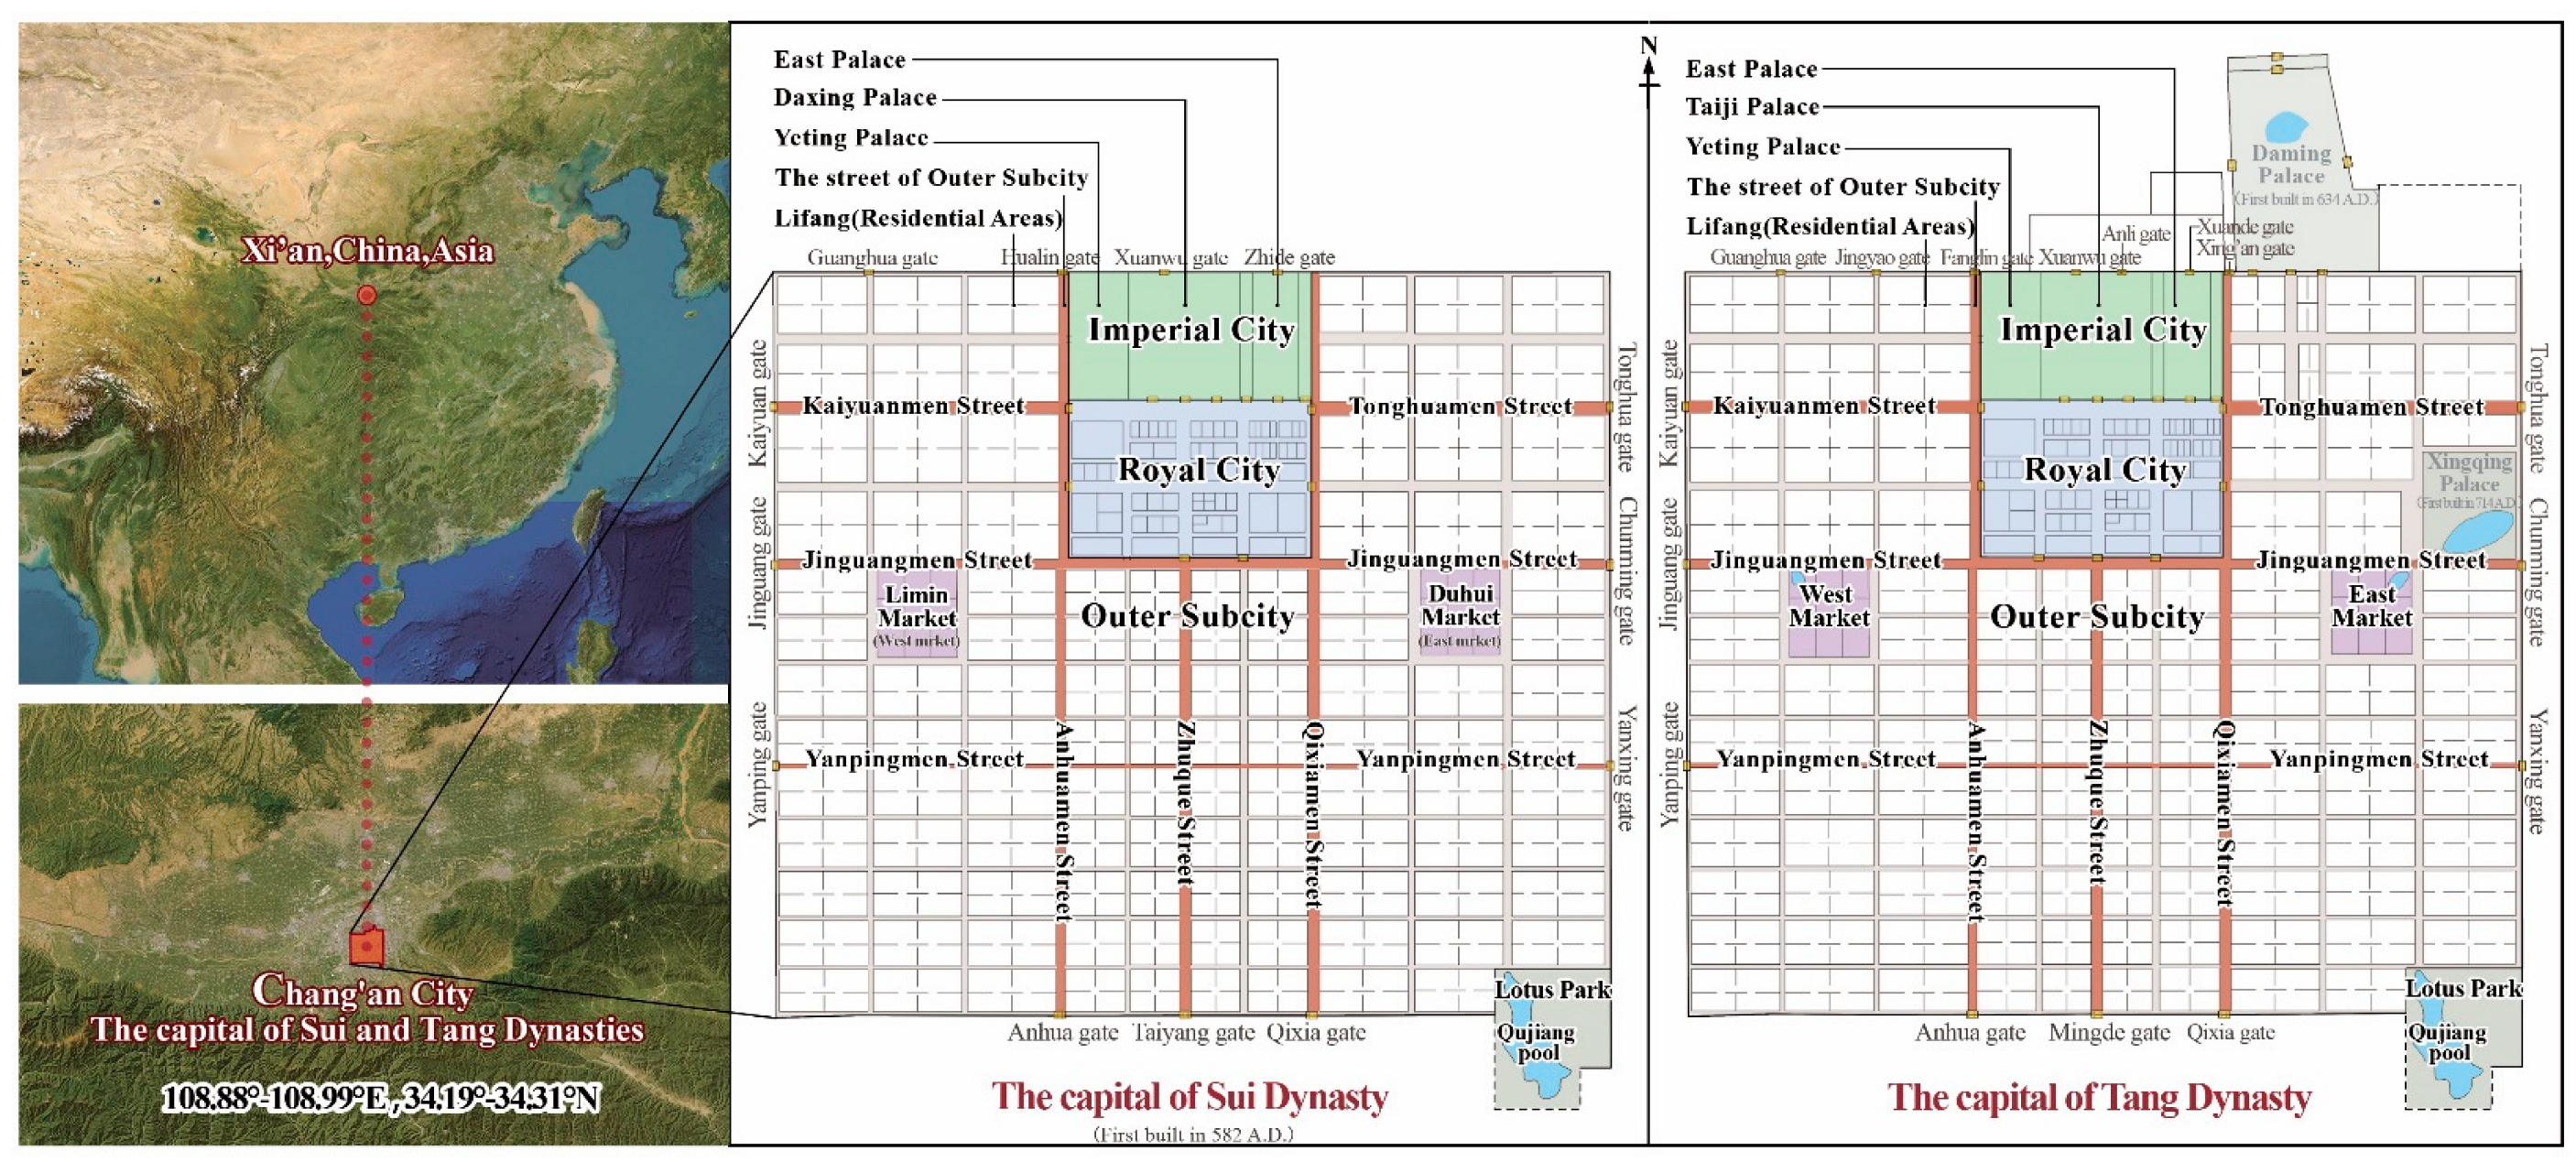
Figure 1. Location Map and ichnography of Chang’an City of the Sui and Tang Dynasties.
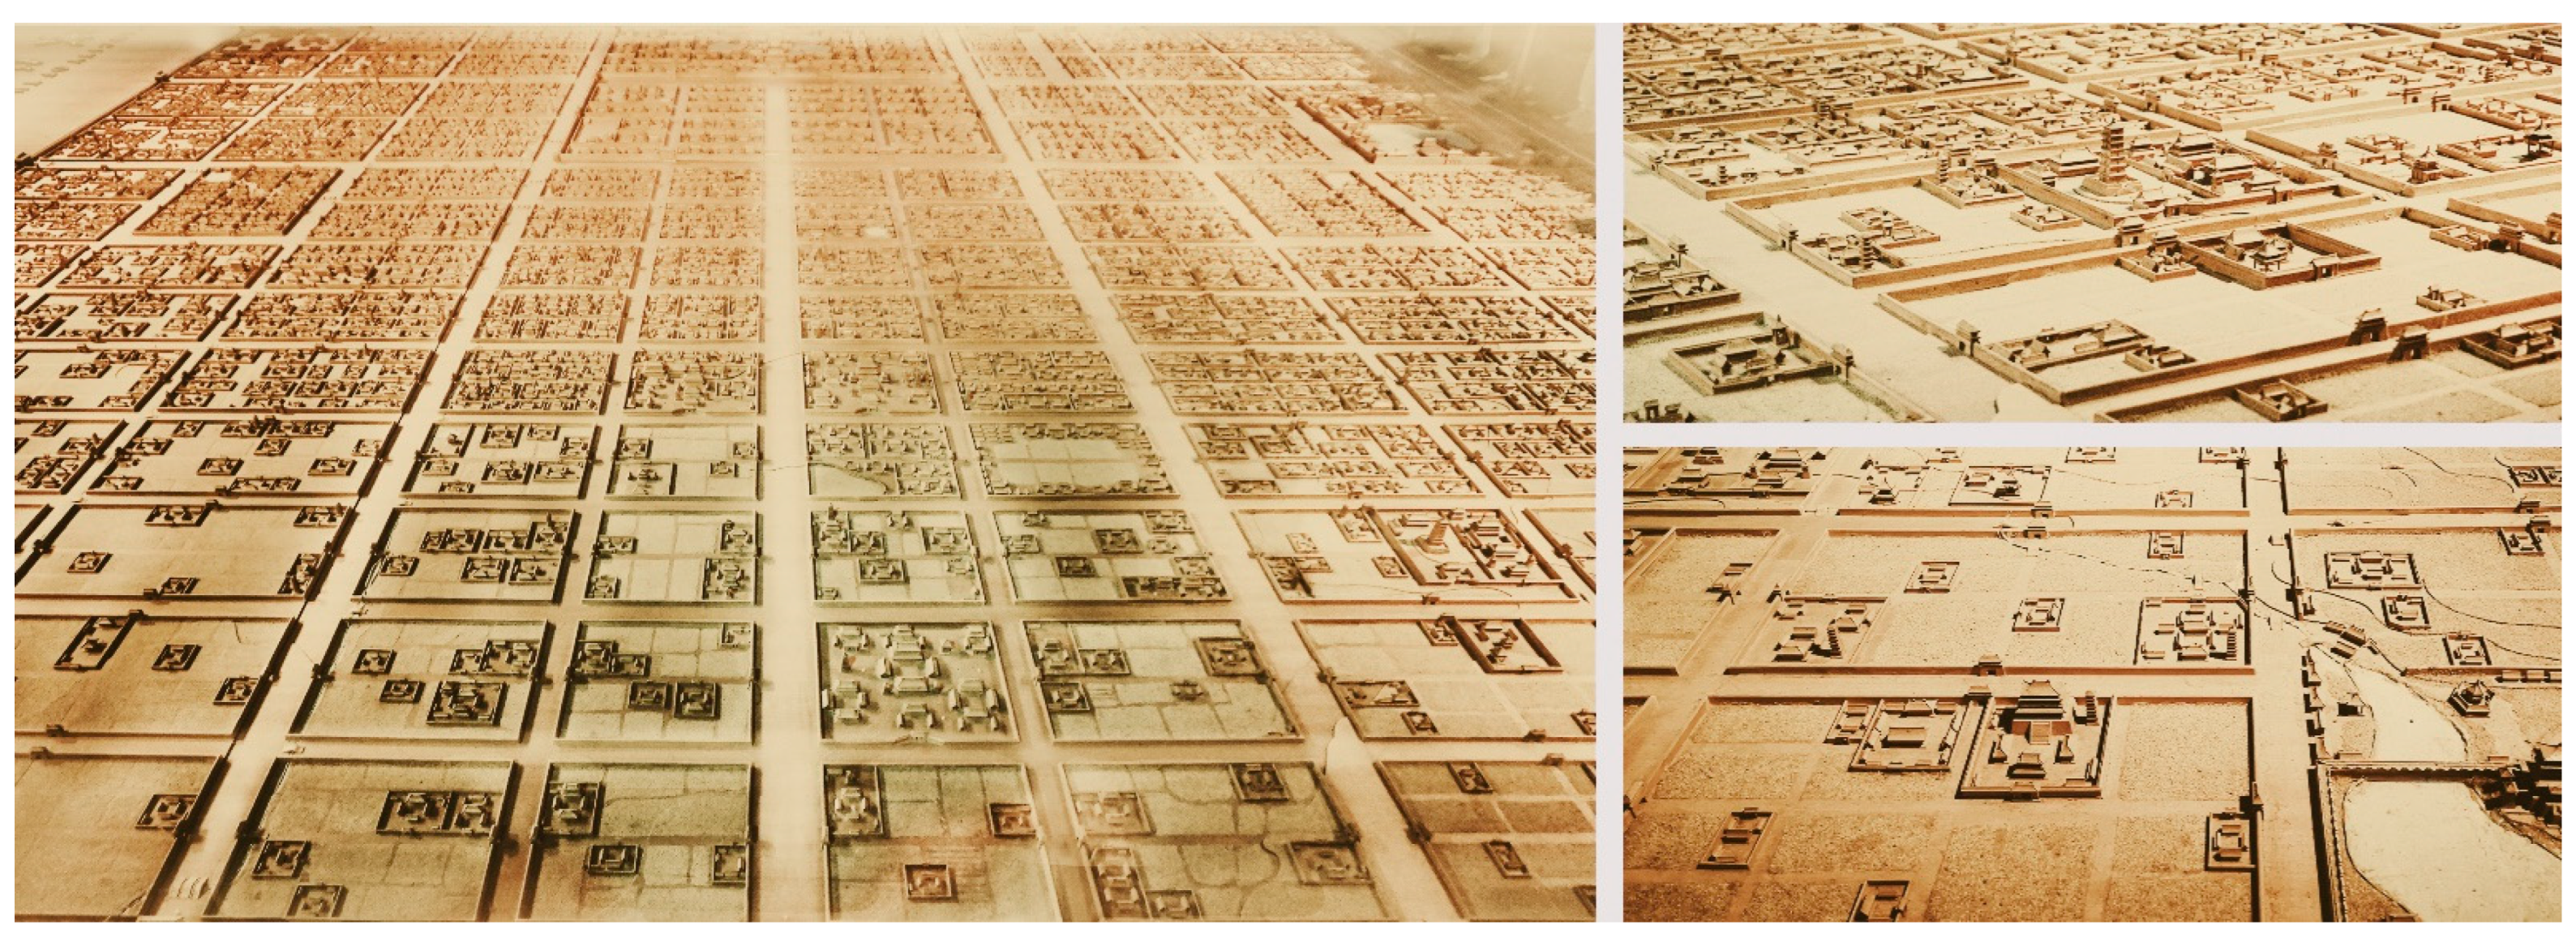
Figure 2. Restored model of Chang’an City of the Sui and Tang Dynasties in Xi’an Museum.
The shape of Chang’an City is basically a regular rectangle, with a transverse width of about 9.6 km and a longitudinal length of about 8.5 km and the ratio of transverse width to longitudinal length is close to 9:8. The Lotus Park in the southeast corner protrudes slightly to the south. If the longitudinal length of the city is calculated according to the south boundary of the Lotus Park, the transverse width is almost equal to the longitudinal length, and the overall urban scope is nearly a standard square. The main body of Chang’an City consists of three parts. In the north of the city is the Imperial City. In the center of the palace is Daxing Palace, which was the residence of the emperor and empress. On the east side is the East Palace, which was the residence of the prince and his subordinates. On the west side is Yeting Palace, which was the residence of the maids and servants; adjacent to it south is the Royal City, which was the office area of government departments. The Imperial City and the Royal City have their own walls, and outside them is a larger Outer Subcity, which is also surrounded by walls and is where the public lives. The East Market and West Market are also located in the Outer Subcity. There are gates on the four sides of the city, with three gates on the east, west, and south sides, and five gates on the north side (at the beginning). The streets in the city are north–south or east–west. The widest street is Zhuque Street, which is about 155 m wide, while other streets vary in width, ranging from 19 to 134 m [33].
Some scholars have found that if Chang’an City is regarded as a regular rectangle, the city is exactly 20 times the size of Daxing Palace [29] and 9 times the size of the Imperial City and the Royal City, and the size of the Imperial City and the Royal City is 5 times that of Daxing Palace [30]. These values indicate that Chang’an City was carefully planned and designed, and this planning deserves further study.
References
- Donati, J.C. The Identification of Land Divisions in the Ancient Mediterranean through Integrated Remote Sensing and GIS Applications; LAC2014 Proceedings; Vrije Universiteit Amsterdam: Amsterdam, The Netherlands, 2020.
- Hammer, E.; Stone, E.; McMahon, A. The structure and hydrology of the early dynastic city of lagash (tell al-hiba) from satellite and aerial images. Iraq 2022, 84, 103–127.
- Xin, L.; Chen, B.; Guo, Y. Preliminary Report in 2022 excavation of the northeastern corner double-walled city and the Shiwangzhai site. Relics Mus. 2023, 1, 3–9.
- Maier, J. Rome Measured and Imagined: Early Modern Maps of the Eternal City; University of Chicago Press: Chicago, IL, USA, 2015.
- Baker, H.D. Urban form in the first millennium BC. In The Babylonian World; Gwendolyn Leick; Routledge: New York, NY, USA; London, UK, 2009; pp. 66–77.
- Bachagha, N.; Wang, X.; Luo, L.; Li, L.; Khatteli, H.; Lasaponara, R. Remote sensing and GIS techniques for reconstructing the military fort system on the Roman boundary (Tunisian section) and identifying archaeological sites. Remote Sens. Environ. 2020, 236, 111418.
- Wang, S.S. The structure of ancient Chinese urban construction land from Hejin and Hancheng. J. Xi’an Univ. Archit. Technol. Nat. Sci. Ed. 2009, 3, 391–396.
- Li, X.X.; Wang, S.S.; Wang, L. The Change of Urban Functions from the Evolution of Construction Land Structure: Taking Chengcheng County in Shaanxi Province as an Example. Mod. Urban Stud. 2016, 10, 53–60.
- Wang, X.K. Space Research on Ancient City of Guangfu Based on Spatial Syntax. Master’s Thesis, Hebei University of Engineering, Handan, China, 2020.
- Jiang, J.L.; Xu, X.Y.; Sun, D.Q.; Li, Y. Research on Spatial Evolution of Ancient City of Guangzhou in Modern Times Based on Improved Space Syntax. Areal Res. Dev. 2018, 37, 54–59.
- Wang, J.F.; Guo, J.P.; Yuan, Y. Spatial Morphological Analysis and Landscape Design of Ancient City: A Case Study of Taigu Ancient City Space. J. Agron. 2016, 6, 60–67.
- Zou, L.L.; Wang, J.Y. Analysis of Spatial Structure of Old Town Land Based on Spatial Syntax: A Case Study of Quanzhou Ancient City. China Land Sci. 2016, 30, 63–70.
- Kang, D. Inside and Outside of the Silla Capital: An Analysis of Urban Spatial Structure Using GIS. J. Korean Bus. Exam. 2020, 108, 61–92.
- Silvestru, C.; Wien, T. The late medieval street layout of Vienna: Digital 2D reconstruction and Space Syntax analysis of the public space. In Proceedings of the 2013 Digital Heritage International Congress (Digital Heritage), Marseille, France, 28 October–1 November 2013.
- Yin, L.; Wang, T.; Adeyeye, K. A Comparative Study of Urban Spatial Characteristics of the Capitals of Tang and Song Dynasties Based on Space Syntax. Urban Sci. 2021, 2, 34.
- Abdelhalim, A.; Ammar, M. Spatial configuration analysis via digital tools of the archeological Roman town Timgad, Algeria. Mediterr. Archaeol. Archaeom. 2021, 21, 71–84.
- Garau, C.; Annunziata, A.; Claudia, Y. Investigating the socio-spatial logic of historic urban areas through space syntax: A comparative analysis of the Roman towns Cosa, Nora, Timgad and Thuburbo Majus. TEMA 2023, 16, 201–219.
- Bill, H.; Julienne, H. The Social Logic of Space; Cambridge University Press: Cambridge, UK, 1989.
- Hillier, B. Cities as movement economies. In Intelligent Environments; North-Holland: Amsterdam, The Netherlands, 1997; Volume 1, pp. 295–344.
- Yang, C. Research on the composition and scale of urban land-use in Yuandu based on ArcGIS. Beijing Hist. 2019, 2, 119–140.
- Su, Y. Study on the Urban Functional Structure and Land-Use Scale of Xi’an in the Ming and Qing Dynasties. Master’s Thesis, Xi’an University of Architecture and Technology, Xi’an, China, 2015.
- Lin, Y.N.; Jin, X.B.; Yang, X.H.; Long, Y.; Guo, B.B.; Han, J.; Zhou, Y.K. Data set establishment and spatial reconstruction of built-up area in the Mid Qing Dynasty: Method and case study. Geogr. Res. 2015, 12, 2329–2342.
- Jin, X.; Pan, Q.; Yang, X.; Bai, Q.; Zhou, Y. Reconstructing the historical spatial land-use pattern for Jiangsu Province in mid-Qing Dynasty. J. Geogr. Sci. 2016, 26, 1689–1706.
- He, F.; Ge, Q.; Zheng, J.J. Reckoning the areas of urban land-use and their comparison in the Qing Dynasty in China. Acta Geogr. Sin. Chin. Ed. 2002, 57, 709–716.
- Ai, W.; Zhuang, D.F.; Liu, Y.Z. Analysis of 100-year changes in urban land-use in Beijing. Geo-Inf. Sci. 2008, 4, 489–494.
- Palladio, A. The Four Books of Architecture; Dover Publications Inc.: Mineola, NY, USA, 1968.
- Spiro, K. The City Shaped: Urban Patterns and Meanings Through History; Thames & Hudson Press: London, UK, 1999.
- Wang, N. A Study on the Composition Proportion of Ancient Chinese Capitals, Architectural Complexes and Individual Buildings; China City Publishing House, China Architecture & Building Press: Beijing, China, 2018.
- Fu, X.N. A discussion of the planning techniques of Luoyang City in Chang’an, Sui and Tang Dynasties. Cult. Relics 1995, 3, 48–63.
- Wang, S.S. An analysis of the planning techniques of Chang’an City in the Sui and Tang Dynasties. Urban Plan. 2009, 33, 55–58.
- Peixoto, R.F.; Florenzano, M.B.B. A Gulliverian orthogonal planning: A modular reading of Classical Thourioi. UFF Hist. Dep. Time Rev. 2021, 1, 1–27.
- Park, E.; Shaikh, J.M. A Blockchain Model (BCM) study of the Syntactic and Semantic grid in Urban History and its origin from the Indus Script Pictorial Form. South. J. Res. 2023, 3, 28–37.
- Institute of Archaeology of Chinese Academy of Social Sciences; Xi’an Chang’an Site Protection Center of Sui and Tang Dynasties; Xi’an World Heritage Monitoring and Management Center. Archaeological Data of Chang’an City Site in Sui and Tang Dynasties; Cultural Relics Publishing House: Beijing, China, 2017.
More
Information
Subjects:
Architecture And Design; Archaeology
Contributors
MDPI registered users' name will be linked to their SciProfiles pages. To register with us, please refer to https://encyclopedia.pub/register
:
View Times:
1.2K
Entry Collection:
Remote Sensing Data Fusion
Revisions:
3 times
(View History)
Update Date:
15 Jun 2023
Table of Contents


Notice
You are not a member of the advisory board for this topic. If you want to update advisory board member profile, please contact office@encyclopedia.pub.
OK
Confirm
Only members of the Encyclopedia advisory board for this topic are allowed to note entries. Would you like to become an advisory board member of the Encyclopedia?
Yes
No
${ textCharacter }/${ maxCharacter }
Submit
Cancel
Back
Comments
${ item }
|
${ item.createdUser.fullName }
${ item.createdAt }
${ item.vote }
${ item.reply }
Delete
${ reply.createdUser.fullName }
${ reply.createdAt }
${ reply.vote }
Delete
There is no reply to this comment~
${ item.replyTextCharacter }/${ item.replyMaxCharacter }
Submit
Cancel
More
No more~
There is no comment~
${ textCharacter }/${ maxCharacter }
Submit
Cancel
${ selectedItem.replyTextCharacter }/${ selectedItem.replyMaxCharacter }
Submit
Cancel
Confirm
Are you sure to Delete?
Yes
No