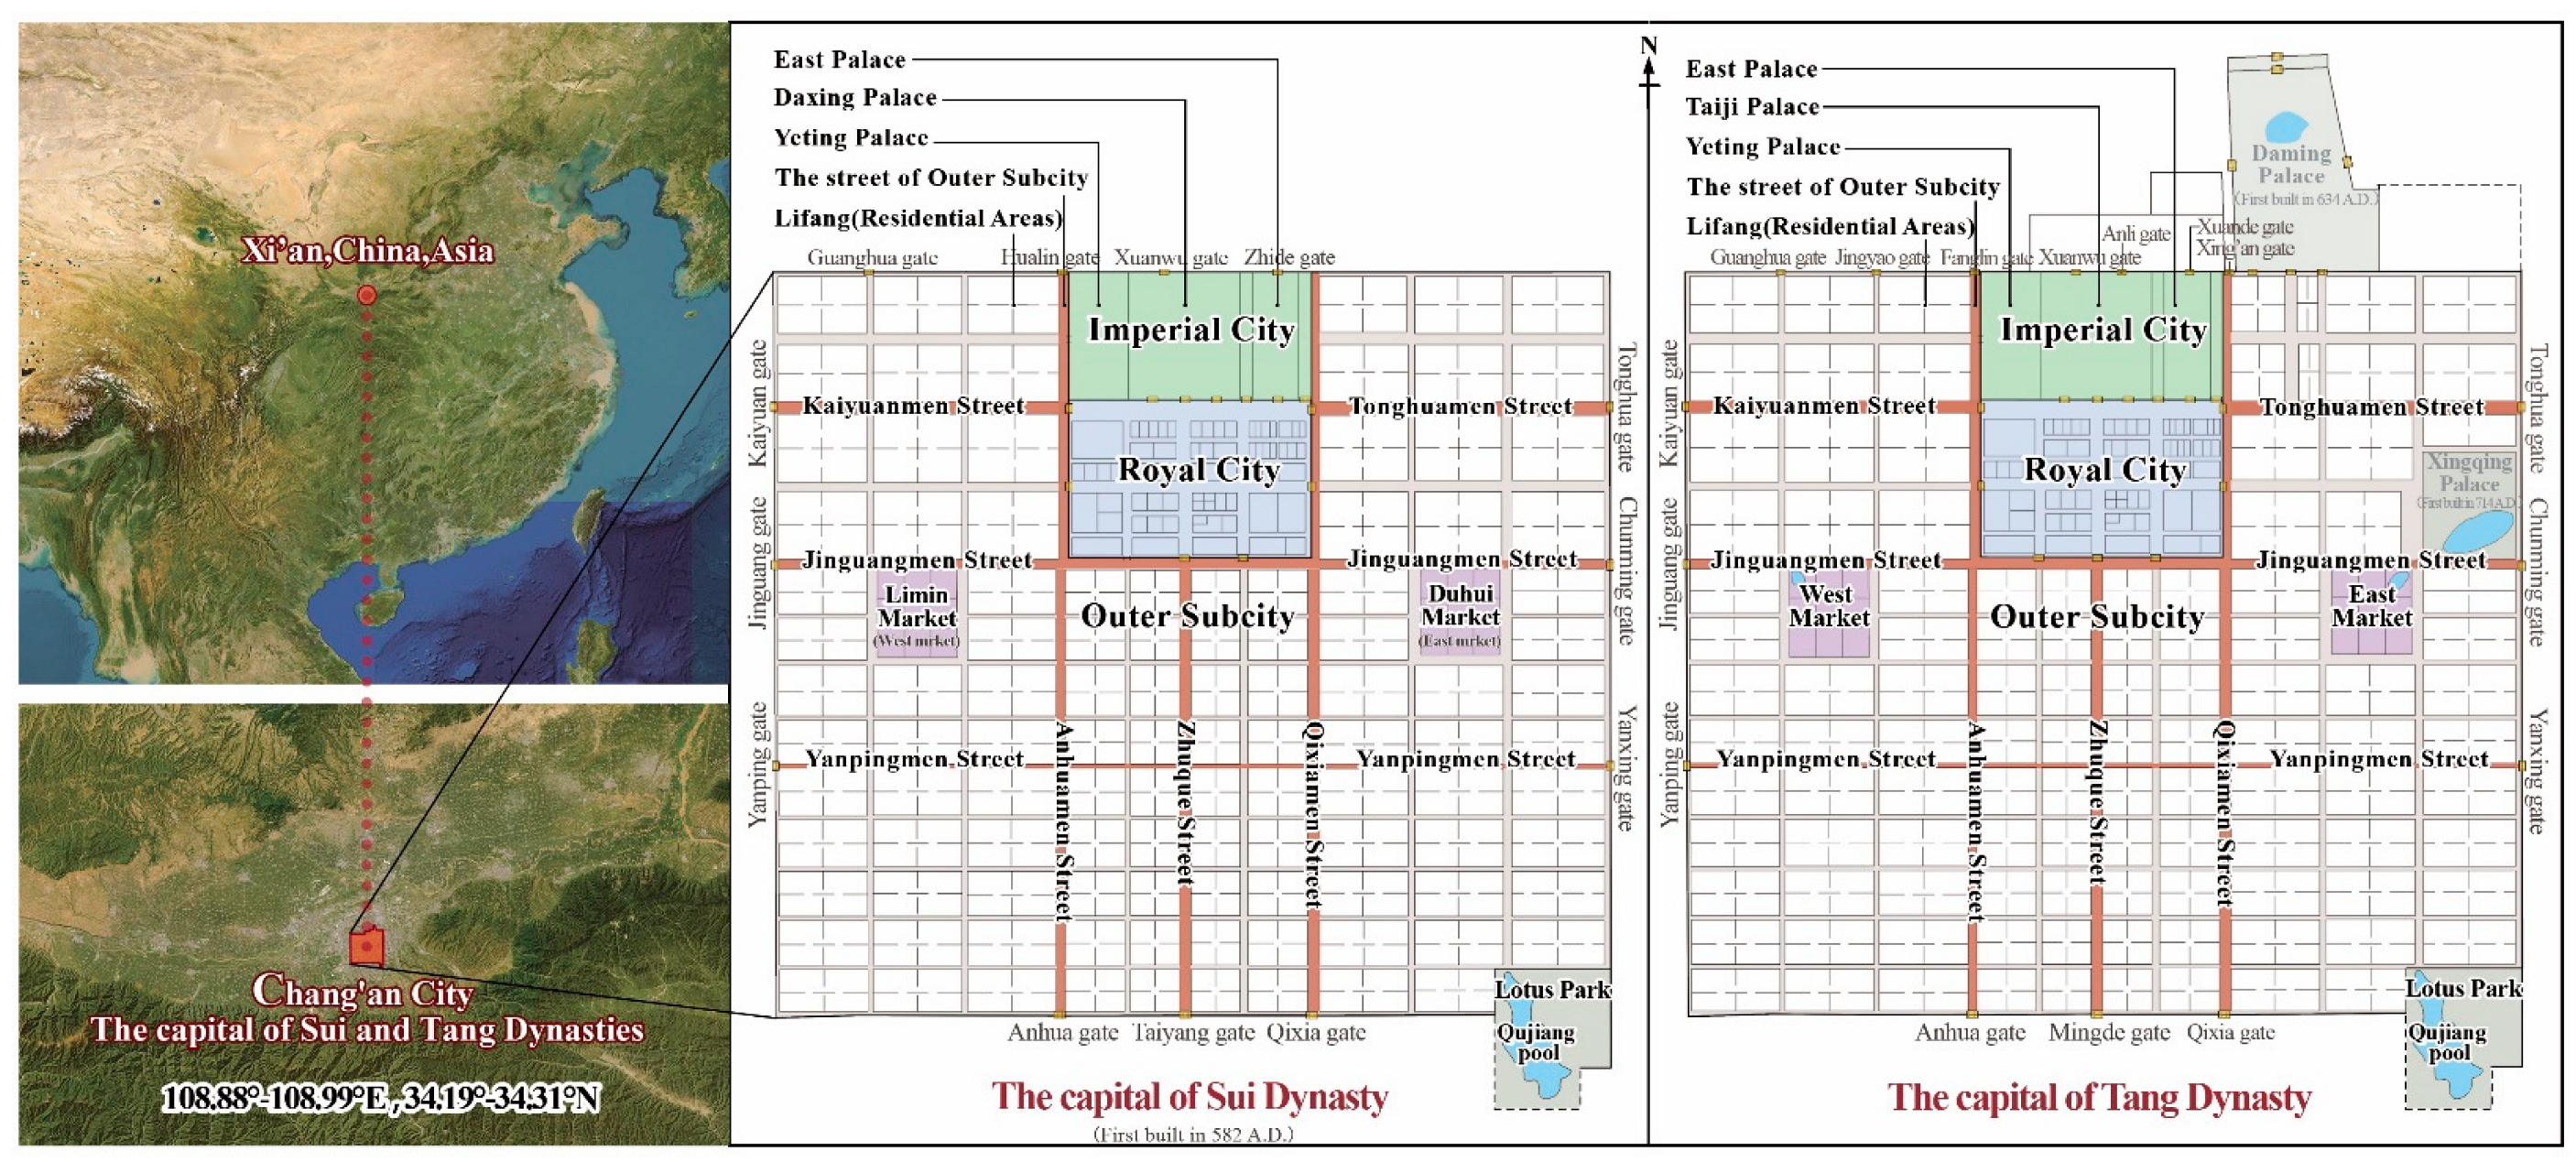
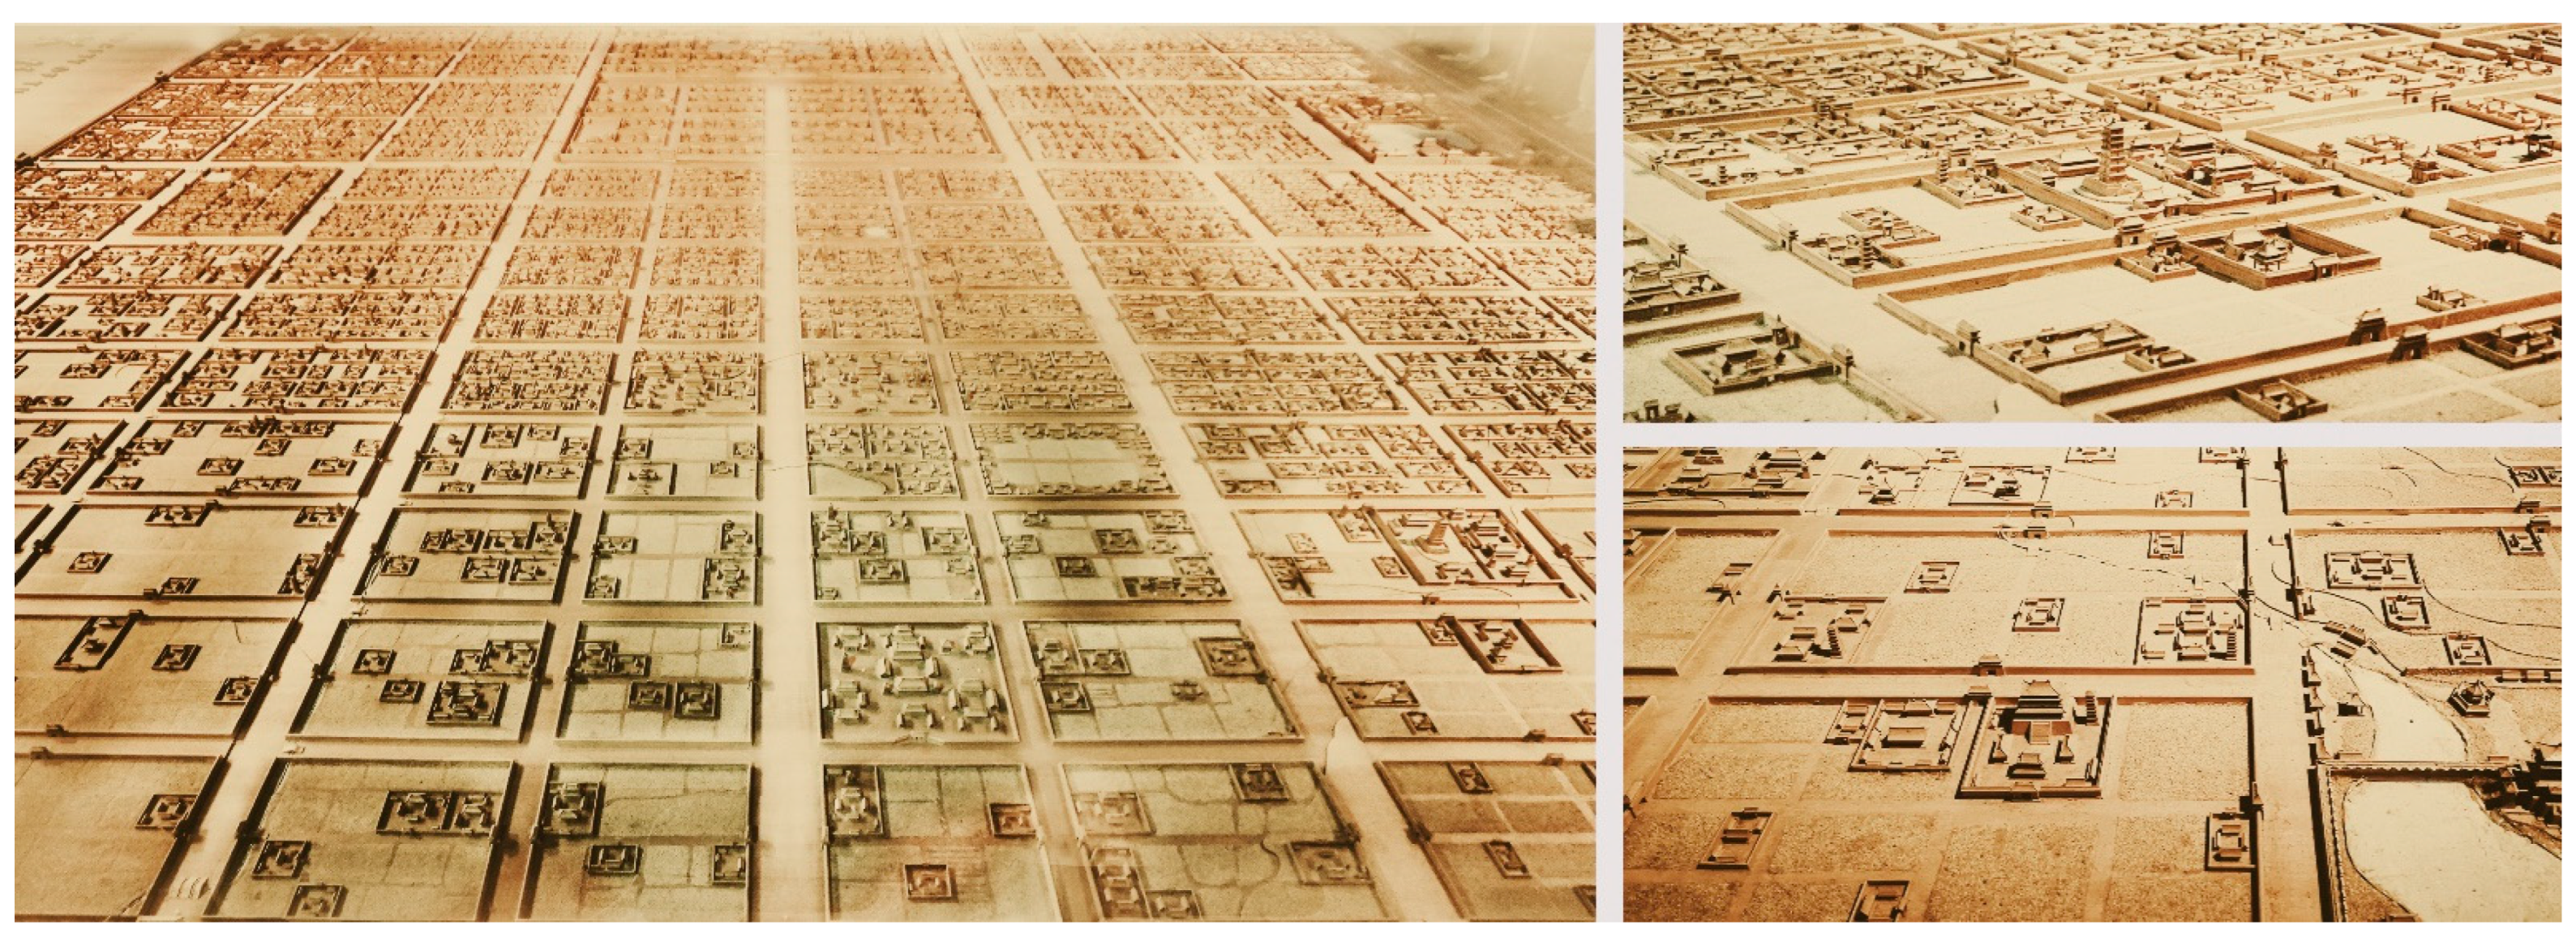
As ancient cities are spaces that represent the development of civilization, it is worth exploring and studying their characteristics and conceptions of land use. The city plan was calibrated with the help of satellite remote sensing images and sites. By constructing the “urban element area acquisition and analysis model”, various operations for areas in the city plan were realized, including an area value calculation, land use structure calculation, area modulus analysis, area ratio analysis between areas, and determination of the cultural significance of numbers and ratios. Taking the Sui and Tang dynasties capital city of Chang'an as an example, it will be described in detail below.
- GIS
- geographic information system
- ancient urban land use
- Chang’an City of the Sui and Tang Dynasties
1. Introduction
1.1. The Extraction and Quantitative Analysis of Data on Ancient Urban Land Use
1.2. The Intelligent Exploration and Interpretation of Planning Ideas Based on Land Use Characteristics
2. Characteristics and Ideas of Ancient Urban Land-Use Based on GIS
Chang’an City of the Sui and Tang Dynasties


This entry is adapted from the peer-reviewed paper 10.3390/rs15122962
References
- Donati, J.C. The Identification of Land Divisions in the Ancient Mediterranean through Integrated Remote Sensing and GIS Applications; LAC2014 Proceedings; Vrije Universiteit Amsterdam: Amsterdam, The Netherlands, 2020.
- Hammer, E.; Stone, E.; McMahon, A. The structure and hydrology of the early dynastic city of lagash (tell al-hiba) from satellite and aerial images. Iraq 2022, 84, 103–127.
- Xin, L.; Chen, B.; Guo, Y. Preliminary Report in 2022 excavation of the northeastern corner double-walled city and the Shiwangzhai site. Relics Mus. 2023, 1, 3–9.
- Maier, J. Rome Measured and Imagined: Early Modern Maps of the Eternal City; University of Chicago Press: Chicago, IL, USA, 2015.
- Baker, H.D. Urban form in the first millennium BC. In The Babylonian World; Gwendolyn Leick; Routledge: New York, NY, USA; London, UK, 2009; pp. 66–77.
- Bachagha, N.; Wang, X.; Luo, L.; Li, L.; Khatteli, H.; Lasaponara, R. Remote sensing and GIS techniques for reconstructing the military fort system on the Roman boundary (Tunisian section) and identifying archaeological sites. Remote Sens. Environ. 2020, 236, 111418.
- Wang, S.S. The structure of ancient Chinese urban construction land from Hejin and Hancheng. J. Xi’an Univ. Archit. Technol. Nat. Sci. Ed. 2009, 3, 391–396.
- Li, X.X.; Wang, S.S.; Wang, L. The Change of Urban Functions from the Evolution of Construction Land Structure: Taking Chengcheng County in Shaanxi Province as an Example. Mod. Urban Stud. 2016, 10, 53–60.
- Wang, X.K. Space Research on Ancient City of Guangfu Based on Spatial Syntax. Master’s Thesis, Hebei University of Engineering, Handan, China, 2020.
- Jiang, J.L.; Xu, X.Y.; Sun, D.Q.; Li, Y. Research on Spatial Evolution of Ancient City of Guangzhou in Modern Times Based on Improved Space Syntax. Areal Res. Dev. 2018, 37, 54–59.
- Wang, J.F.; Guo, J.P.; Yuan, Y. Spatial Morphological Analysis and Landscape Design of Ancient City: A Case Study of Taigu Ancient City Space. J. Agron. 2016, 6, 60–67.
- Zou, L.L.; Wang, J.Y. Analysis of Spatial Structure of Old Town Land Based on Spatial Syntax: A Case Study of Quanzhou Ancient City. China Land Sci. 2016, 30, 63–70.
- Kang, D. Inside and Outside of the Silla Capital: An Analysis of Urban Spatial Structure Using GIS. J. Korean Bus. Exam. 2020, 108, 61–92.
- Silvestru, C.; Wien, T. The late medieval street layout of Vienna: Digital 2D reconstruction and Space Syntax analysis of the public space. In Proceedings of the 2013 Digital Heritage International Congress (Digital Heritage), Marseille, France, 28 October–1 November 2013.
- Yin, L.; Wang, T.; Adeyeye, K. A Comparative Study of Urban Spatial Characteristics of the Capitals of Tang and Song Dynasties Based on Space Syntax. Urban Sci. 2021, 2, 34.
- Abdelhalim, A.; Ammar, M. Spatial configuration analysis via digital tools of the archeological Roman town Timgad, Algeria. Mediterr. Archaeol. Archaeom. 2021, 21, 71–84.
- Garau, C.; Annunziata, A.; Claudia, Y. Investigating the socio-spatial logic of historic urban areas through space syntax: A comparative analysis of the Roman towns Cosa, Nora, Timgad and Thuburbo Majus. TEMA 2023, 16, 201–219.
- Bill, H.; Julienne, H. The Social Logic of Space; Cambridge University Press: Cambridge, UK, 1989.
- Hillier, B. Cities as movement economies. In Intelligent Environments; North-Holland: Amsterdam, The Netherlands, 1997; Volume 1, pp. 295–344.
- Yang, C. Research on the composition and scale of urban land-use in Yuandu based on ArcGIS. Beijing Hist. 2019, 2, 119–140.
- Su, Y. Study on the Urban Functional Structure and Land-Use Scale of Xi’an in the Ming and Qing Dynasties. Master’s Thesis, Xi’an University of Architecture and Technology, Xi’an, China, 2015.
- Lin, Y.N.; Jin, X.B.; Yang, X.H.; Long, Y.; Guo, B.B.; Han, J.; Zhou, Y.K. Data set establishment and spatial reconstruction of built-up area in the Mid Qing Dynasty: Method and case study. Geogr. Res. 2015, 12, 2329–2342.
- Jin, X.; Pan, Q.; Yang, X.; Bai, Q.; Zhou, Y. Reconstructing the historical spatial land-use pattern for Jiangsu Province in mid-Qing Dynasty. J. Geogr. Sci. 2016, 26, 1689–1706.
- He, F.; Ge, Q.; Zheng, J.J. Reckoning the areas of urban land-use and their comparison in the Qing Dynasty in China. Acta Geogr. Sin. Chin. Ed. 2002, 57, 709–716.
- Ai, W.; Zhuang, D.F.; Liu, Y.Z. Analysis of 100-year changes in urban land-use in Beijing. Geo-Inf. Sci. 2008, 4, 489–494.
- Palladio, A. The Four Books of Architecture; Dover Publications Inc.: Mineola, NY, USA, 1968.
- Spiro, K. The City Shaped: Urban Patterns and Meanings Through History; Thames & Hudson Press: London, UK, 1999.
- Wang, N. A Study on the Composition Proportion of Ancient Chinese Capitals, Architectural Complexes and Individual Buildings; China City Publishing House, China Architecture & Building Press: Beijing, China, 2018.
- Fu, X.N. A discussion of the planning techniques of Luoyang City in Chang’an, Sui and Tang Dynasties. Cult. Relics 1995, 3, 48–63.
- Wang, S.S. An analysis of the planning techniques of Chang’an City in the Sui and Tang Dynasties. Urban Plan. 2009, 33, 55–58.
- Peixoto, R.F.; Florenzano, M.B.B. A Gulliverian orthogonal planning: A modular reading of Classical Thourioi. UFF Hist. Dep. Time Rev. 2021, 1, 1–27.
- Park, E.; Shaikh, J.M. A Blockchain Model (BCM) study of the Syntactic and Semantic grid in Urban History and its origin from the Indus Script Pictorial Form. South. J. Res. 2023, 3, 28–37.
- Institute of Archaeology of Chinese Academy of Social Sciences; Xi’an Chang’an Site Protection Center of Sui and Tang Dynasties; Xi’an World Heritage Monitoring and Management Center. Archaeological Data of Chang’an City Site in Sui and Tang Dynasties; Cultural Relics Publishing House: Beijing, China, 2017.
