Your browser does not fully support modern features. Please upgrade for a smoother experience.
Submitted Successfully!
 +1 credit
Thank you for your contribution! You can also upload a video entry or images related to this topic.
For video creation, please contact our Academic Video Service.
| Version | Summary | Created by | Modification | Content Size | Created at | Operation |
|---|---|---|---|---|---|---|
| 1 | Young Chang | -- | 5079 | 2023-01-05 15:34:07 | | | |
| 2 | Catherine Yang | Meta information modification | 5079 | 2023-01-06 02:22:41 | | |
Video Upload Options
We provide professional Academic Video Service to translate complex research into visually appealing presentations. Would you like to try it?
Cite
If you have any further questions, please contact Encyclopedia Editorial Office.
Shin, J.; Mahmud, M.S.; Rehman, T.U.; Ravichandran, P.; Heung, B.; Chang, Y.K. Machine Vision Techniques in Agriculture. Encyclopedia. Available online: https://encyclopedia.pub/entry/39803 (accessed on 21 July 2026).
Shin J, Mahmud MS, Rehman TU, Ravichandran P, Heung B, Chang YK. Machine Vision Techniques in Agriculture. Encyclopedia. Available at: https://encyclopedia.pub/entry/39803. Accessed July 21, 2026.
Shin, Jaemyung, Md. Sultan Mahmud, Tanzeel U. Rehman, Prabahar Ravichandran, Brandon Heung, Young K. Chang. "Machine Vision Techniques in Agriculture" Encyclopedia, https://encyclopedia.pub/entry/39803 (accessed July 21, 2026).
Shin, J., Mahmud, M.S., Rehman, T.U., Ravichandran, P., Heung, B., & Chang, Y.K. (2023, January 05). Machine Vision Techniques in Agriculture. In Encyclopedia. https://encyclopedia.pub/entry/39803
Shin, Jaemyung, et al. "Machine Vision Techniques in Agriculture." Encyclopedia. Web. 05 January, 2023.
Copy Citation
Introducing machine vision-based automation to the agricultural sector is essential to meet the food demand of a rapidly growing population. Furthermore, extensive labor and time are required in agriculture; hence, agriculture automation is a major concern and an emerging subject. Machine vision-based automation can improve productivity and quality by reducing errors and adding flexibility to the work process. Primarily, machine vision technology has been used to develop crop production systems by detecting stresses and diseases more efficiently.
stress
disease
machine vision
machine learning
image processing
1. Detection of Stresses
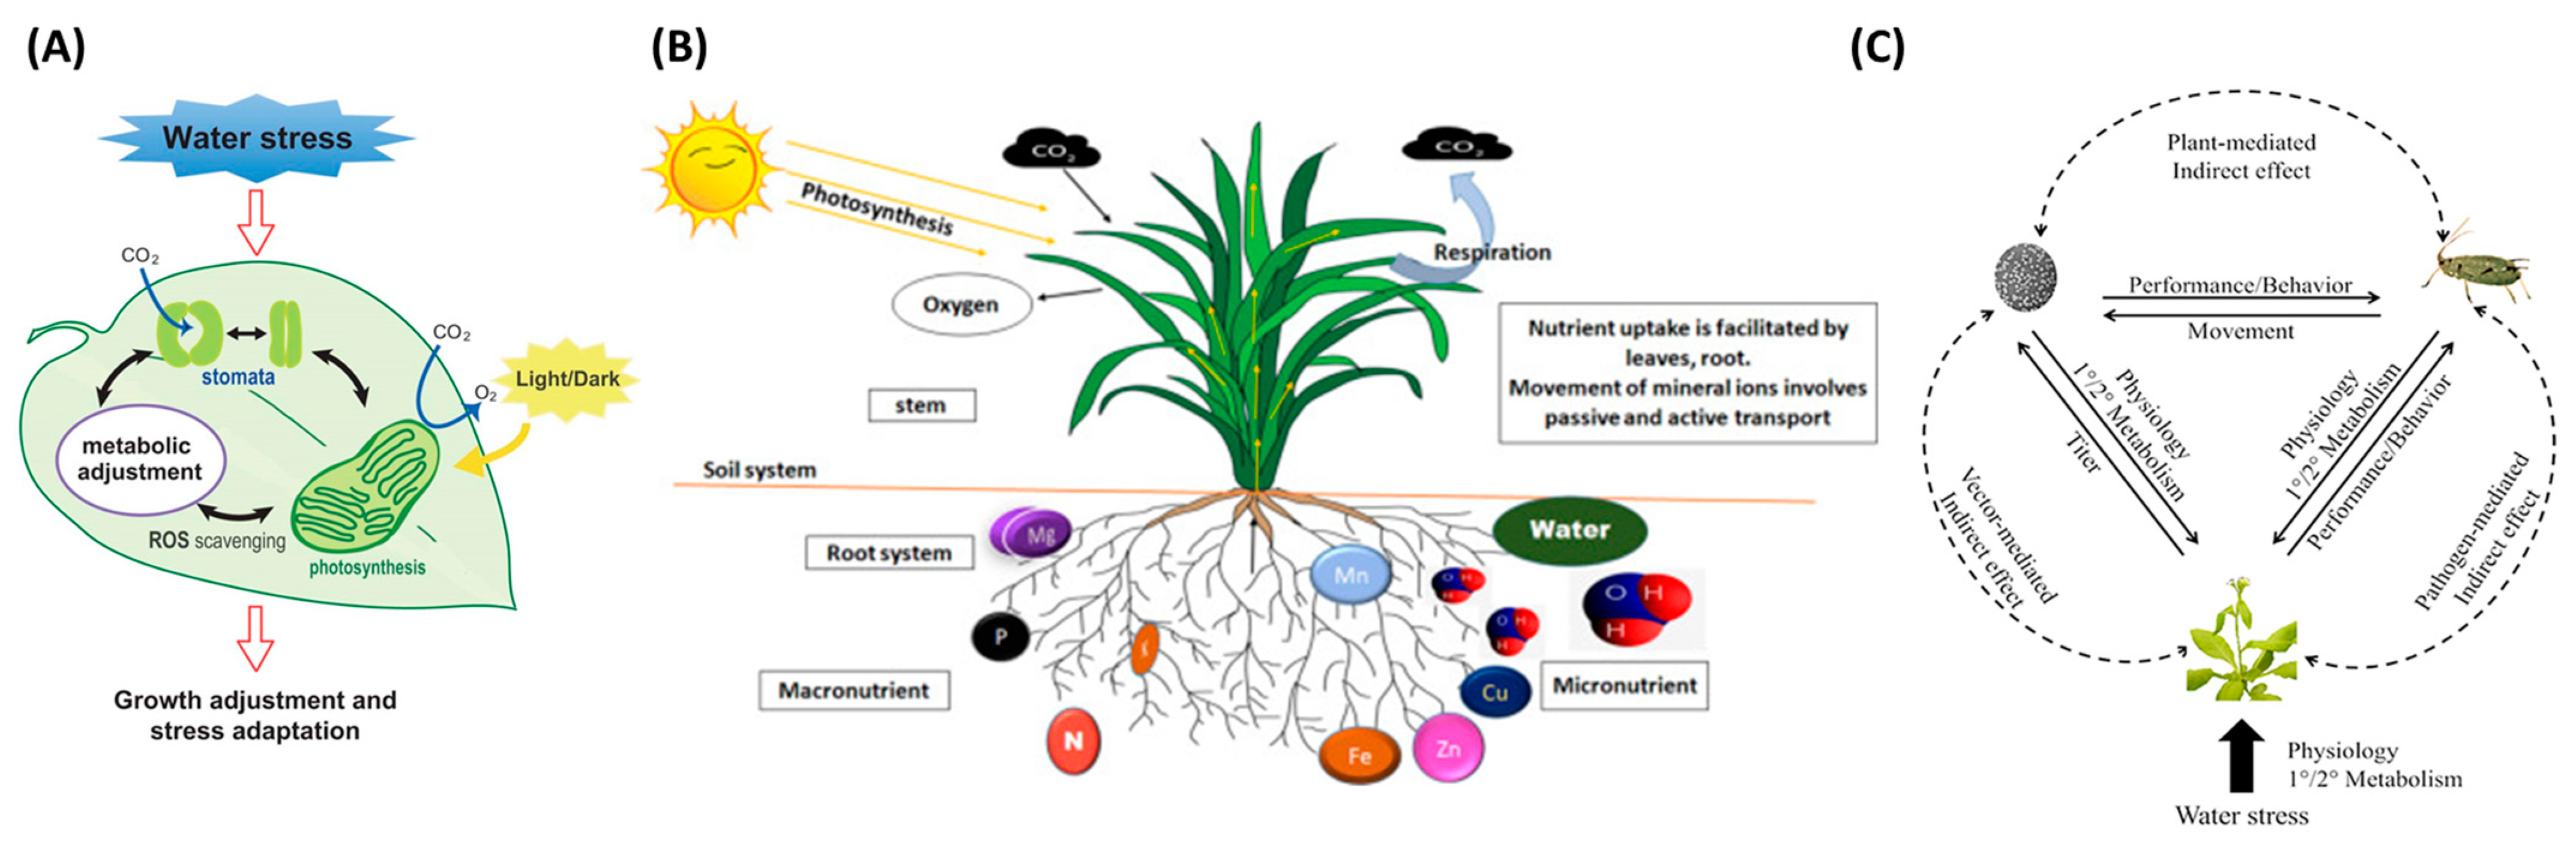
Crop stresses are significant constraints caused by biotic or abiotic factors that inauspiciously affect plant growth. When plants are stressed, different physiological symptoms may emerge; for example, water stress changes leaf color and limits water availability, thereby leading to stomata’s closing and impediment of photosynthesis and transpiration [1]. Figure 1 shows the representative stress types that can be occurred in plants. In Figure 1A, water stress is caused by a decrease in leaf water potential and stomatal heat, which leads to the down regulation in the availability of CO2, and is one of the main factors of excess light stress. Plant stomata change due to water stress, and metabolic changes occur. Plant roots absorb mineral elements from the soil; hence, Figure 1B demonstrates how mineral ions are absorbed and transported in the root system. Figure 1C shows direct and indirect interactions between insect vectors, pathogen-stressed plants, and hosts. The dotted line represents the indirect effect, and the solid line represents the direct effect.
Machine vision applications have been widely utilized for detecting plant stress, such as water stress [5][6][7], nutrient deficiency [8], and pest stress [9][10]. The mechanism of machine vision is to use a camera (sensors) to capture visual information, and then a combination of hardware and software processes the image the extracts the necessary data. Therefore, it is widely used in applications such as presence inspection, positioning, identification, defect detection, and measurement. Foucher et al. [11] measured plant stress using a perceptron with one hidden layer and imaging technique. The authors classified the pixels into a binary image (i.e., the plant in black and the background in white) to measure the shape parameters and defined the plant stress by characterizing the moment invariant, fractal dimension, and the average length of terminal branches. Chung et al. [12] evaluated a commercial smartphone to monitor vegetation health and stress rather than a near-infrared spectroscopy (NIR) spectrophotometer or a NIR camera, which was too costly. Ghosal et al. [13] demonstrated that a deep machine vision framework efficiently identified and classified the diverse stresses in soybean. With large datasets, the highest accuracy was 94.13% based on the confusion matrix, and the study’s outcomes could be used to detect plant stress in real-time on mobile applications. Elvanidi et al. [14] performed an ML technique with a hyperspectral sensor to provide remote visual data related to plant water and nitrogen deficit stress and achieved a classification accuracy of 91.4% when evaluated against an independent test dataset. Machine vision applications to detect stress on various targets, such as fruits, vegetables, pests, and plants summarized based on the alphabetical order of the target name (Table 1). The list includes information ranging from image processing technologies to recently emerging DL technologies. Water stress, nutrient deficiency, and pest stress are explored in order later in this Table.
Table 1. Application of machine vision for stress detection in crops.
| Target | Techniques | Results | References |
|---|---|---|---|
| Apple | Hyperspectral imaging with spectral signature measurement of leaf surfaces | Red edge normalized difference vegetation index (NDVI) at 705–750 nm and NDVI at 680–800 nm showed the highest correlation with water stress | Kim et al., 2011 [7] |
| Corn and soybeans | Drought stress using a pretrained DenseNet-12 model | Predicted drought/water responses with an accuracy of 88% | Ramos-Giraldo et al., 2020 [15] |
| Forsythia | Shape analysis with moment invariant, fractal dimension, and skeleton measures | Measured water stress and other stresses, such as thermal, mechanical, and mineral deficiency stress | Foucher et al., 2004 [11] |
| Lettuce | grey-level co-occurrence matrix (GLCM) texture, hue-saturation-luminance color, and top-projected canopy area (TPCA) morphological features analysis | TPCA and three textural parameters showed a good relationship with calcium deficiency (R2 = 0.97) | Story et al., 2010 [16] |
| Lettuce | Color, texture, and morphological features analysis | Combined computer vision (CV) and spectroscopy techniques showed a higher accuracy of 88.64% for nitrogen | Mao et al., 2015 [17] |
| Maize | Features extraction using red, green, and blue (RGB), hue-saturation-intensity (HSI), and chromaticity coordinate transformations | HSI detected color variations in both water and nitrogen levels ahead of RGB and chromaticity coordinates | Ahmad & Reid, 1996 [18] |
| Maize | Image segmentation using E_G = 2G-R-BR+G+B | The algorithm had a 94.72% accuracy for the presence of fall armyworm on plant | Sena Jr. et al., 2003 [9] |
| Maize | Deep convolutional neural network for classifying drought stress | Accuracies of the identification and classification of drought stress were 98.14% and 95.95%, respectively | An et al., 2019 [19] |
| Maize, okra, and soybean | AlexNet, GoogLeNet, and Inception V3 were used to identify water stress | GoogLeNet was at 98.3%, 97.5%, and 94.1% accuracy for maize, okra, and soybean, respectively | Chandel et al., 2020 [20] |
| New Guinea impatiens | Image segmentation and feature extraction using TPCA with grey images | Plant water stress detection was feasible with a 100% success rate using plant movement | Kacira et al., 2002 [5] |
| Pest | VGG 16, VGG 19, ResNet, and Inception-V3 were used to detect Tuba absoluta | The Inception-V3 reported the highest accuracy of 87.2% in estimating the severity of the pest in tomato | Rubanga et al., 2020 [21] |
| Plants leaves | Near-infrared spectroscopy reflectance and the red reflectance using an inexpensive high pass filter at 800 nm to a smartphone camera | A strong linear correlation with R2 = 0.948, corroborating the smartphone’s ability in evaluating NDVI associated with water stress | Chung et al., 2018 [12] |
| Plant leaves | ResNet-50, logistic regression, support vector machine, and multilayer perceptron | Multilayer perceptron showed the best performance with accuracy of 88.33% for nutrient deficiency | Han & Watchareeruetai, 2020 [22] |
| Plant stress | top-K high-resolution feature maps that isolate the visual symptoms | The deep convolutional neural network model built performed well with visual symptoms of chemical injury and nutrient deficiency | Ghosal et al., 2018 [13] |
| Plant stress | C-Drop neural networks were used to predict water stress. | C-Drop neural networks increased the accuracy of water stress prediction by 21% | Wakamori et al., 2020 [23] |
| Rice | Color, shape, and texture features analysis | Accuracy of 100% was achieved for six pest extraction and classification | Shariff et al., 2006 [24] |
| Strawberry | RGB and infrared image information was fused and used for auto-detection of the crop area temperature | R2 between area Crop Water Stress Index and three strawberry groups were 0.8834, 0.8730 and 0.8851, respectively | Li et al., 2019 [25] |
| Sugar beet | Canopy cover, height, hyperspectral reflectance, and vegetation indices were used as the benchmark | Mean cross-validation accuracies were 93%, 76%, and 83% for drought, nitrogen, and weed stress severity classification, respectively. | Khanna et al., 2019 [26] |
| Sunagoke moss | CCM and GLCM texture analysis for 90 textural features with 3 morphological features | The n-ACO algorithm performed better with the lowest mean squared error of 0.00175 for water content determination. | Hendrawan & Murase, 2011 [27] |
| Tomato | CV-based image analysis tracks the vertical movement of leaf tips of plants | Tomato plants have linear vertical motions in response to both water stress levels and carbon dioxide | Seginer et al., 1992 [28] |
| Tomato | Color and shape analysis of images with a charged coupled device camera. | 83.1% of the white flies were correctly classified. | Bauch & Rath, 2004 [10] |
| Tomato | The classification Tree model was used to group complex hyperspectral datasets to provide remote visual results | The combination of modified soil adjusted vegetation index, mrNDVI, and photochemical reflectance index determine water and nitrogen deficit stress with 91.4% classification accuracy values for the testing samples | Elvanidi et al., 2018 [14] |
| Tomato | Convolutional neural networks were used to detect nutrient deficiencies based on nitrogen, phosphorus, and potassium | Developed automated nutrition monitoring system for tomato crops achieved an accuracy of 86.57% | Cevallos et al., 2020 [29] |
1.1. Water Stress
Several studies have detected water stress using the movement of the plants and texture analysis. For example, Seginer et al. [28] used a machine vision system to track the vertical movement of leaf tips of four plants simultaneously for tomato plants. The results showed that the growing leaves had complex orientations, which were less useful for monitoring water stress levels, but fully expanded leaves were found to have linear vertical motions in response to the water stress level. Kacira et al. [5] used a machine vision technique for early and non-invasive detection of plant water stress using features derived from the top-projected canopy area (TPCA) of plants. The TPCA provides information about plant movement and canopy expansion. Although the use of projected canopy area-based features for detecting plant water stress was shown to be effective in the study, further research is needed to develop an earlier water stress detection system, which could be applied to a greater array of plants and their varieties. Ondimu and Murase [6] used color co-occurrence matrix (CCM), and grey-level co-occurrence matrix (GLCM) approaches to detect water stress in Sunagoka moss under natural growth environments. Six texture features were extracted, and multilayer perceptron neural network models were used to predict water stress in the study. The authors found that CCM texture features performed better than GLCM texture features and the features extracted from hue-saturation-intensity (HSI) color space was more effective and reliable in detecting water stress.
Few studies have detected water stress using optimization methods. For example, Hendrawan and Murase [27] determined water content by using bio-inspired algorithms to predict the water content of Sunagoke moss. Here, neural-discrete particle swarm optimization, neural-genetic algorithms, neural-ant colony optimization, and neural-simulated annealing algorithms were compared in their ability to identify the most important image features. The experimental outcome was obtained from the image features analysis, which consisted of eight colors, ninety textures, and three morphological features—the results showed that the neural-ant colony optimization algorithm was the most effective. The framework developed by Hendrawan and Murase [27] was useful as the symptoms of water stress vary from plant to plant, and it is challenging to identify the optimal feature set.
Multiple studies have detected water stress using DL; for example, An et al. [19] discovered that water stress influenced crop yield. They implemented convolutional neural networks (CNNs) to classify and identify water stress on maize to address the problem and demonstrated the DL-based approach was very promising. The ability of their approach towards identifying and classifying water stress had an accuracy of 98.14% and 95.95%, respectively. Ramos-Giraldo et al. [15] developed a machine vision system that measures water stress in corn and soybeans. Here, a transfer learning technique and a model based on DenseNet-12 were used to predict the drought responses with an image classification accuracy of 88%. Chandel et al. [20] used AlexNet, GoogLeNet, and Inception V3 to identify water stress on maize, okra, and soybean. The DL models were tested by collecting 1200 images of each crop, whereby the performance of GoogLeNet was found to be the best, with accuracy rates of 98.3%, 97.5%, and 94.1% for maize, okra, and soybean, respectively.
Multiple studies have used water stress detection for water management. Wakamori et al. [23] increased the precision of the estimation of the water stress and irrigation performance for high-quality fruit production. They used a multimodal neural network with a clustering-based drop to estimate the plant water stress. The proposed method improved the accuracy of water stress estimation by 21% and facilitated continuous fruit production by new farmers. Li et al. [25] stated that information on water stress is crucial to planning the irrigation schedule. They suggested an automated monitoring system of the water stress status for strawberries by combining red, green, and blue (RGB) and an infrared image. The single-point crop water stress index (CWSI) and area of CWSI were calculated, and their suitability as an indicator for the automatic diagnosis of plant stress was evaluated. The results showed that the area of CWSI was stable to use as a standard because the determination coefficient between the area CWSI and matching stomatal conductance were 0.8834, 0.8730, and 0.8851, which were greater than the results from using only the CWSI. Nhamo et al. [30] suggested that unmanned aerial vehicles improve agricultural water management and increase crop productivity. This research elucidates the role of unmanned aerial vehicles-derived normalized difference vegetation index in evaluating crop health as influenced by water stress and evapotranspiration.
Khanna et al. [26] focused on detecting the factors of stress and their combinations in crop production and curing them. They reconstructed a three-dimensional image of the plants to use as a benchmark and estimated the water, nitrogen, and weed stresses by using plant trait indicators. Mean cross-validation accuracies are 93%, 76%, and 83% for water, nitrogen, and weed stress severity, respectively.
1.2. Nutrient Deficiency
The nutrient can be classified as follows: water, proteins, vitamins, minerals, and bioactive substances such as antioxidants. In agriculture, minerals can be applied to the soil as fertilizers. The nutrient deficiency symptoms are mainly exhibited by the leaves via changes in color and texture [5]. Additionally, the symptoms of nutrient deficiency include the death of plant tissue, stunted growth, or yellowing of leaves due to reduced production of chlorophyll, which is required for photosynthesis.
Soils must have appropriate nitrogen, phosphorus, potassium, and other minerals. With the introduction of ML technologies, neural networks can figure out the soil composition and help farmers predict the quality of crop outcomes. Koley [31] used supervised ML and backpropagation neural networks to analyze organic matters, essential plant nutrients, and micronutrients that affect crop growth and significant components of soil and uncovered the relationship between these characteristics. Hetzroni et al. [32] revealed that plant nutrient deficiency of iron, zinc, and nitrogen, is characterized by plant size, color, and spectral features of individual lettuce plants. After collecting the images through image segmentation, the neural networks and statistical classifiers were used to determine the plant condition. Ahmad and Reid [18] detected color variations in stressed maize crops by measuring the variability of water and nitrogen levels. The authors evaluated the sensitivity of a machine vision system by comparing RGB, HSI, and chromaticity RGB coordinates color representations. The experimental results showed that the HSI color space could detect color variations more effectively than the RGB and chromaticity RGB coordinates. Mao et al. [33] recognized the deficiency of nitrogen and potassium in tomatoes by extracting their characteristics and features. The extracted features were combined and optimized to design the identifying system. Story et al. [16] developed a machine vision system to detect calcium deficiency in lettuce and were able to autonomously extract morphological, textual, and temporal characteristics of the plant.
Multiple studies have detected nutrient stress using combined image features and several different ML techniques. Xu et al. [8] analyzed the color and texture of tomato leaves to diagnose nutrient deficiency. A genetic algorithm was used to select features and obtain the most useful information from leaves for diagnosing deficiencies. Mao et al. [17] accurately predicted the nitrogen content of lettuce with 73 spectral data extracted using multiple sensors and by integrating spectroscopy and computer vision using an extreme learning machine model to measure the nitrogen content. Rangel et al. [34] used a machine vision system to diagnose and classify grapevine leaves with potassium deficiencies. Their results suggested that the k-nearest neighbors algorithm was more effective than a histogram-based method, especially with less controlled environment conditions (e.g., shadow).
Recently, multiple studies have detected nutrient stress using DL. Li et al. [35] reviewed the advantages and disadvantages of machine vision technology with non-destructive optical to monitor the nitrogen status of crops. Cevallos et al. [29] used CNN to detect nutrient deficiencies in tomato crops. They mainly focused on detecting nutrients, such as nitrogen, phosphorus, and potassium, and developed an automated nutrition monitoring system for tomatoes, achieving an accuracy of 86.57%. However, to increase robustness and accuracy, they collected more training data and made additional efforts to optimize lighting conditions. Han and Watchareeruetai [22] extracted features using ResNet-50 for six types of undernourished leaves, including old and young leaves, and calibrated logistic regression, support vector machines, and multilayer perceptron models. Among them, multilayer perceptron outperformed the other two methods with an accuracy of 88.33%.
1.3. Pest Stress
In addition to water and nutrient stress, pest stress is a significant concern for crop cultivation. Recently, machine vision applications have become more efficient in recognizing pest stress in agriculture. For example, Bauch and Rath [10] analyzed digital images of the plant to measure the density of an entomological pest and whiteflies using machine vision. Their study showed that the developed machine vision system could classify the captured objects into white flies. Similarly, Sena Jr. et al. [9] developed a machine vision algorithm for identifying the damage in maize plants from fall armyworm (Spodoptera frugiperda) pest damage using digital images. The original RGB images were transformed into index monochromatic images using the normalized excessive green index for experimentation and using the E_G = 2G-R-BR+G+B equation. The outcomes showed that the algorithm could perform with a classification accuracy of 94.72% using damaged and non-damaged maize plant images. Shariff et al. [24] used a digital image analysis algorithm based on fuzzy logic with digital values of color, shape, and texture features to identify pests in a paddy field where six types of pests were successfully categorized and detected. Boissard et al. [36] applied a cognitive machine vision technology to detect and count the whitefly at a mature stage of greenhouse crops. The image-processing algorithm was used with fine-tuned parameters and descriptor ranges for all relevant numerical descriptors for these applications. However, the outcomes of the study did not provide a satisfactory result because of the high false classification rate, which leads to erroneous pest density quantification. Muppala and Guruviah [37] detected the pest traps in the field using RGB images and summarized the machine vision technologies not only for pests but also for diseases and weeds detection. Rubanga et al. [21] used four pre-trained architectures (i.e., VGG 16, VGG 19, ResNet, and Inception-V3) to prevent and control Tuba absoluta, which causes 80 to 100 % cultivation loss problems in growing tomatoes. Among these, Inception-V3 had the highest accuracy of pest stress severity estimation.
2. Detection of Diseases
Machine vision processes and analyzes images captured from the environment and can detect disease through trained algorithms. Through this, many processes occurring in agriculture can be automated and controlled, and it is used to test the quality of the final product. There are five essential components in machine vision mechanisms. Firstly, appropriate illumination techniques (e.g., diffuse illumination, partial bright field illumination, dark field illumination, etc.) should be used to obtain important data from the sensor. Then, the image is captured through a lens and transmitted to an image sensor inside a camera. The image sensor inside a machine vision camera converts the light captured by the lens into a digital image. At this time, resolution, the number of pixels generated by the sensor, and sensitivity, the minimum quantity required to detect output change, are critical specifications for the image sensor. The machine vision system’s vision processing unit then uses algorithms to analyze the digital image produced by the sensor. It is processed with algorithms pre-programmed with ML and DL. The last is the communication system, where the decisions made by the vision processing unit are communicated to specific mechanical elements.
2.1. Disease Detection on Leaves
Plant leaf diseases have become a major challenge as they can substantially reduce the quality and quantity of horticultural crops [38]. Thus, many studies have explored the development of automated detection and classification techniques for plant leaf diseases using machine vision [39][40][41][42]. Al Bashish et al. [41] used k-means clustering and ANN image processing to cluster and classify disease-affected plant leaves, respectively. Their algorithm tested on five plant diseases (i.e., ashen mold, cottony mold, early scorch, late scorch, and tiny whiteness) and achieved a higher accuracy with ANN. The proposed technique was slower in computation and would not be appropriate for real-time application. An improvement of the methods from Al Bashish et al. [41] were made by Al-Hiary et al. [39] and achieved a 20% increase in computational efficiency. Using ANN, they developed a fast machine vision-based automatic detection system for plant leaf diseases based on images of infected plants. Although the authors successfully increased the accuracy in detection, the computation time for automatic detection was still high and remained unsuitable for real-time detection on a field scale. To further evaluate ANN approaches, Omrani et al. [43] proposed a radial basis function-based support vector regression approach, which proved to be more effective than a polynomial-based support vector regression and ANN for apple disease (i.e., black spot, apple leaf miner pest and Alternaria) detection. Arivazhagan et al. [40] identified early and late scorch and fungal diseases in beans by using texture features to detect the symptoms of the disease as quickly as they appear on plant leaves. The proposed system was developed with a software solution that extracted texture features from RGB images. Camargo and Smith [44] developed an image-processing-based algorithm for identifying disease symptoms from an analysis of color images in cotton crops. The results suggested that the I3 channel achieved an optimal pixel matching of 69.9% with the lowest level of misclassification of 8.7% than others. Chaudhary et al. [42] compared the effects of HSI, CIELAB, and YCbCr color space for disease spot segmentation in plant leaves using image processing techniques. A median filter was applied for image smoothing, and Otsu’s methods were used to calculate the threshold to find the disease spot.
Choudhary and Gulati [45] reviewed several studies that detected the scorch and spot diseases on several plant leaves, such as potatoes, using color, texture, and edge features with a combination of CCM and ANN. A k-means clustering was used for masking green pixels, which could remove the masked cells inside the boundaries of infected clusters. Kanjalkar and Lokhande [46] extracted color, size, proximity, and centroid features from leaves to detect four diseases in cotton and soybeans. The extracted features were classified using an ANN classifier and showed lower accuracy in all cases of leaf diseases. Naikwadi and Amoda [47] identified plant leaf diseases using the histogram matching technique. Histogram matching is based on edge detection technique and color texture due to the appearance of disease symptoms on leaves. Their study showed that the developed algorithm could successfully detect and classify diseases with precision between 83% and 94% [47]. Muthukannan et al. [48] proposed an ANN-based image processing technique with feed-forward neural network, learning vector quantization and radial basis function networks to assess diseased plants by processing the set of shape and texture features. Texture features were extracted from contrast, homogeneity, energy, correlation, and shape features from an area of the leaf surface. The experimental outcome revealed that the feed-forward neural network performed better with an overall detection accuracy of 90.7% in diseases that affect bean and bitter gourd leaves; however, learning vector quantization resulted in higher accuracy of 95.1% for bean leaves.
Wu et al. [49] used shape features with a probabilistic neural network to identify 32 species of Chinese plants from images of single leaves and compared the results against several other classifiers. The probabilistic neural network extracted 12 leaf features and reduced them to five principal variables, and finally, this algorithm can classify 32 plants with an accuracy of >90%. Singh and Misra [50] applied a genetic algorithm to detect plant diseases using the image segmentation process with soft computing techniques. Images were collected from banana, beans, jackfruit, lemon, mango, potato, tomato, and sapota plant species. The results showed that the support vector machine (SVM) classifier provided an accuracy of > 90% for rose, banana, lemon, and beans leaf disease classification. Kutty et al. [51] classified watermelon anthracnose and downy mildew leaf diseases using neural networks. The color features were extracted from the RGB color model, where the identified regions of interest were used to extract the RGB pixel color indices. Zhang et al. [52] carried out disease detection from images of cucumber leaves using sparse representation (SR) classification with the k-means clustering algorithm. The technique comprised a series of procedures, which included segmenting diseased leaf images by k-means clustering; extracting shape and color features from lesion information; and classifying diseased leaf images using SR. The technique was effective in identifying seven major cucumber diseases.
Recently, multiple studies have detected leaf diseases using DL. Sethy et al. [53] suggested that ResNet-50 and SVM were superior to the other 11 CNN models in classifying four kinds of rice leaf diseases. Karthik et al. [54] achieved an accuracy of 98% in detecting the three types of infection on the tomato leaves by using residual learning and a deep network. Xie et al. [55] used Faster R-CNN to detect four common leaf diseases in grapes and increased the image dataset from 4,449 to 62,286 using a data augmentation technique. Comprehensively, Jogekar and Tiwari [56] reviewed the studies that used DL techniques to identify and diagnose the disease on the plant leaves.
2.2. Diseases Detection on Fruits and Vegetables
Detecting defect affecting each fruit is critical for optimizing their market value and ensuring their quality to consumers. López-García et al. [57] detected the skin defects of citrus fruits using an algorithm combining multivariate image analysis and principal component analysis. The classification rate was acceptable, with an accuracy of 91.5%; however, the algorithm’s complexity constrained the recognition speed. Kim et al. [58] classified peel diseases in grapefruit using color co-occurrence matrix (CCM)-based color texture analysis with 39 features from HSI color space. Images were acquired from grapefruits with five common diseases: canker, copper, burn, melanosis, wind scar, and greasy spot peel conditions and normal. However, the model with 14 features achieved higher accuracy.
Qin et al. [59] applied hyperspectral images with 450-930 nm wavelengths in Ruby red grapefruit to detect citrus canker and other damages. The classification results yielded a 96% accuracy for differentiating the diseased, damaged, and healthy fruits using a spectral information divergence. Blasco et al. [60] developed a machine vision system using a region-growing segmentation algorithm. Images were taken with a Sony XC-003P camera and fluorescent tube light from mandarin fruit. The defective regions were determined and classified fruit into defective and non-defective classes. Blasco et al. [61] applied a multispectral inspection system to detect 11 types of defects in citrus. The results showed that severe defects were successfully detected in 94% of the cases, and most errors occurred due to confusion between the defects caused by medfly and oleocellosis disorder, which is caused by the presence of phytotoxic rind oils on the rind tissue.
Li et al. [62] used a hyperspectral imaging system to detect common skin defects in orange fruit. Principal component analysis was used to select the most discriminant wavelengths in the 400-1000 nm range. The results showed a better detection when using the third principal component images, which consisted of six wavelengths (630, 691, 769, 786, 810, and 875 nm) and the second principal component images, which consisted of two wavelengths (691 and 769 nm). The disadvantage of their approach was that it could not differentiate between different types of defects. In a subsequent study, Li et al. [63] combined lighting transformation and image ratio methods to detect common surface defects in oranges. Detection of defects, such as wind scarring, thrips scarring, scale infestation, dehiscent fruit, anthracnose, copper burn, and canker spot had higher accuracies. Rong et al. [64] experimented with a machine vision with segmentation algorithms to detect surface defects on oranges considering an uneven light distribution. The segmentation method was successfully performed with different surface defects, such as wind scarring, thrips scarring, insect injury, scale infestation, copper burn, canker spot, dehiscent fruit, and phytotoxicity.
Similar to evaluating citrus fruits, many studies have developed machine vision systems to detect the defects in apples via image processing techniques [65][66][67]. For example, Dubey and Jalal [68] classified diseases on apples using an image processing technique based on k-means clustering techniques for image segmentation. Color and texture features were extracted using four different techniques, such as global color histogram, color coherence vector, local binary pattern, and complete local binary pattern, to validate the accuracy and efficiency. Their study showed that their proposed technique could significantly support the accurate detection and automated classification of apple fruit diseases. Shahin et al. [66] applied neural networks to classify apples according to surface bruises, and discriminant analysis was used for selecting the salient features. Their study used line-scan X-ray imaging to examine new (1 day) and old (30 days) bruises in Golden and Red Delicious apples. They found that new bruises were not adequately separated using their methodology. Kleynen et al. [69] detected Jonagold apple defects using a correlation-based pattern-matching technique in a multispectral vision system. The results showed that 17% of defects were misclassified, and recognition rates for stems and calyxes were 91 and 92%, respectively. The authors suggested the pattern matching method has been widely applied for object recognition, but the major disadvantage is that of high dependency on the pattern used.
Machine vision is also used in the detection of blemishes on potatoes [70], tomatoes [71], and olives [72]. Barnes et al. [70] used a machine vision based accurate AdaBoost algorithm for potato defect classification. The minimalist classifiers with only ten selected features using the real AdaBoost algorithm showed detection accuracies of 89.6% and 89.5% for white and red potatoes, respectively, with less calculation requirement in the case of blemishes detection. Laykin et al. [71] used a color camera that captures images of the full view of an underlying tomato for automatic inspection. Four features were extracted: color, color homogeneity, bruise, and shape. The authors recorded different stages of tomato color development to measure the quality of the tomato. They also considered the color change of homogeneity between the harvest date and after storage. Diaz et al. [72] detected bruises and defects in olives by using a machine vision technique with three algorithms. The ANN algorithm classified olives with higher accuracy than partial least square regression and Mahalanobis algorithms. Ariana et al. [73] developed a machine vision system using near-infrared hyperspectral reflectance imaging for cucumber bruise detection. Three classification algorithms were tested, and the results showed that the band ratio and difference methods had similar performance but were better than the principal component analysis during classification. Wang et al. [74] used a liquid crystal tunable filter-based hyperspectral imaging system to detect sour skin, which is primarily a disease of onions. The experimental results suggested that the best contrast was in the spectral region of 1200-1300 nm and the sour skin infected region was darker than the healthy flesh region. In addition, the spectral range of 1400-1500 nm showed better contrast between the Vidalia sweet onion surface dry layer and fresh inner layer.
Recently, multiple studies have detected crop and vegetable diseases using DL. Elsharif et al. [75] used a deep CNN to identify four types of potatoes (red, red-washed, sweet, and white). The model’s validity was verified by obtaining an accuracy of 99.5% for the test set. Kukreja and Dhiman [76] achieved a classification accuracy of 67% in detecting normal and damaged citrus fruits using 150 original images. Subsequently, they showed a better performance of 89.1% by including data augmentation and by increasing the number of images to 1200. El-Mashharawi et al. [77] reported the potential of DL identifying the types of grapes with 4565 images and achieved 100% accuracy by using the image dataset from 30% of the validation set.
References
- Nilsson, H. Remote sensing and image analysis in plant pathology. Annu. Rev. Phytopathol. 1995, 33, 489–528.
- Osakabe, Y.; Osakabe, K.; Shinozaki, K.; Tran, L.S.P. Response of plants to water stress. Front. Plant Sci. 2014, 5, 86.
- Kumari, A.; Sharma, B.; Singh, B.N.; Hidangmayum, A.; Jatav, H.S.; Chandra, K.; Singhal, R.K.; Sathyanarayana, E.; Patra, A.; Mohapatra, K.K. Physiological mechanisms and adaptation strategies of plants under nutrient deficiency and toxicity conditions. In Plant Perspectives to Global Climate Changes; Academic Press: Cambridge, MA, USA, 2022.
- Szczepaniec, A.; Finke, D. Plant-vector-pathogen interactions in the context of drought stress. Front. Ecol. Evol. 2019, 7, 262.
- Kacira, M.; Ling, P.P.; Short, T.H. Machine vision extracted plant movement for early detection of plant water stress. Trans. ASAE 2002, 45, 1147.
- Ondimu, S.N.; Murase, H. Comparison of plant water stress detection ability of color and gray-level texture in Sunagoke moss. Trans. ASABE 2008, 51, 1111–1120.
- Kim, Y.; Glenn, D.M.; Park, J.; Ngugi, H.K.; Lehman, B.L. Hyperspectral image analysis for water stress detection of apple trees. Comput. Electron. Agric. 2011, 77, 155–160.
- Xu, G.; Zhang, F.; Shah, S.G.; Ye, Y.; Mao, H. Use of leaf color images to identify nitrogen and potassium deficient tomatoes. Pattern Recognit. Lett. 2011, 32, 1584–1590.
- Sena, D.G., Jr.; Pinto, F.A.C.; Queiroz, D.M.; Viana, P.A. Fall armyworm damaged maize plant identification using digital images. Biosyst. Eng. 2003, 85, 449–454.
- Bauch, C.; Rath, T. Prototype of a vision based system for measurements of white fly infestation. In Proceedings of the International Conference on Sustainable Greenhouse Systems-Greensys, Leuven, Belgium, 12–16 September 2004.
- Foucher, P.; Revollon, P.; Vigouroux, B.; Chasseriaux, G. Morphological image analysis for the detection of water stress in potted forsythia. Biosyst. Eng. 2004, 89, 131–138.
- Chung, S.; Breshears, L.E.; Yoon, J.Y. Smartphone near infrared monitoring of plant stress. Comput. Electron. Agric. 2018, 154, 93–98.
- Ghosal, S.; Blystone, D.; Singh, A.K.; Ganapathysubramanian, B.; Singh, A.; Sarkar, S. An explainable deep machine vision framework for plant stress phenotyping. Proc. Natl. Acad. Sci. USA 2018, 115, 4613–4618.
- Elvanidi, A.; Katsoulas, N.; Kittas, C. Automation for Water and Nitrogen Deficit Stress Detection in Soilless Tomato Crops Based on Spectral Indices. Horticulturae 2018, 4, 47.
- Ramos-Giraldo, P.; Reberg-Horton, C.; Locke, A.M.; Mirsky, S.; Lobaton, E. Drought Stress Detection Using Low-Cost Computer Vision Systems and Machine Learning Techniques. IT Prof. 2020, 22, 27–29.
- Story, D.; Kacira, M.; Kubota, C.; Akoglu, A.; An, L. Lettuce calcium deficiency detection with machine vision computed plant features in controlled environments. Comput. Electron. Agric. 2010, 74, 238–243.
- Mao, H.; Gao, H.; Zhang, X.; Kumi, F. Nondestructive measurement of total nitrogen in lettuce by integrating spectroscopy and computer vision. Sci. Hortic. 2015, 184, 1–7.
- Ahmad, I.S.; Reid, J.F. Evaluation of colour representations for maize images. J. Agric. Eng. Res. 1996, 63, 185–195.
- An, J.; Li, W.; Li, M.; Cui, S.; Yue, H. Identification and Classification of Maize Drought Stress Using Deep Convolutional Neural Network. Symmetry 2019, 11, 256.
- Chandel, N.S.; Chakraborty, S.K.; Rajwade, Y.A.; Dubey, K.; Tiwari, M.K.; Jat, D. Identifying crop water stress using deep learning models. Neural Comput. Appl. 2021, 33, 5353–5367.
- Rubanga, D.P.; Loyani, L.K.; Richard, M.; Shimada, S. A Deep Learning Approach. for Determining Effects of Tuta Absoluta in Tomato Plants. arXiv 2020, arXiv:2004.04023.
- Han, K.A.M.; Watchareeruetai, U. Black Gram Plant Nutrient Deficiency Classification in Combined Images Using Convolutional Neural Network. In Proceedings of the 2020 8th International Electrical Engineering Congress (iEECON), Mai, Thailand, 4 March 2020.
- Wakamori, K.; Mizuno, R.; Nakanishi, G.; Mineno, H. Multimodal neural network with. clustering-based drop for estimating plant water stress. Comput. Electron. Agric. 2020, 168, 105118.
- Shariff, A.R.M.; Aik, Y.Y.; Hong, W.T.; Mansor, S.; Mispan, R. Automated identification and counting of pests in the paddy fields using image analysis. In Computers in Agriculture and Natural Resources, Proceedings of the 4th World Congress Conference, Orlando Florida, FL, USA, 23–25 July 2006; American Society of Agricultural and Biological Engineers: St. Joseph, MI, USA, 2006; p. 759.
- Li, H.; Yin, J.; Zhang, M.; Sigrimis, N.; Gao, Y.; Zheng, W. Automatic diagnosis of strawberry water stress status based on machine vision. Int. J. Agric. Biol. Eng. 2019, 12, 159–164.
- Khanna, R.; Schmid, L.; Walter, A.; Nieto, J.; Siegwart, R.; Liebisch, F. A spatio temporal spectral framework for plant stress phenotyping. Plant Methods 2019, 15, 1–18.
- Hendrawan, Y.; Murase, H. Bio-inspired feature selection to select informative image features for determining water content of cultured Sunagoke moss. Expert Syst. Appl. 2011, 38, 14321–14335.
- Seginer, I.; Elster, R.T.; Goodrum, J.W.; Rieger, M.W. Plant wilt detection by computer-vision tracking of leaf tips. Trans. ASAE 1992, 35, 1563–1567.
- Cevallos, C.; Ponce, H.; Moya-Albor, E.; Brieva, J. Vision-Based Analysis on. Leaves of Tomato Crops for Classifying Nutrient Deficiency using Convolutional Neural Net-works. In Proceedings of the 2020 International Joint Conference on Neural Networks (IJCNN), Glasgow, UK, 19 July 2020.
- Nhamo, L.; Magidi, J.; Nyamugama, A.; Clulow, A.D.; Sibanda, M.; Chimonyo, V.G.; Mabhaudhi, T. Prospects of Improving Agricultural and Water Productivity through Unmanned Aerial Vehicles. Agriculture 2020, 10, 256.
- Koley, S. Machine learning for soil fertility and plant nutrient management using back propagation neural networks. Int. J. Recent Innov. Trends Comput. Commun. 2014, 2, 292–297.
- Hetzroni, A.; Miles, G.E.; Engel, B.A.; Hammer, P.A.; Latin, R.X. Machine vision monitoring of plant health. Adv. Space Res. 1994, 14, 203–212.
- Mao, H.P.; Xu, G.; Li, P. Diagnosis of nutrient deficiency of tomato based on computer vision. Trans. Chin. Soc. Agric. Mach. 2003, 34, 73–75.
- Rangel, B.M.S.; Fernández, M.A.A.; Murillo, J.C.; Ortega, J.C.P.; Arreguín, J.M.R. KNN-based image segmentation for grapevine potassium deficiency diagnosis. In Proceedings of the 2016 International conference on Electronics Communications and Computers (CONIELECOMP), Cholula, Mexico, 24 February 2016.
- Li, D.; Zhang, P.; Chen, T.; Qin, W. Recent development and challenges in spectroscopy and machine vision technologies for crop nitrogen diagnosis: A review. Remote Sens. 2020, 12, 2578.
- Boissard, P.; Martin, V.; Moisan, S. A cognitive vision approach to early pest detection in greenhouse crops. Comput. Electron. Agric. 2008, 62, 81–93.
- Muppala, C.; Guruviah, V. Machine vision detection of pests, diseases and weeds: A review. J. Phytol. 2020, 12, 9–19.
- Weizheng, S.; Yachun, W.; Zhanliang, C.; Hongda, W. Grading method of leaf spot disease based on image processing. In Proceedings of the 2008 International Conference on Computer Science and Software Engineering, Wuhan, China, 12 December 2008.
- Al-Hiary, H.; Bani-Ahmad, S.; Reyalat, M.; Braik, M.; Alrahamneh, Z. Fast and accurate detection and classification of plant diseases. Int. J. Comput. Appl. 2011, 17, 31–38.
- Arivazhagan, S.; Shebiah, R.N.; Ananthi, S.; Varthini, S.V. Detection of unhealthy region of plant leaves and classification of plant leaf diseases using texture features. Agric. Eng. Int. CIGR J. 2013, 15, 211–217.
- Al Bashish, D.; Braik, M.; Bani-Ahmad, S. Detection and classification of leaf diseases using K-means-based segmentation and Neural-networks-based classification. Inf. Technol. J. 2011, 10, 267–275.
- Chaudhary, P.; Chaudhari, A.K.; Cheeran, A.N.; Godara, S. Color transform based approach for disease spot detection on plant leaf. Int. J. Comput. Sci. Telecommun. 2012, 3, 65–70.
- Omrani, E.; Khoshnevisan, B.; Shamshirband, S.; Saboohi, H.; Anuar, N.B.; Nasir, M.H.N.M. Potential of radial basis function-based support vector regression for apple disease detection. Measurement 2014, 55, 512–519.
- Camargo, A.; Smith, J.S. An image-processing based algorithm to automatically identify plant disease visual symptoms. Biosyst. Eng. 2009, 102, 9–21.
- Choudhary, G.M.; Gulati, V. Advance in Image Processing for Detection of Plant Diseases. Int. J. Adv. Res. Comput. Sci. Softw. Eng. 2015, 5, 1090–1093.
- Kanjalkar, H.P.; Lokhande, S.S. Detection and classification of plant leaf diseases using ANN. Int. J. Sci. Eng. Res. 2013, 4, 1777–1780.
- Naikwadi, S.; Amoda, N. Advances in image processing for detection of plant diseases. Int. J. Appl. Or Innov. Eng. Manag. 2013, 2, 11.
- Muthukannan, K.; Latha, P.; Selvi, R.P.; Nisha, P. Classification of diseased plant leaves using neural Network algorithms. ARPN J. Eng. Appl. Sci. 2015, 10, 1913–1919.
- Wu, S.G.; Bao, F.S.; Xu, E.Y.; Wang, Y.X.; Chang, Y.F.; Xiang, Q.L. A leaf recognition algorithm for plant classification using probabilistic neural network. In Proceedings of the 2007 IEEE International Symposium on Signal Processing and Information Technology, Giza, Egypt, 15 December 2007.
- Singh, V.; Misra, A.K. Detection of plant leaf diseases using image segmentation and soft computing techniques. Inf. Process. Agric. 2017, 4, 41–49.
- Kutty, S.B.; Abdullah, N.E.; Hashim, H.; Kusim, A.S.; Yaakub, T.N.T.; Yunus, P.N.A.M.; Abd Rahman, M.F. Classification of watermelon leaf diseases using neural network analysis. In Proceedings of the Business Engineering and Industrial Applications Colloquium (Beiac), Langkawi, Malaysia, 7 April 2013.
- Zhang, S.; Wu, X.; You, Z.; Zhang, L. Leaf image based cucumber disease recognition using sparse representation classification. Comput. Electron. Agric. 2017, 134, 135–141.
- Sethy, P.K.; Barpanda, N.K.; Rath, A.K.; Behera, S.K. Deep feature based rice leaf disease identification using support vector machine. Comput. Electron. Agric. 2020, 175, 105527.
- Karthik, R.; Hariharan, M.; Anand, S.; Mathikshara, P.; Johnson, A.; Menaka, R. Attention embedded residual CNN for disease detection in tomato leaves. Appl. Soft Comput. 2020, 86, 105933.
- Xie, X.; Ma, Y.; Liu, B.; He, J.; Li, S.; Wang, H. A deep-learning-based real-time. detector for grape leaf diseases using improved convolutional neural networks. Front. Plant Sci. 2020, 11, 751.
- Jogekar, R.N.; Tiwari, N. A review of deep learning techniques for identification and diagnosis of plant leaf disease. Trends Comput. Commun. Proc. SmartCom 2020, 182, 435–441.
- López-García, F.; Andreu-García, G.; Blasco, J.; Aleixos, N.; Valiente, J.M. Automatic detection of skin defects in citrus fruits using a multivariate image analysis approach. Comput. Electron. Agric. 2010, 71, 189–197.
- Kim, D.G.; Burks, T.F.; Qin, J.; Bulanon, D.M. Classification of grapefruit peel diseases using color texture feature analysis. Int. J. Agric. Biol. Eng. 2009, 2, 41–50.
- Qin, J.; Burks, T.F.; Ritenour, M.A.; Bonn, W.G. Detection of citrus canker using hyperspectral reflectance imaging with spectral information divergence. J. Food Eng. 2009, 93, 183–191.
- Blasco, J.; Aleixos, N.; Moltó, E. Computer vision detection of peel defects in citrus by means of a region oriented segmentation algorithm. J. Food Eng. 2007, 81, 535–543.
- Blasco, J.; Aleixos, N.; Gómez-Sanchís, J.; Moltó, E. Recognition and classification of external skin damage in citrus fruits using multispectral data and morphological features. Biosyst. Eng. 2009, 103, 137–145.
- Li, J.; Rao, X.; Ying, Y. Detection of common defects on oranges using hyperspectral reflectance imaging. Comput. Electron. Agric. 2011, 78, 38–48.
- Li, J.; Rao, X.; Wang, F.; Wu, W.; Ying, Y. Automatic detection of common surface defects on oranges using combined lighting transform and image ratio methods. Postharvest Biol. Technol. 2013, 82, 59–69.
- Rong, D.; Rao, X.; Ying, Y. Computer vision detection of surface defect on oranges by means of a sliding comparison window local segmentation algorithm. Comput. Electron. Agric. 2017, 137, 59–68.
- Li, Q.; Wang, M.; Gu, W. Computer vision based system for apple surface defect detection. Comput. Electron. Agric. 2002, 36, 215–223.
- Shahin, M.A.; Tollner, E.W.; McClendon, R.W.; Arabnia, H.R. Apple classification based on surface bruises using image processing and neural networks. Trans. ASAE 2002, 45, 1619.
- Throop, J.A.; Aneshansley, D.J.; Anger, W.C.; Peterson, D.L. Quality evaluation of apples based on surface defects: Development of an automated inspection system. Postharvest Biol. Technol. 2005, 36, 281–290.
- Dubey, S.R.; Jalal, A.S. Detection and classification of apple fruit diseases using complete local binary patterns. In Proceedings of the 2012 Third International Conference on Computer and Communication Technology, Allahabad, India, 23 November 2012.
- Kleynen, O.; Leemans, V.; Destain, M.F. Development of a multi-spectral vision system for the detection of defects on apples. J. Food Eng. 2005, 69, 41–49.
- Barnes, M.; Duckett, T.; Cielniak, G.; Stroud, G.; Harper, G. Visual detection of blemishes in potatoes using minimalist boosted classifiers. J. Food Eng. 2010, 98, 339–346.
- Laykin, S.; Alchanatis, V.; Fallik, E.; Edan, Y. Image–processing algorithms for tomato classification. Trans. ASAE 2002, 45, 851.
- Diaz, R.; Gil, L.; Serrano, C.; Blasco, M.; Moltó, E.; Blasco, J. Comparison of three algorithms in the classification of table olives by means of computer vision. J. Food Eng. 2004, 61, 101–107.
- Ariana, D.P.; Lu, R.; Guyer, D.E. Near-infrared hyperspectral reflectance imaging for detection of bruises on pickling cucumbers. Comput. Electron. Agric. 2006, 53, 60–70.
- Wang, W.; Thai, C.; Li, C.; Gitaitis, R.; Tollner, E.W.; Yoon, S.C. Detection of sour skin diseases in vidalia sweet onions using near-Infrared hyperspectral imaging. In Proceedings of the 2009 American Society of Agricultural and Biological Engineers AIM, Reno, Nevada, 21–24 June 2009.
- Elsharif, A.A.; Dheir, I.M.; Mettleq, A.S.A.; Abu-Naser, S.S. Potato Classification Using Deep Learning. Int. J. Acad. Pedagog. Res. (IJAPR) 2020, 3, 1–8.
- Kukreja, V.; Dhiman, P. A Deep Neural Network based disease detection scheme for Citrus fruits. In Proceedings of the 2020 International Conference on Smart Electronics and Communication (ICOSEC), Trichy, India, 10 September 2020.
- El-Mashharawi, H.Q.; Abu-Naser, S.S.; Alshawwa, I.A.; Elkahlout, M. Grape type classification using deep learning. Int. J. Acad. Eng. Res. (IJAER) 2020, 3, 12.
More
Information
Subjects:
Agricultural Engineering; Agriculture, Dairy & Animal Science; Imaging Science & Photographic Technology
Contributors
MDPI registered users' name will be linked to their SciProfiles pages. To register with us, please refer to https://encyclopedia.pub/register
:
View Times:
1.3K
Entry Collection:
Remote Sensing Data Fusion
Revisions:
2 times
(View History)
Update Date:
06 Jan 2023
Table of Contents


Notice
You are not a member of the advisory board for this topic. If you want to update advisory board member profile, please contact office@encyclopedia.pub.
OK
Confirm
Only members of the Encyclopedia advisory board for this topic are allowed to note entries. Would you like to become an advisory board member of the Encyclopedia?
Yes
No
${ textCharacter }/${ maxCharacter }
Submit
Cancel
Back
Comments
${ item }
|
${ item.createdUser.fullName }
${ item.createdAt }
${ item.vote }
${ item.reply }
Delete
${ reply.createdUser.fullName }
${ reply.createdAt }
${ reply.vote }
Delete
There is no reply to this comment~
${ item.replyTextCharacter }/${ item.replyMaxCharacter }
Submit
Cancel
More
No more~
There is no comment~
${ textCharacter }/${ maxCharacter }
Submit
Cancel
${ selectedItem.replyTextCharacter }/${ selectedItem.replyMaxCharacter }
Submit
Cancel
Confirm
Are you sure to Delete?
Yes
No