Your browser does not fully support modern features. Please upgrade for a smoother experience.
Submitted Successfully!
 +1 credit
Thank you for your contribution! You can also upload a video entry or images related to this topic.
For video creation, please contact our Academic Video Service.
| Version | Summary | Created by | Modification | Content Size | Created at | Operation |
|---|---|---|---|---|---|---|
| 1 | Carla Fernandes | -- | 5502 | 2022-08-24 13:03:39 | | | |
| 2 | Catherine Yang | + 13 word(s) | 5515 | 2022-08-25 03:35:54 | | |
Video Upload Options
We provide professional Academic Video Service to translate complex research into visually appealing presentations. Would you like to try it?
Cite
If you have any further questions, please contact Encyclopedia Editorial Office.
Soares, J.X.; Santos, �.; Fernandes, C.; Pinto, M.M.M. Methods for Determination of Lipophilicity. Encyclopedia. Available online: https://encyclopedia.pub/entry/26444 (accessed on 27 July 2026).
Soares JX, Santos �, Fernandes C, Pinto MMM. Methods for Determination of Lipophilicity. Encyclopedia. Available at: https://encyclopedia.pub/entry/26444. Accessed July 27, 2026.
Soares, José X., Álvaro Santos, Carla Fernandes, Madalena M. M. Pinto. "Methods for Determination of Lipophilicity" Encyclopedia, https://encyclopedia.pub/entry/26444 (accessed July 27, 2026).
Soares, J.X., Santos, �., Fernandes, C., & Pinto, M.M.M. (2022, August 24). Methods for Determination of Lipophilicity. In Encyclopedia. https://encyclopedia.pub/entry/26444
Soares, José X., et al. "Methods for Determination of Lipophilicity." Encyclopedia. Web. 24 August, 2022.
Copy Citation
Lipophilicity is one of many parameters involved in the biological activity of drugs, as it affects their pharmacokinetic and pharmacodynamic behavior. Generally, lipophilicity is assessed by the partition coefficient of a compound between a nonpolar phase (n-octanol) and an aqueous phase (water), expressed as P (partition coefficient) or as its decimal logarithm (Log P). The gold standard method for the experimental determination of Log P is the shake-flask method.
lipophilicity
Log P
liquid chromatography
partition coefficient
1. In Silico Determination of Lipophilicity
Since the pivotal work of Hansch et al., which found out that the partition coefficients have an additive constitutive character, a myriad of in silico methodologies have been developed to predict lipophilicity from the molecular structure of a molecule [1]. If some of these methods are very simple [2], others exist that are more sophisticated and based on deep neural networks [3]. Excellent reviews on the in silico estimation of isotropic [4] and anisotropic lipophilicity [5][6] are available in the literature.
Independent of the computational method, the calculation is always based on a set of experimentally obtained values [7]. Therefore, the calculated values should be regarded as approximations. Often, calculated log P values are inaccurate, and the reliability of calculation methods is low for highly complex compounds [8]. In addition, in silico methods can also be imprecise as computed values for a class of compounds could vary up to two log P units depending on the approach used [9][10]. For the above-mentioned reasons, calculated values should be considered when [11]:
-
Choosing the experimental method;
-
Selecting conditions for a LC analysis;
-
Examining the plausibility of experimentally obtained values;
-
Providing an estimate when experimental methods are not applicable.
In the early discovery process, in silico methods are very useful for filtering drug-like compounds [12]. However, as soon as possible, the predicted values should be substituted by more accurate measured values [9].
2. Direct Experimental Determination of Lipophilicity
Direct determination of lipophilicity requires the quantification of the compound concentration present in the nonaqueous and in the aqueous phase. The direct method known as the shake-flask method is the gold standard for log P determination. Direct methods are usually accurate when measuring log P values in the range −2 to 4, but they are labor-consuming and usually require relatively large amounts of pure compounds [13].
In direct methods, LC is the method typically used to quantify the amount of substance in each phase of the biphasic system. When compared to other analytical methods, LC provides a wider range of applicability than gas chromatography and provides a lower detection limit than UV/Vis spectroscopy. The detection limit is particularly relevant for highly lipophilic compounds because compounds with log P values larger than 4 are often limited by the analyte minimum detection limit in the aqueous phase [14]. The use of LC is similar in the different direct methods. Therefore, in the next subchapters the different direct methods that can be coupled with LC will be discussed, providing more focus on the biphasic system rather than on the LC conditions.
2.1. Shake-Flask Method
The shake-flask method uses n-octanol (hydrophobic) and water (hydrophilic) as the biphasic liquid system, and it is the standard method recommended by Organization for Economic Co-operation and Development (OECD) [13]. This classical procedure consists of dissolving the sample, shaking until equilibrium has been reached, and measuring the compound concentration in each phase of the biphasic system [13].
The shake-flask method is a direct measurement of the partition coefficient, and that is its main advantage [15]. However, this procedure has several drawbacks. It requires control over a large number of experimental parameters (different experimental conditions usually produce different values of log P for the same analyte) [16]. It is a highly time-consuming method as the partition needs to reach equilibrium. The time needed to reach equilibrium concentrations varies hugely (from 1 to 24 h), and partitioning rates may be fast or slow depending on the log P of the solute and the degree of shaking [17]. It consumes large amounts of solvent per analyte [17], and it is not suitable for degradable compounds and surface-active materials [8]. Finally, it is not appropriate for poorly soluble compounds [17].
Modification of the shake-flask method has been proposed that enables the determination using different alternatives to the n-octanol/water system aimed to imitate different physiological cell barriers (e.g.: chloroform/water, alkane/water, or propylene glycol dipelargonate/water) [18].
2.2. Slow-Stirring Method
In the slow-stirring method, n-octanol and aqueous phases are mixed under slow stirring (instead of shaking) [19]. By proceeding this way, the formation of emulsions can be prevented. The obtained values with the shake-flask and slow-stirring method are very similar for compounds exhibiting log P < 4.5, but they differ for compounds with higher log P, which can be attributed to the formation of octanol emulsions in the shake-flask procedure [20]. As a drawback, this method requires a long period of stirring, up to 2–3 days, to reach equilibrium [19].
The slow-stirring method can also be applicable for the determination of anisotropic lipophilicity using a liposome/buffer system. The difference between the procedures is in the quantification step, as liposomes are separated from the buffer phase by inducing liposome aggregation followed by filtration [21].
2.3. Water-Plug Aspiration/Injection Method
The water-plug aspiration/injection method is another shake-flask modification particularly suitable for highly lipophilic compounds. In the shake-flask procedure, it is difficult to manually separate the water phase from the n-octanol phase without contaminating the water phase because of the high viscosity of n-octanol. Improper phase separation can impact the determination with a higher impact for highly lipophilicity compounds [22]. To avoid this problem, a small volume of water is aspirated into the needle before collecting the aqueous phase in order to decrease the potential contamination, as water in the needle should repel contaminating n-octanol phase [22]. The sampling of the water phase can be automated, but the obtained values must be manually inspected to identify instrument problems or solubility issues. The need for manual inspection can be suppressed by the use of an injection marker [23].
2.4. Flow-Based Method
Flow injection analysis can be exploited to set a variant of the shake-flask method that allows standardization of the measurement [24][25]. In this method, the test substance is dissolved in either n-octanol or water phase. The substance is then injected into the flow of a capillary tube with the corresponding phase, and the two immiscible phases are continuously pumped to a mixing point in the system. The substance partitions between the two phases, and after equilibration, a fraction of the aqueous flow is separated, and the concentration of the analyte is determined. The large surface area and short distance result in the fast transport of the analyte from one phase to the other, allowing it to rapidly reach equilibrium [24].
2.5. Miniaturization of Shake-Flask Method
To increase the throughput of log P measurements and to decrease the amounts of compound needed, the traditional shake-flask method was transposed to a 96-well format. In this technique, the partition coefficient of a solute is measured between a polymer phase and an aqueous phase [26]. The polymer phase is prepared in 96-well microplates. The tested compound is added to a polymer phase prepared in a 96-well microplate, and after incubation, in a shaker, the amount of compound is determined in the supernatant.
2.6. Vortex Liquid–Liquid Microextraction (VALLME) Method
VALLME is a microextraction method that, coupled with LC, aims to increase the throughput of log P measurements. In VALLME method, microvolumes of n-octanol are dispersed in the aqueous phase using vortex agitation [17]. The mechanical stress promoted by vortex agitation bursts the n-octanol phase into several smaller droplets forming an emulsion. The fine microdroplets formed to increase the interfacial contact area and reduce the thickness of the stagnant aqueous film, which is usually present at the n-octanol/water interface [17]. Consequently, the time required to reach equilibrium is dramatically shortened (equilibrium conditions are achieved in 2 min of vortex agitation) [17]. As the formed dispersion is unstable, the target analyte can be easily separated using centrifugation [27]. The microdroplet is then collected with a microsyringe, and the solute concentration is determined by LC [17].
The log P values are calculated as the ratio of equilibrium concentrations in the n-octanol and water phases. The equilibrium concentration of the analyte in the n-octanol phase is calculated each time using calibration curves obtained with the octanolic individual stock standard solutions. The log P values were calculated for each concentration level using the mass balance Equation (1) [28]:
where vol.octanol is the volume of n-octanol phase, vol.water is the volume of the water phase, [octanoleq.] is the concentration of the compound in the n-octanol phase calculated externally by the calibration curve, and [wateri] is the initial concentration in the aqueous phase. The main advantages of VALLME are its reliability, simplicity, low cost, minimal solvent, and solute consumption [17]. The main disadvantage of VALLME is the requirement of a low-density organic solvent as a nonaqueous phase. From a practical point of view, only n-octanol is suitable to be used in VALLME, as it is the only one that can restore to its initial single-drop shape after centrifugation [29].
2.7. Nano-Absorbent Based Method
Nanoparticles with absorbent properties can be used for the determination of partition coefficient. One of these methods is based on the use of porous silica-encapsulated magnetic nanoparticles, which are preloaded with a known amount of n-octanol [30][31]. These nanoparticles are then dispersed into an aqueous phase containing the tested compound. The small size of the n-octanol droplets and the efficient mixing provided by the nanoparticles increase the interfacial contact area between the two phases, which significantly reduces the time required to achieve equilibrium. The magnetic properties of the nanoparticles allow the easy separation of phases. The partition coefficient is determined by measuring the concentration of the targeted analyte in the aqueous phase before and after partitioning.
Despite being used for isotropic lipophilicity determination, nano-absorbent-based methods acquire particular relevance for the determination of anisotropic lipophilicity. Nano-sized artificial membranes, like liposomes [32] or micelles [33], act as absorbents enabling the direct determination of the lipophilicity in these biomimetic nonaqueous phase. The partitioning occurs just by mixing the artificial membranes with an aqueous solution of the compound to be tested. The major technical difficulty is the phase separation after reaching equilibrium. While n-octanol and water are two immiscible solvents, liposomes and micelles form a colloidal suspension in water. The most used techniques for phase separation are ultrafiltration [32] and ultracentrifugation [33]. The partition coefficient is determined by quantifying the compound present in the filtrate or in the supernatant.
An alternative method for the determination of anisotropic lipophilicity is based on solid-supported lipid membranes (SSLMs). SSLMs are silica nanobeads coated with a liposomal membrane that was noncovalently bound to the bead [34]. SSLMs beads are added to an aqueous solution of the compound to be tested, and the mixture is incubated to allow the partition between the lipid and aqueous phase. Phase separation is performed by centrifugation with a regular bench centrifuge [34] or by a short filtration step [35]. SSLM silica beads are commercially available and offer a high throughput as the time-consuming ultracentrifugation or ultrafiltration steps are not required.
2.8. Dialysis-Based Method
Dialysis bags can be used for the determination of isotropic lipophilicity [36]. In this method, the dialysis bag is filled with a solution of the compound under investigation dissolved in n-octanol saturated with water or buffer. The dialysis bag is then immersed into the aqueous phase saturated with n-octanol, and sonication is applied to shorten the equilibration time. After sonication, the phases are easily separated and analyzed by LC.
Similar to the nano-absorbent-based methods, dialysis-based methods are more important for the determination of anisotropic lipophilicity than for the determination of isotropic lipophilicity. In fact, the “gold standard” to measure lipid-water partitioning is the equilibrium dialysis method [34]. The dialysis cell consisted of two glass chambers separated by a dialysis membrane [37]. For the experiment, two dialysis cells are required: a reference cell and a measurement cell. One chamber of each cell is filled with a solution of the compound under is added, but the other chamber is filled with buffer and with the membrane suspension in the reference and measurement cell, respectively. The dialysis membrane allows the diffusion across the two chambers of the free compound but impedes the diffusion of the compound bound to the liposomes. The partition coefficient is determined by LC quantification of the compound concentration in the chambers without membrane suspension in the reference and in the measurement cells [38].
3. Indirect Experimental Determination of Lipophilicity
Due to the disadvantages associated with direct experiments, there is an increasing demand for developing methods that are able to estimate lipophilicity without quantification requirements [16]. These methods provide a greener and high-throughput measurements than can direct methods while simultaneously can reach good accuracy and versatility [14].
Since the 1980s, chromatographic procedures have been used to obtain physicochemical parameters associated with structural characteristics, namely log P [39]. Exploiting the relationship between the compound retention in a hydrophobic stationary phase and the compound lipophilicity, LC methods really shine in the indirect measurement of lipophilicity. In the following subchapters, the different LC methods used for indirect experimental determination of lipophilicity will be discussed.
3.1. Reversed-Phase Thin-Layer Chromatography
Reversed-phase thin-layer chromatography (RP-TLC) is the easiest LC method that can be used for the indirect determination of isotropic lipophilicity [40]. In RP-TLC [41] and reversed-phase-high performance thin layer chromatography (RP-HPTLC) [42], the stationary phase is a commercially available C8 or C18 silica gel plate (Figure 1). Alternatively, it is possible to prepare a non-polar stationary phase from the commonly available silica gel plates after its pulverization with n-octanol 5% (v/v) in diethyl ether. The mobile phases consist of binary mixtures of water (or buffer) and an organic solvent (modifier), usually methanol, which is the preferred solvent due to its compatibility with water, or alternatively tetrahydrofuran or acetonitrile [8].
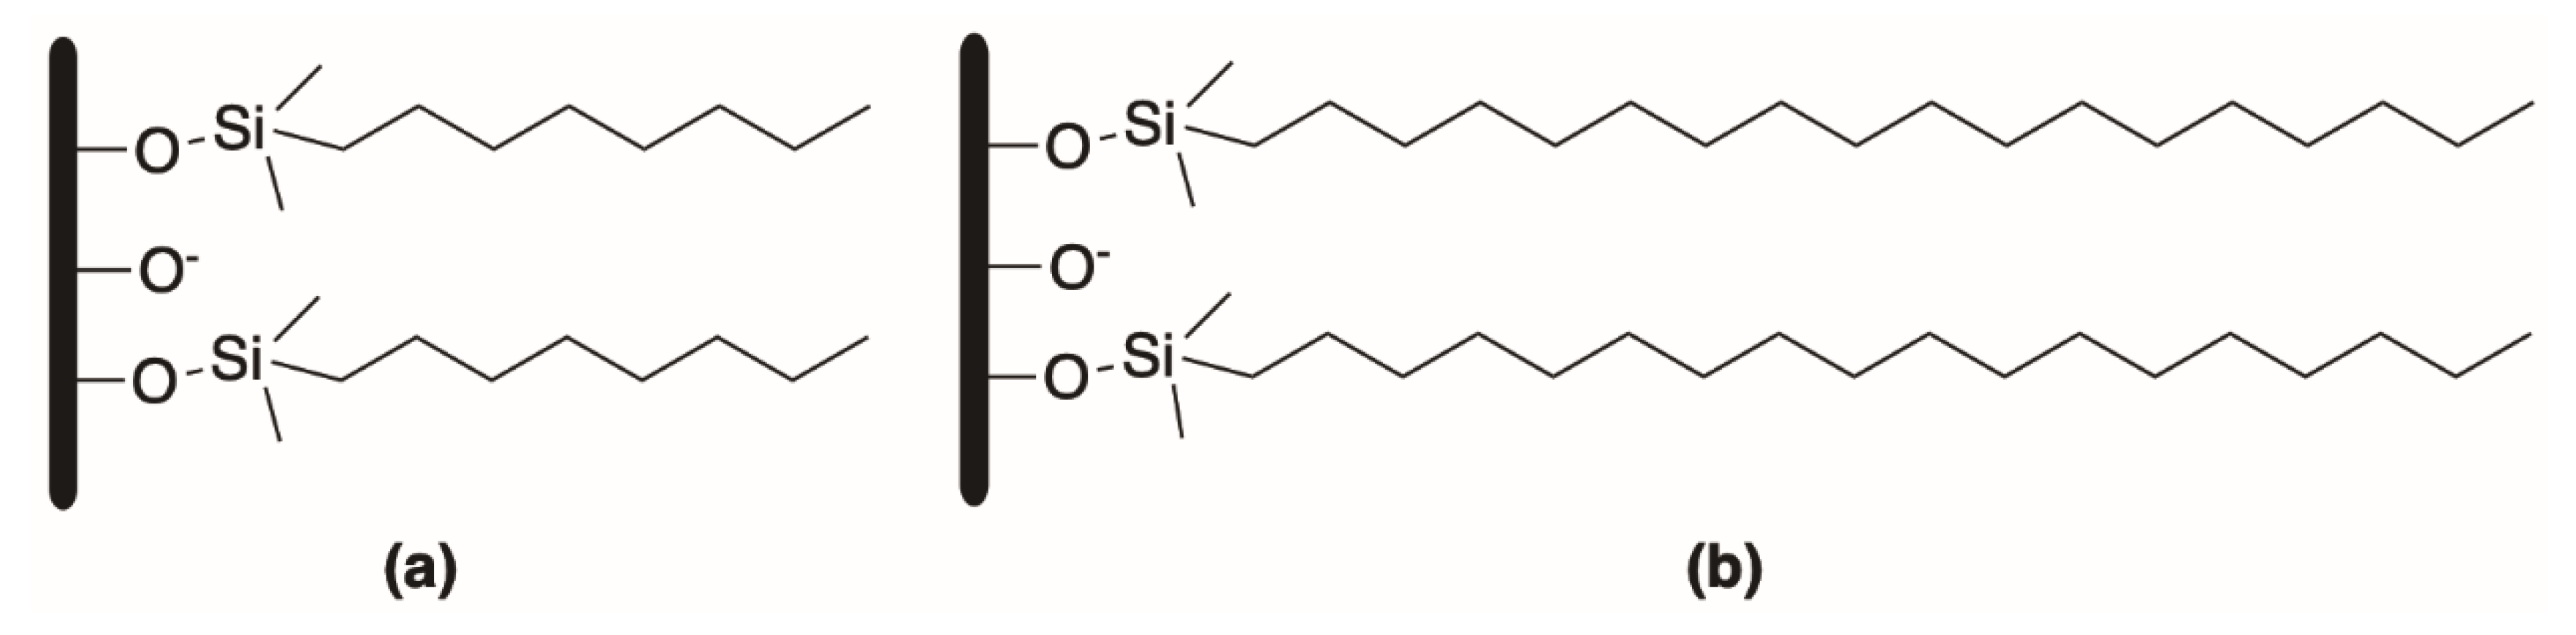
Figure 1. Octyl (a) and octadecyl (b) silica-based stationary phases.
The retention in reversed-phase systems is mainly governed by partitioning between the stationary and mobile phases [43][44]. Therefore, the lipophilicity index measured in RP-TLC can be derived from the RM value [43][44]:
where Rf is the retention factor which is obtained by dividing the distance covered by the sample by the distance covered by the mobile phase.
RM values are determined in the presence of different organic solvent concentrations in the mobile phase. The linear relationship between the RM values and different mobile phase proportions is established, and the partition coefficient is calculated by extrapolating to a pure water mobile phase [45].
3.2. Reversed-Phase High-Performance Liquid Chromatography
Reversed-phase high-performance liquid chromatography (RP-HPLC) is the most widely used indirect method to experimentally determine the lipophilicity [40][46] and the standard procedure for measuring log P is officially recommended by OECD [11]. The wide use of RP-HPLC is justified by the advances in the elucidation of solute interactions, the availability of well-characterized stationary phases, and the ubiquitous presence of automated HPLC systems [47].
As an indirect measurement of lipophilicity, RP-HPLC does not directly provide a partition coefficient but rather a lipophilicity index which is correlated with the partition coefficient. The lipophilicity index is inferred by the assumption that compounds are retained in proportion to their nonaqueous-aqueous partition coefficient, with hydrophilic compounds eluted first and lipophilic compounds last, and it is expressed by the retention factor k [11]. The retention factor k is easily calculated using the retention time (tr), according to Equation (3) [8][11]:
where t0 is the dead retention time (the retention time of an unretained solute) and tr is the retention time of the solute. The major factors that influence the retention time are the nature, length, and diameter of the stationary phase and the composition and flow rate of the mobile phase [39]. Compounds that are either unretained or too retained may have to be assessed using different column lengths or eluent compositions [48].
Under suitable isocratic conditions, the log P of the compound under study is obtained by measuring its retention factor and then inputting the k values into the Collander equation:
where a and b are regression constants for the slope and intercept obtained by linear regression of the log P of reference substances against the log k of the reference substances. In these conditions, the k-value of a given solute and stationary phase depends on the composition of the mobile phase [48]. To address this problem, pure aqueous eluent (log kw) should be used as it is not affected by the organic modifier and reflects the partitioning behavior that occurred in a shake-flask measurement [48][49]. As under most conditions pure water cannot be used as mobile phase, logkw is obtained by extrapolation to 100% water [14][50][51]. The Snyder–Soczewinski equation (Equation (5)) is the most common approach to estimate log kw [14]:
where φ is the volume fraction of the organic modifier in the mobile phase and S is a constant derived by linear regression analysis. The extrapolation for log kw is performed by determining the log k values using different percentages of organic solvent in the mobile phases (at least four isocratic log k values) and then extrapolating to 100% of pure water eluent [14][52][53]. Triplicates should be made [11] and they should fall within a range of ±0.1 log units [11].
The classical method for the determination of log P by RP-HPLC employs isocratic conditions. For compounds with high retention factors, the determination may be challenging due to band broadening. Although it requires a more complex mathematical treatment, elution in gradient mode can be used for the determination of log P and offers faster analysis time and resolution with constant peak width [54]. In gradient methods, the lipophilicity index is expressed by a different chromatographic parameter—the chromatographic hydrophobicity index (CHI). CHI corresponds to the percentage of organic modifier required to achieve equal distribution of the analyte between the stationary and the mobile phase. CHI values are obtained by measuring the retention times in gradient mode (tg) and then inputting the tg into the equation [14]:
where a and b are regression constants for the slope and intercept obtained by linear regression of tg of reference substances against the CHI of the reference substances.
For measuring log P with RP-HPLC, the following features need to be considered:
-
Precision: triplicates should be performed, and the obtained values of the log P values should be within a range of ±0.1 log units [7];
-
Sensitivity: HPLC enables log P to be determined over a range of about 0–6 [11];
-
Specificity: the presence of impurities may difficult the peak assignment and the interpretation of the obtained values [7];
-
Accuracy: the obtained log P values can be within ±1 log unit of the shake-flask value [7].
To control the above-mentioned features, the choice of suitable stationary and mobile phases plays a pivotal role.
Various stationary phases have been applied to evaluate indirectly isotropic lipophilicity [16]. Most of the chromatographic methods for measuring lipophilicity use RP silica-based stationary phases containing long-chain hydrocarbon, like octyl (C8) and octadecyl (C18), bound onto silica [7][11][14][52].
Silica is the most preferred packing material for RP columns, but it has the inconvenience of possible silanophilic interactions between the analyte and the remaining free silanol sites of the stationary phase. These interactions, more prominent in positively charged compounds, can produce distortions in peak shape and a considerable increase in the compound retention, which affects their log P determination [8][14]. In addition, these stationary phases are not stable at pH above 7.5 and can even break down [55]. OECD recommends that the stationary phases should have a minimal percentage of polar groups as they may impair the performance of the RP-HPLC column [11]. However, to overcome this problem, the best recommendation is to use highly end-capped columns for the RP-HPLC method, especially for basic compounds under high pH conditions [48][54]. One of the strategies for end-capping is to use base-deactivated silica stationary phases where the end-capping of the silanol residues is performed by the treatment with trimethylchlorosilane [56]. Another strategy to suppress silanophilic effects is the use of polar embedded stationary phases. Here, electrostatic shielding is achieved by the incorporation of functional groups, such as amide or carbamate, at the alky chains [56]. LC-ABZ+ and Discovery-RP-Amide-C16 are two examples of polar embedded stationary phases which have been used for lipophilicity determination [14][56].
However, other secondary interactions between these polar groups and certain analytes may occur. Many of these end-capped columns are still limited to pH below 8 because of their instability in an alkaline medium. Masking the silica units with hydrophobic ethylene groups prevents them from dissolution, and the structural ethylene bridges increase the column stability at a wide pH range (1–12) [14][54]. Acquity BEH Shield RP18 and XBridge Shield RP18 column are two examples of ethyl bridged columns that can be used to measure the lipophilicity not only for neutral and acidic compounds but also for basic ones [14][57].
Polymer-based stationary phases, composed of a rigid and porous cross-linked polymer, are another type of phases aimed at suppressing silanophilic effects. Polystyrene-divinylbenzene (PS-DVB) and octadecyl-poly(vinyl alcohol) (ODP) are two examples of these types of stationary phases that have been successfully used for log P determination. Silanophilic effects are suppressed because they do not have any polar site, and they can be used at a wide range of pH values (pH 1–13) [14][58][59]. However, these columns often have a longer retention time when compared to the silica-based ones [55] and the retention mechanism may be controlled by different structural properties of the polymer [14].
Regarding the mobile phase, the most extensively used are binary mixtures of water or buffer with an organic modifier [8]. HPLC-grade modifier and distilled water should be used to prepare the eluting solvent, which is degassed prior to use [11]. The use of binary mixtures is a requirement as the use of only water in RP silica-based columns is not feasible [43]. With high percentages of water, more than 98%, C18 and C8 columns exhibit poorly reproducible retention due to ligand collapse and the decreased contact between the mobile phase and the stationary phase [60]. For the lipophilicity assessment, methanol is considered the most suitable organic modifier. Being a protic solvent, methanol can interact with free silanol groups suppressing this way the silanophilic effects [54]. In addition, methanol forms a monolayer that mimics the n-octanol/water interface of the shake-flask method [8]. For lipophilicity determination, the volume fraction of methanol should be above 25–30% [11]. At a high-volume fraction of methanol, the eluent mixture is so unlike water; the phase aimed to be mimicked by the mobile phase, that the correlation between retention times and lipophilicity will be poor [48]. Acetonitrile is another organic modifier used for lipophilicity determination. When acetonitrile is used as an organic modifier instead of methanol, the correlation between retention times and organic modifier percentage in the mobile phase is generally better described by a quadratic model instead of a linear model [54][61]. In addition, the correlation between log P and log kW was better when methanol was used instead of acetonitrile [61].
Additives to the organic modifier–water mixture can be used, particularly when dealing with dissociable compounds [14]. Hydrophobic amines, such as triethylamine, n-decylamine, and N,N-dimethyloctylamine, are the traditional examples of additives added to the mobile phase. These masking agents can reduce silanophilic interactions and are very useful when basic compounds are analyzed [14]. Ionic liquids, such as 1-butyl-3-methylimidazolium tetrafluoroborate ([BMIM][BF4]), are greener alternatives to the traditional additives [14][62]. These additives are usually composed of relatively large asymmetric organic cations and inorganic/organic anions, meaning that both anion and cation can participate in the retention mechanism [14]. Therefore, the inclusion of a masking agent can selectively affect the compound retention times, and it should only be used on justifiable occasions [48].
In a similar way, ion suppressors can be added to the mobile phase to suppress the dissociation of ionizable compounds. Ion suppression is achieved by using buffer solutions based on phosphate, phosphate-buffered saline (PBS), or morphilinepropanesulfonic acid (MOPS) [14]. n-Octanol itself can be used as an additive to provide a better correlation with lipophilicity. The idea behind it is to render octanol-like characteristics to the column by saturating the column with n-octanol and then use of n-octanol saturated water as eluent. However, the inclusion of n-octanol as an additive should be tested. Some reports show better correlations between log P and log kW if better if n-octanol is supplementarily added [48][62] while others show the opposite trend [63].
Regarding the detection, most of the reported LC methods use UV-Vis or diode-array detectors (DAD), while mass spectrometry (MS) detection is only scarcely used. This is attributed to the easier use and ubiquitous presence of UV-Vis detection and to the fact the majority of the compounds under study (drugs or drug candidates) tend to absorb in this range.
Strictly related to RP-HPLC, solvatochromic analysis is an approach based on linear solvation–energy relationships (LSER) that allow for the understanding of the contribution of each intermolecular interaction involved in the partition [54]. The model considers both solute properties, such as Van der Waals volume or dipolarity/polarizability or hydrogen-bond–donor acidity, as well as the properties of the chromatographic system properties, which are calculated by multiple linear regression analysis for a diverse group of compounds [59][64][65]. The establishment of a robust correlation with the nonaqueous/aqueous partition coefficients involves not only a correlation between the RP-HPLC retention factor and the log P values but also LSER equations that are in agreement with the structural parameters [55].
When compared to the “gold standard” shake-flask method, RP-HPLC offers several advantages: it requires a smaller amount of sample and solvent, it has higher reproducibility, and it is faster as only the determination of retention times is required, and retention times are independent of the injected compound concentration/amount [11][14][52]. When compared to the RP-HPTLC, RP-HPLC tends to provide similar results [42][66].
3.3. Ultra-Performance Liquid Chromatography
Ultra-performance liquid chromatography (UPLC) works with columns packed with sub-2 μm porous particles. Compared to the conventional LC, the drastic reduction in the column length allows a faster determination of lipophilicity with a significant improvement in chromatographic performance and efficiency [54]. Few reports of lipophilicity determination using UPLC have been reported [54][65][67][68][69] because this technique requires specific equipment.
The different stationary phases will yield different partition coefficient values. If the RP-phases are similar, the analyte chromatographic behavior might be different, but the relationship between log P and retention factors tends to be similar [61]. However, if the distinct RP phases are used, the results are not comparable. To demonstrate this, Giaginis et al. [63] evaluated the lipophilicity of a set of thiazolidinediones derivatives with different RP phases, including one that is endcapped, polar-embedded, and polar-endcapped. For all compounds under study, the one polar endcapped phase provided the lowest retention factors, and the endcapped provided the highest retention factors. When compared with the partition coefficient values obtained by the shake-flask method, the partition coefficient values obtained with the endcapped phase provided the best correlation, namely in the pH range 5–8.
3.4. Counter-Current Chromatography
Counter-current chromatography (CCC) uses two immiscible solvents: one will act as a mobile phase while the other will act as a liquid stationary phase [53]. The liquid stationary phase is retained by applying a gravitational or a centrifugal field [25]. The partition coefficient is determined by taking into account the retention volume of the substance and the volume of the stationary and mobile phases [59]. The advantages of this technique are the use of small sample sizes and insensitivity to impurities; however, it is only applicable for log D < 4.3, and it is time- and labor-consuming [25].
3.5. Immobilized Artificial Membrane Chromatography
Immobilized artificial membrane (IAM) chromatography is the most widely used method for the determination of anisotropic lipophilicity [70]. The motivation behind IAM stationary phase is to better mimic specific interactions that solutes or drugs can establish with the membrane phospholipidic bilayer. To fulfil this goal, IAM stationary phases are prepared by binding covalently phospholipids to a propylamino functionalized silica particles (Figure 2a) [8][71]. The incorporated phospholipid can have a single or a double chain, but a double chain can better simulate biomembranes [8]. The remaining free propylamine residues on the surface of the silica backbone should be treated to suppress the undesired silanophilic interactions discussed above [8]. The most recent generation of IAM columns contains double-chain phosphatidylcholine, they are end-capped with decanoic, and propionic anhydride and are commercially available (IAM.PC.DD2 from Regis Technologies) [72]. A simple and economical alternative is the preparation of the stationary phase by coating a conventional RP column with phospholipids [16].
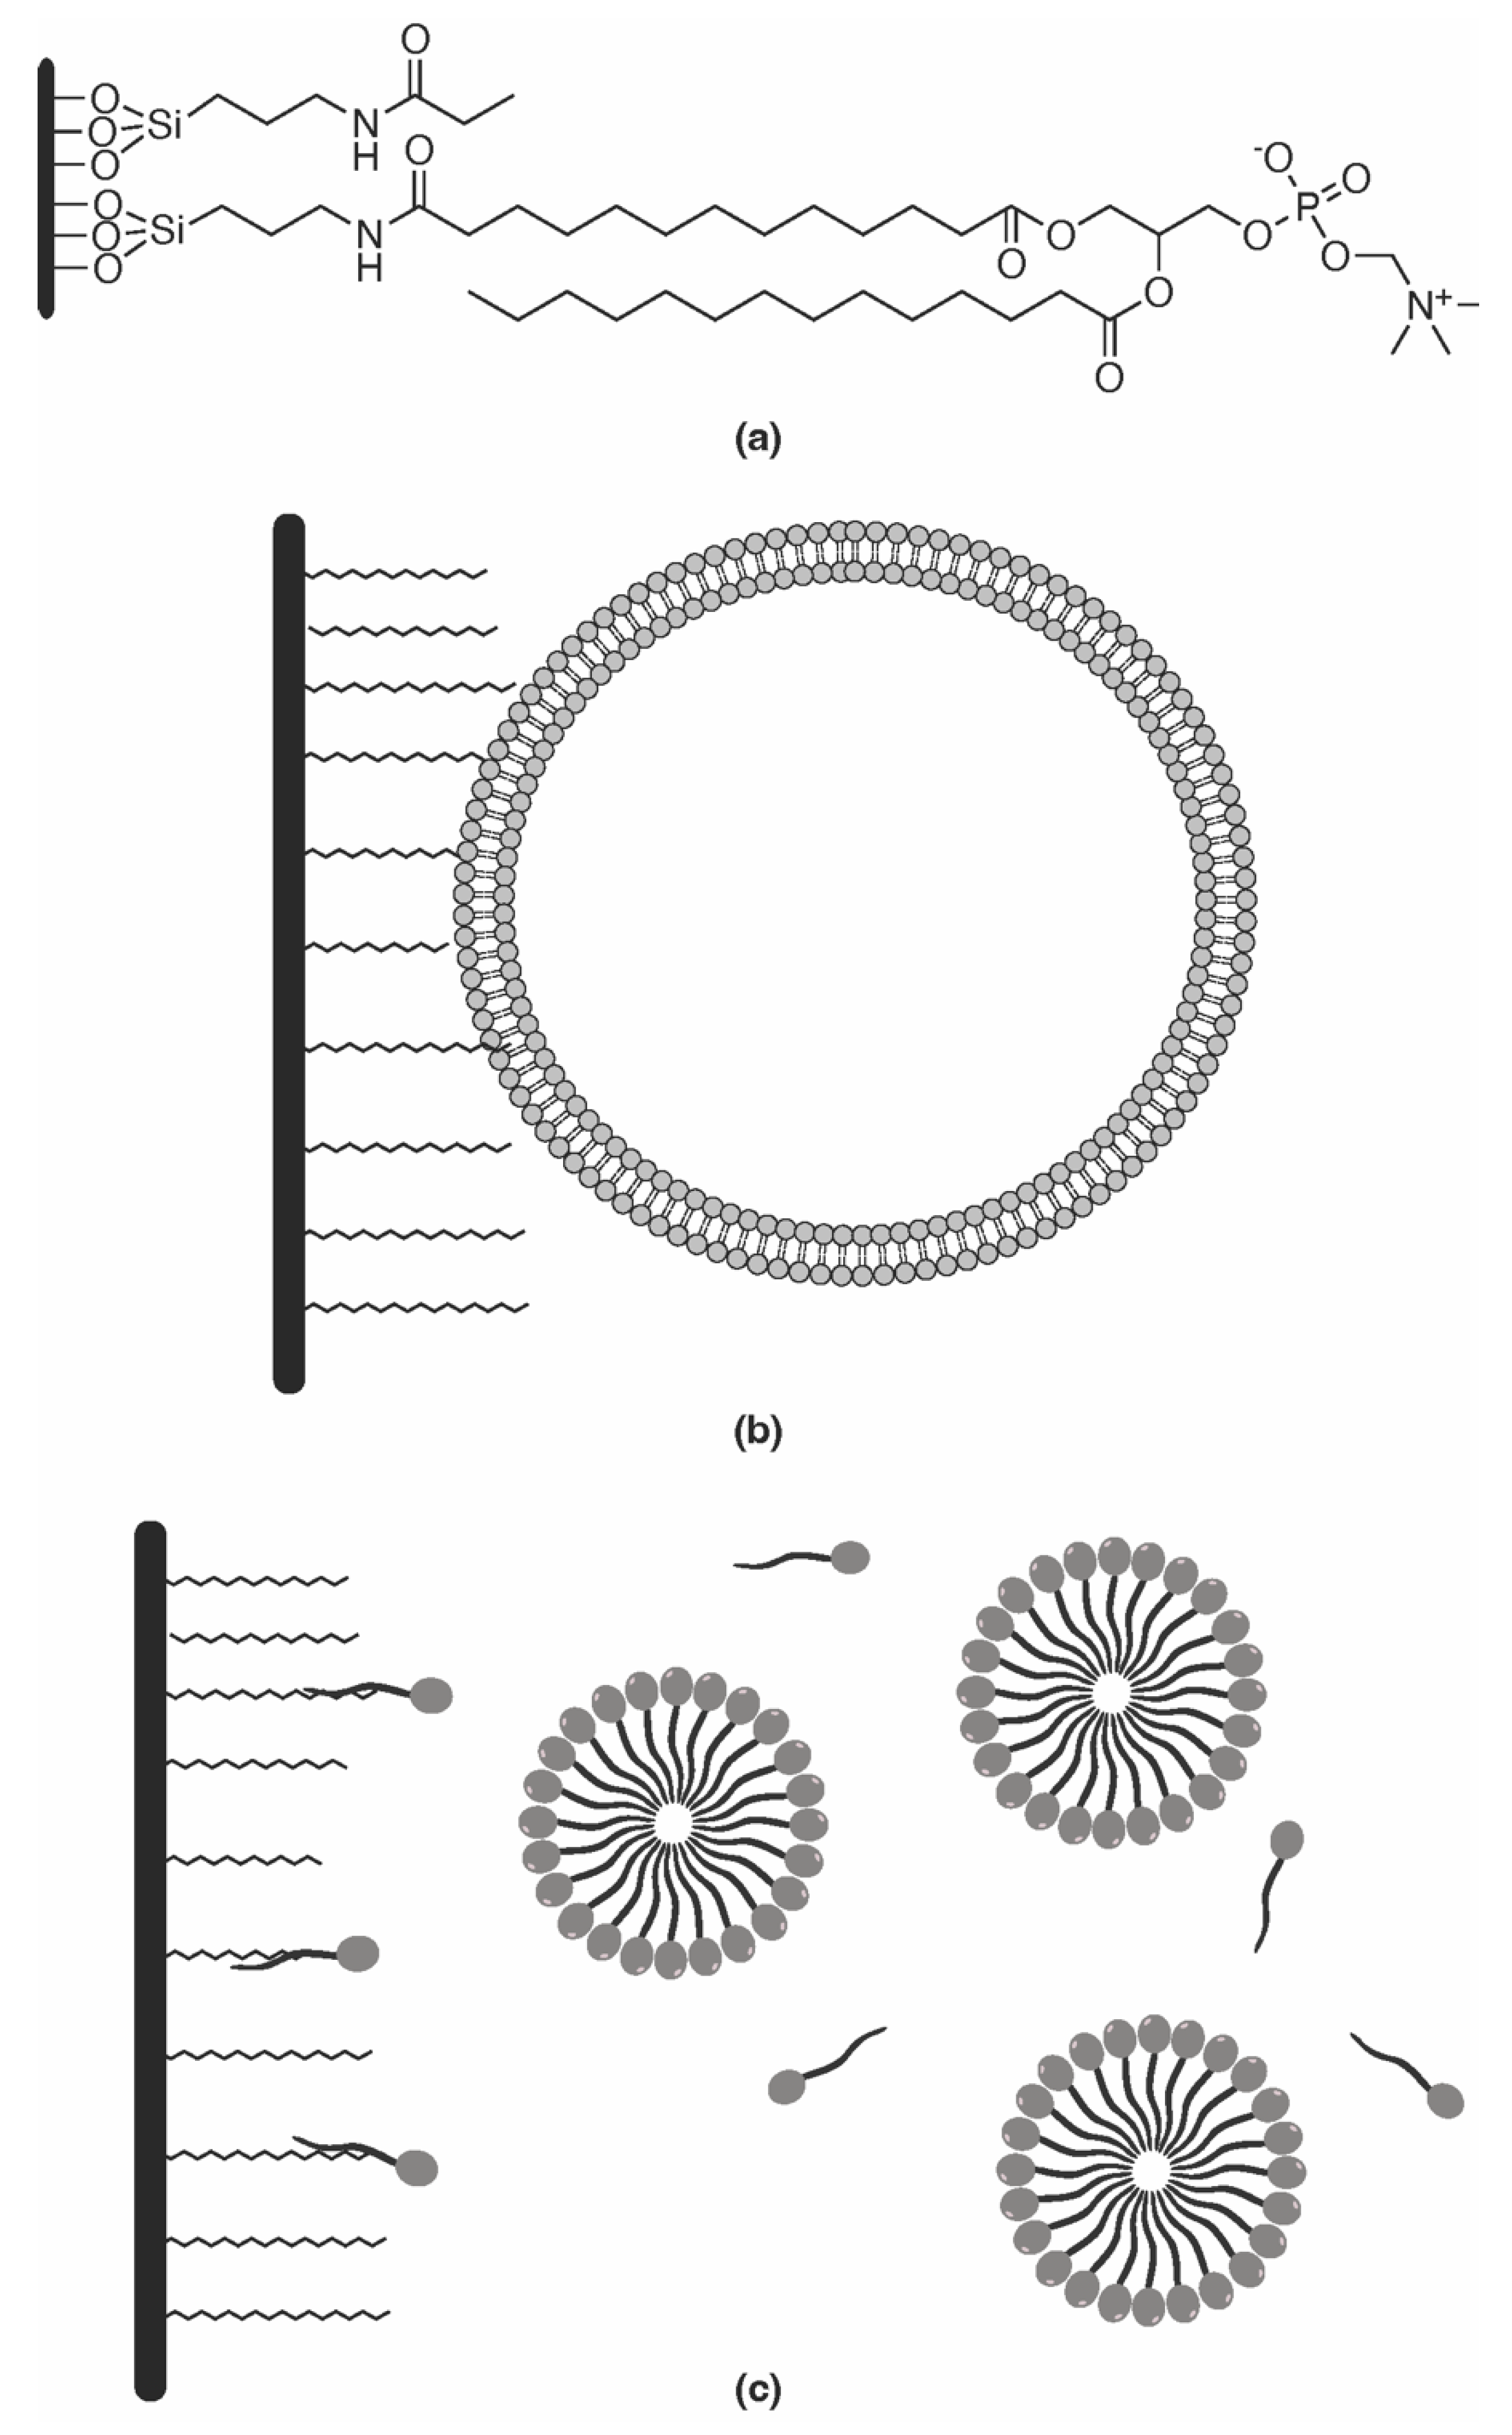
Figure 2. (a) IAM HPLC column; (b) immobilized liposome chromatography (ILC) HPLC column; (c) schematic representation of micellar liquid chromatography (MLC).
From a practical point of view, one of the main advantages of IAM columns is that they do not need the use of an organic modifier [8]. In fact, methanol as an organic modifier should be avoided as it disturbs the stability of the column by causing methanolysis of the phospholipids.
By simulating the phospholipid bilayer of biological membranes, the retention factor obtained with IAM chromatography correlates better with biological partition as the retention mechanism considers not only hydrophobic but also polar/ionic interactions [8][71]. For neutral solutes, the correlation between log P and the IAM partition coefficient (log kW-IAM) is strong. For ionized compounds, the correlation is poor due to the contribution of electrostatic interactions, which are not recognized in the octanol–water system [73]. When compared with partitioning with liposomes, log kIAM are well correlated for hydrophobic analytes [74]. Due to their resemblance to biological barriers, IAM chromatography has been successfully applied to calculate complex pharmacokinetic properties, such as cell permeation [75], intestinal absorption [76], unbound volume of distribution [77], and drug-induced phospholipidosis [78].
3.6. Immobilized Liposome Chromatography
Immobilized liposome chromatography (ILC) is another tool that has been used in anisotropic lipophilicity measurement. ILC stationary phases are prepared by immobilizing liposomes into the support silica particles by either covalent, hydrophobic, or electrostatic interactions (Figure 2b) [16][79].
When compared to IAM chromatography, ILC are better surrogates of the biological membranes because their liposomes have a bilayer structure and present a curvature effect [80]. In addition, the lipidic composition can be tailored to mimic specific biological barriers. Liu et al. studied different ILC column compositions aimed to mimic the small intestine membrane [81]. The authors suggested that liposomes composed of egg PC–PS–PE–cholesterol (5:1:2:2) were a suitable model for the prediction of the fraction absorption in humans. Despite its potential, the applications of the ILC method are very limited because of the low stability of liposomes [79].
3.7. Micellar Liquid Chromatography (MLC)
Micellar liquid chromatography (MLC) is a variant of RP-LC in which a surfactant at a concentration above the critical micellar concentration is added to the mobile phase, leading to the formation of micelles within the aqueous mobile phase (Figure 2c) [82][83]. MLC can be coupled to TLC, HPLC, and over-pressured-layer chromatography using micellar mobile phases [83].
In MLC, the micellar aggregates act as partition sites in the mobile phase, while the surfactant monomers present in the mobile phase modify the stationary phase either by both hydrophobic and/or silanophilic adsorption [84]. Due to the amphiphilic character of surfactants, the micellar mobile phase mimics the phospholipidic bilayer structure of biological membranes, while the modified stationary phase mimics not only the ordered array of the hydrophobic chains of phospholipids, mainly through the C18 carbon chains but also the polar heads of phospholipids, mainly through the adsorbed surfactant monomers [85]. During the elution, the solute can establish interactions with the micellar core, the micellar surface, the polar head of the surfactant bound to the stationary phase, and the alkyl chains bound to the stationary [82]. Therefore, solute retention involves the establishment of two different equilibriums: one between the bulk aqueous phase and the surfactant-coated stationary phase and another between the aqueous phase and the micelles [84]. The outcome index of MLC (log kMLC) is a metric of anisotropic lipophilicity as it depends on hydrophobic, electronic, and steric interactions [86]. Due to its similarity with biological membranes and extracellular fluids, MLC is also known as biopartitioning micellar chromatography [84].
Since the first reports of MLCs in the early 1980s, modifications of MLC have been reported [82]. These modifications are aimed to solve the decreased column efficiency in MLC due to slow mass transfer. The slow mass transfer is attributed to the poor wettability of a purely aqueous mobile phase and modification of the stationary phases by the adsorption of surfactant monomers [87]. To improve column efficiency, the main approaches are the addition of organic modifiers, the increase of column temperature, and decreased flow rate.
Exploiting the ability to mimic the phospholipidic barriers, log kMLC values have been used to predict several pharmacokinetic parameters, such as human oral absorption (HOA) [88][89][90][91], blood–brain barrier (BBB) permeability [88], plasma protein binding (PPB) [92][93], the volume of distribution [92][93], and therapeutic parameters [92][93]. When compared to other chromatographic techniques, MLC appears to be in the mid-ground between IAM and RP-HPLC. As an example, the lipophilicity of a set of fused azaisocytosine analogues was evaluated using RP-HPLC, IAM, and MLC [94]. For all compounds under study, the log kMLC values were higher than log kW-IAM but lower than log kW. In another example, the lipophilicity of a set of 88 compounds was evaluated using IAM and MLC [84]. Here, the obtained log kMLC values covered a narrower range than the obtained log kW-IAM values (log kW-IAM range: from −1.15 to 3.98, log kMLC range: from 1.84 to 3.98). These differences are attributed to the strong electrostatic interactions between positively charged drugs and the IAM phase and to the improved distribution of lipophilic compounds in the micellar MLC mobile phase. The chromatographic retention factors were used to predict cell permeability, HOA, and PPB. MLC retention factors demonstrated a better predictor capacity than IAM for cell permeability, while similar results were found for the remaining parameters. The advantage of the MLC is that it uses a conventional and easily available RP column, which is usually available in any analytical laboratory, while IAM requires a specific and expensive column.
References
- Bergstrom, C.A.; Norinder, U.; Luthman, K.; Artursson, P. Experimental and computational screening models for prediction of aqueous drug solubility. Pharm. Res. 2002, 19, 182–188.
- Petrauskas, A.A.; Kolovanov, E.A. ACD/Log P method description. Perspect. Drug Discov. Des. 2000, 19, 99–116.
- Ulrich, N.; Goss, K.-U.; Ebert, A. Exploring the octanol–water partition coefficient dataset using deep learning techniques and data augmentation. Commun. Chem. 2021, 4, 90.
- Mannhold, R.; Poda, G.I.; Ostermann, C.; Tetko, I.V. Calculation of molecular lipophilicity: State-of-the-art and comparison of log P methods on more than 96,000 compounds. J. Pharm. Sci. 2009, 98, 861–893.
- Lin, S.Y.; Yang, X.H.; Liu, H.H. Development of liposome/water partition coefficients predictive models for neutral and ionogenic organic chemicals. Ecotoxicol. Environ. Saf. 2019, 179, 40–49.
- Endo, S.; Escher, B.I.; Goss, K.U. Capacities of Membrane Lipids to Accumulate Neutral Organic Chemicals. Environ. Sci. Technol. 2011, 45, 5912–5921.
- Eadsforth, C.V.; Moser, P. Assessment of reverse-phase chromatographic methods for determining partition coefficients. Chemosphere 1983, 12, 1459–1475.
- Giaginis, C.; Tsantili-Kakoulidou, A. Current State of the Art in HPLC Methodology for Lipophilicity Assessment of Basic Drugs. A Review. J. Liq. Chromatogr. Relat. Technol. 2007, 31, 79–96.
- Lombardo, F.; Shalaeva, M.Y.; Tupper, K.A.; Gao, F.; Abraham, M.H. ElogPoct: A tool for lipophilicity determination in drug discovery. J. Med. Chem. 2000, 43, 2922–2928.
- Pinto, P.; Machado, C.M.; Moreira, J.; Almeida, J.D.P.; Silva, P.M.A.; Henriques, A.C.; Soares, J.X.; Salvador, J.A.R.; Afonso, C.; Pinto, M.; et al. Chalcone derivatives targeting mitosis: Synthesis, evaluation of antitumor activity and lipophilicity. Eur. J. Med. Chem. 2019, 184, 111752.
- OECD. Test No. 117: Partition Coefficient (n-Octanol/Water), HPLC Method; OECD Publishing: Paris, France, 2022.
- Lipinski, C.A. Drug-like properties and the causes of poor solubility and poor permeability. J. Pharmacol. Toxicol. Methods 2000, 44, 235–249.
- OECD. Test No. 107: Partition Coefficient (n-Octanol/Water): Shake Flask Method; OECD Publishing: Paris, France, 2022.
- Liang, C.; Lian, H.-Z. Recent advances in lipophilicity measurement by reversed-phase high-performance liquid chromatography. TrAC Trends Anal. Chem. 2015, 68, 28–36.
- Berthod, A.; Carda-Broch, S. Determination of liquid–liquid partition coefficients by separation methods. J. Chromatogr. A 2004, 1037, 3–14.
- Godard, T.; Grushka, E. The use of phospholipid modified column for the determination of lipophilic properties in high performance liquid chromatography. J. Chromatogr. A 2011, 1218, 1211–1218.
- Roman, I.P.; Mastromichali, A.; Tyrovola, K.; Canals, A.; Psillakis, E. Rapid determination of octanol-water partition coefficient using vortex-assisted liquid-liquid microextraction. J. Chromatogr. A 2014, 1330, 1–5.
- Hartmann, T.; Schmitt, J. Lipophilicity—Beyond octanol/water: A short comparison of modern technologies. Drug Discov. Today Technol. 2004, 1, 431–439.
- Brooke, D.N.; Dobbs, A.J.; Williams, N. Octanol:water partition coefficients (P): Measurement, estimation, and interpretation, particularly for chemicals with P greater than 10(5). Ecotoxicol. Environ. Saf. 1986, 11, 251–260.
- De Bruijn, J.; Busser, F.; Seinen, W.; Hermens, J. Determination of octanol/water partition coefficients for hydrophobic organic chemicals with the “slow-stirring” method. Environ. Toxicol. Chem. 1989, 8, 499–512.
- Jabusch, T.W.; Swackhamer, D.L. Partitioning of polychlorinated biphenyls in octanol/water, triolein/water, and membrane/water systems. Chemosphere 2005, 60, 1270–1278.
- Dohta, Y.; Yamashita, T.; Horiike, S.; Nakamura, T.; Fukami, T. A system for LogD screening of 96-well plates using a water-plug aspiration/injection method combined with high-performance liquid chromatography-mass spectrometry. Anal. Chem. 2007, 79, 8312–8315.
- Nishimura, I.; Hirano, A.; Yamashita, T.; Fukami, T. Improvement of the high-speed logD assay using an injection marker for the water plug aspiration/injection method. J. Chromatogr. A 2009, 1216, 2984–2988.
- Marine, N.A.; Klein, S.A.; Posner, J.D. Partition Coefficient Measurements in Picoliter Drops Using a Segmented Flow Microfluidic Device. Anal. Chem. 2009, 81, 1471–1476.
- Danielsson, L.G.; Zhang, Y.H. Methods for determining n-octanol-water partition constants. TrAC Trends Anal. Chem. 1996, 15, 188–196.
- Chen, Z.; Weber, S.G. High-throughput method for lipophilicity measurement. Anal. Chem. 2007, 79, 1043–1049.
- Psillakis, E. Vortex-assisted liquid-liquid microextraction revisited. TrAC Trends Anal. Chem. 2019, 113, 332–339.
- Dearden, J.C.; Bresnen, G.M. The Measurement of Partition Coefficients. Quant. Struct.-Act. Relat. 1988, 7, 133–144.
- Bosch Ojeda, C.; Sánchez Rojas, F. Vortex-Assisted Liquid–Liquid Microextraction (VALLME): Applications. Chromatographia 2014, 77, 745–754.
- Gao, X.; Yu, C.H.; Tam, K.Y.; Tsang, S.C. New magnetic nano-absorbent for the determination of n-octanol/water partition coefficients. J. Pharm. Biomed. Anal. 2005, 38, 197–203.
- Yu, C.H.; Tam, K.; Tsang, S.C. A new high-throughput method utilizing porous silica-based nano-composites for the determination of partition coefficients of drug candidates. J. Sep. Sci. 2011, 34, 2505–2512.
- Austin, R.P.; Davis, A.M.; Manners, C.N. Partitioning of Ionizing Molecules between Aqueous Buffers and Phospholipid Vesicles. J. Pharm. Sci. 1995, 84, 1180–1183.
- Park, J.Y.; Rippie, E.G. Micellar distribution equilibria: Ultracentrifugal study of apparent partition coefficients. J. Pharm. Sci. 1977, 66, 858–861.
- Loidl-Stahlhofen, A.; Hartmann, T.; Schöttner, M.; Rhöring, C.; Brodowsky, H.; Schmitt, J.; Keldenich, J. Multilamellar liposomes and solid-supported lipid membranes (TRANSIL): Screening of lipid-water partitioning toward a high-throughput scale. Pharm. Res. 2001, 18, 1782–1788.
- Dolzonek, J.; Cho, C.W.; Stepnowski, P.; Markiewicz, M.; Thoming, J.; Stolte, S. Membrane partitioning of ionic liquid cations, anions and ion pairs—Estimating the bioconcentration potential of organic ions. Environ. Pollut. 2017, 228, 378–389.
- Schrader, W.; Andersson, J.T. Fast and direct method for measuring 1-octanol-water partition coefficients exemplified for six local anesthetics. J. Pharm. Sci. 2001, 90, 1948–1954.
- Pauletti, G.M.; Wunderli-Allenspach, H. Partition coefficients in vitro: Artificial membranes as a standardized distribution model. Eur. J. Pharm. Sci. 1994, 1, 273–282.
- Escher, B.I.; Schwarzenbach, R.P. Partitioning of Substituted Phenols in Liposome–Water, Biomembrane–Water, and Octanol–Water Systems. Environ. Sci. Technol. 1996, 30, 260–270.
- Terada, H. Determination of Log Poct by High-Performance Liquid Chromatography, and its Application in the Study Quantitative Structure-Activity Relationships. Quant. Struct.-Act. Relat. 1986, 5, 81–88.
- Abbas, N.S.; Mohamed, Y.A.S.; Derayea, S.M.; Omar, M.A.; Saleh, G.A. Simple TLC-spectrodensitometric method for studying lipophilicity and quantitative analysis of hypoglycemic drugs in their binary mixture. Biomed. Chromatogr. 2021, 35, e5154.
- De Mello, H.; Echevarria, A. Hydrophobicity study for some pyrazolo-pyridine derivatives by RP-TLC and RP-HPLC. J. Liq. Chromatogr. Relat. Technol. 2006, 29, 1317–1330.
- Cozma, A.; Vlase, L.; Ignat, A.; Zaharia, V.; Gocan, S.; Grinberg, N. Prediction of the lipophilicity of eight new p-toluenesulfonyl-hydrazinothiazole and hydrazine-bis-thiazole derivatives: A comparison between rp-hptlc and rp-hplc. J. Liq. Chromatogr. Relat. Technol. 2012, 35, 590–601.
- Dross, K.; Rekker, R.F.; de Vries, G.; Mannhold, R. The lipophilic behaviour of organic compounds: 3. The search for interconnections between reversed-phase chromatographic data and log Pfoct values. Quant. Struct.-Act. Relat. 1998, 17, 549–557.
- Komsta, Ł.; Skibiński, R.; Berecka, A.; Gumieniczek, A.; Radkiewicz, B.; Radoń, M. Revisiting thin-layer chromatography as a lipophilicity determination tool—A comparative study on several techniques with a model solute set. J. Pharm. Biomed. Anal. 2010, 53, 911–918.
- Cozma, A.; Zaharia, V.; Ignat, A.; Gocan, S.; Grinberg, N. Prediction of the lipophilicity of nine new synthesized selenazoly and three aroyl-hydrazinoselenazoles derivatives by reversed-phase high performance thin-layer chromatography. J. Chromatogr. Sci. 2012, 50, 157–161.
- Liang, C.; Han, S.-y.; Qiao, J.-q.; Lian, H.-z.; Ge, X. Determination of the n-octanol/water partition coefficients of weakly ionizable basic compounds by reversed-phase high-performance liquid chromatography with neutral model compounds. J. Sep. Sci. 2014, 37, 3226–3234.
- Arnott, J.A.; Planey, S.L. The influence of lipophilicity in drug discovery and design. Expert Opin. Drug Discov. 2012, 7, 863–875.
- Griffin, S.; Wyllie, S.G.; Markham, J. Determination of octanol-water partition coefficient for terpenoids using reversed-phase high-performance liquid chromatography. J. Chromatogr. A 1999, 864, 221–228.
- Hong, H.; Wang, L.; Zou, G. Retention in RP-HPLC: Lipophilicity Determination of Substituted Biphenyls by Reversed-Phase High Performance Liquid Chromatography. J. Liq. Chromatogr. Relat. Technol. 1997, 20, 3029–3037.
- Mrkvickova, Z.; Kovarikova, P.; Balikova, S.; Klimes, J. Determination of lipophilicity of novel potential antituberculotic agents using HPLC on monolithic stationary phase and theoretical calculations. J. Pharm. Biomed. Anal. 2008, 48, 310–314.
- Fei, X.; Zheng, Q.H. Lipophilicity coefficients of Me-Halo-CGS 27023A analogs determined by HPLC. J. Liq. Chromatogr. Relat. Technol. 2005, 28, 939–945.
- Zhang, L.; Li, Z.G.; Huang, R.Q.; Wang, Q.S. Lipophilicity determination of N-(benzothiazol-2-yl)-alpha-amino alkyl phosphonic diesters by RP-HPLC and RP-HPTLC. Chin. J. Chem. 2000, 18, 872–876.
- Enami, T.; Nagae, N.; Doshi, S. The retention behaviour of reversed-phase HPLC columns when used under 100% aqueous conditions. LC-GC Europe 2003, 16, 418–425.
- Henchoz, Y.; Guillarme, D.; Martel, S.; Rudaz, S.; Veuthey, J.-L.; Carrupt, P.-A. Fast log P determination by ultra-high-pressure liquid chromatography coupled with UV and mass spectrometry detections. Anal. Bioanal. Chem. 2009, 394, 1919–1930.
- Pagliara, A.; Khamis, E.; Trinh, A.; Carrupt, P.A.; Tsai, R.S.; Testa, B. Structural Properties Governing Retention Mechanisms on RP-HPLC Stationary Phases Used for Lipophilicity Measurements. J. Liq. Chromatogr. 1995, 18, 1721–1745.
- Giaginis, C.; Theocharis, S.; Tsantili-Kakoulidou, A. Octanol/water partitioning simulation by RP-HPLC for structurally diverse acidic drugs: Comparison of three columns in the presence and absence of n-octanol as the mobile phase additive. J. Sep. Sci. 2013, 36, 3830–3836.
- Liu, X.; Hefesha, H.; Tanaka, H.; Scriba, G.; Fahr, A. Lipophilicity measurement of drugs by reversed phase HPLC over wide pH range using an alkaline-resistant silica-based stationary phase, XBridge(TM) Shield RP18. Chem. Pharm. Bull. 2008, 56, 1417–1422.
- Zhao, Y.N.; Jona, J.; Chow, D.T.; Rong, H.J.; Semin, D.; Xia, X.Y.; Zanon, R.; Spancake, C.; Maliski, E. High-throughput logP measurement using parallel liquid chromatography/ultraviolet/mass spectrometry and sample-pooling. Rapid Commun. Mass Spectrom. 2002, 16, 1548–1555.
- Khan, B.M.; Liu, Y. High speed counter current chromatography: Overview of solvent-system and elution-mode. J. Liq. Chromatogr. Relat. Technol. 2018, 41, 629–636.
- Valko, K. Application of high-performance liquid chromatography based measurements of lipophilicity to model biological distribution. J. Chromatogr. A 2004, 1037, 299–310.
- Cimpan, G.; Irimie, F.; Gocan, S.; Claessens, H.A. Role of stationary phase and eluent composition on the determination of log P values of N-hydroxyethylamide of aryloxyalkylen and pyridine carboxylic acids by reversed-phase high-performance liquid chromatography. J. Chromatogr. B Anal. Technol. Biomed. Life Sci. 1998, 714, 247–261.
- Giaginis, C.; Tsantili-Kakoulidou, A. The performance of 1-ethyl-3-methylimidazolium tetrafluoroborate ionic liquid as mobile phase additive in HPLC-based lipophilicity assessment. Biomed. Chromatogr. 2011, 25, 606–612.
- Giaginis, C.; Theocharis, S.; Tsantili-Kakoulidou, A. Investigation of the lipophilic behaviour of some thiazolidinediones Relationships with PPAR-gamma activity. J. Chromatogr. B Anal. Technol. Biomed. Life Sci. 2007, 857, 181–187.
- Paschke, A.; Neitzel, P.L.; Walther, W.; Schuurmann, G. Octanol/water partition coefficient of selected herbicides: Determination using shake-flask method and reversed-phase high-performance liquid chromatography. J. Chem. Eng. Data 2004, 49, 1639–1642.
- Pallicer, J.M.; Calvet, C.; Port, A.; Rosés, M.; Ràfols, C.; Bosch, E. Extension of the liquid chromatography/quantitative structure-property relationship method to assess the lipophilicity of neutral, acidic, basic and amphotheric drugs. J. Chromatogr. A 2012, 1240, 113–122.
- Kovačević, S.; Banjac, M.K.; Podunavac-Kuzmanović, S.; Milošević, N.; Ćurčić, J.; Vulić, J.; Šeregelj, V.; Banjac, N.; Ušćumlić, G. Chromatographic and computational screening of anisotropic lipophilicity and pharmacokinetics of newly synthesized 1-aryl-3-ethyl-3-methylsuccinimides. Comput. Biol. Chem. 2020, 84, 107161.
- Henchoz, Y.; Guillarme, D.; Rudaz, S.; Veuthey, J.L.; Carrupt, P.A. High-throughput log P determination by ultraperformance liquid chromatography: A convenient tool for medicinal chemists. J. Med. Chem. 2008, 51, 396–399.
- Kovačević, S.; Karadžić Banjac, M.; Anojčić, J.; Podunavac-Kuzmanović, S.; Jevrić, L.; Nikolić, A.; Savić, M.; Kuzminac, I. Chemometrics of anisotropic lipophilicity of anticancer androstane derivatives determined by reversed-phase ultra high performance liquid chromatography with polar aprotic and protic modifiers. J. Chromatogr. A 2022, 1673, 463197.
- Rybka, S.; Obniska, J.; Żmudzki, P.; Koczurkiewicz, P.; Wójcik-Pszczoła, K.; Pękala, E.; Bryła, A.; Rapacz, A. Synthesis and Determination of Lipophilicity, Anticonvulsant Activity, and Preliminary Safety of 3-Substituted and 3-Unsubstituted N-pyrrolidine-2,5-dione Derivatives. ChemMedChem 2017, 12, 1848–1856.
- Gluck, S.J.; Martin, E.J. Extended Octanol-Water Partition Coefficient Determination by Dual-Mode Centrifugal Partition Chromatography. J. Liq. Chromatogr. 1990, 13, 3559–3570.
- Tsopelas, F.; Vallianatou, T.; Tsantili-Kakoulidou, A. Advances in immobilized artificial membrane (IAM) chromatography for novel drug discovery. Expert Opin. Drug Discov. 2016, 11, 473–488.
- Technologies, R. Available online: https://www.registech.com/immobilized-artificial-membrane-iam-chromatography/iam-pc-dd2/iam-pc-dd2/ (accessed on 12 July 2022).
- Vrakas, D.; Giaginis, C.; Tsantili-Kakoulidou, A. Electrostatic interactions and ionization effect in immobilized artificial membrane retention A comparative study with octanol-water partitioning. J. Chromatogr. A 2008, 1187, 67–78.
- Taillardat-Bertschinger, A.; Martinet, C.A.M.; Carrupt, P.-A.; Reist, M.; Caron, G.; Fruttero, R.; Testa, B. Molecular Factors Influencing Retention on Immobilized Artificial Membranes (IAM) Compared to Partitioning in Liposomes and n-Octanol. Pharm. Res. 2002, 19, 729–737.
- Stepanić, V.; Žiher, D.; Gabelica-Marković, V.; Jelić, D.; Nunhuck, S.; Valko, K.; Koštrun, S. Physicochemical profile of macrolides and their comparison with small molecules. Eur. J. Med. Chem. 2012, 47, 462–472.
- Grumetto, L.; Russo, G.; Barbato, F. Relationships between human intestinal absorption and polar interactions drug/phospholipids estimated by IAM-HPLC. Int. J. Pharm. 2015, 489, 186–194.
- Valkó, K.L.; Nunhuck, S.B.; Hill, A.P. Estimating Unbound Volume of Distribution and Tissue Binding by In Vitro HPLC-Based Human Serum Albumin and Immobilised Artificial Membrane-Binding Measurements. J. Pharm. Sci. 2011, 100, 849–862.
- Wang, J.; Zhao, X.; Xu, D.; Lai, L.; Crommen, J.; Guo, J.; Jiang, Z. Development of acidic phospholipid containing immobilized artificial membrane column to predict drug-induced phospholipidosis potency. J. Chromatogr. A 2021, 1647, 462147.
- Lundahl, P.; Yang, Q. Liposome chromatography: Liposomes immobilized in gel beads as a stationary phase for aqueous column chromatography. J. Chromatogr. A 1991, 544, 283–304.
- Eeman, M.; Deleu, M. From biological membranes to biomimetic model membranes. Biotechnol. Agron. Soc. Environ. 2010, 14, 719–736.
- Liu, X.-Y.; Nakamura, C.; Yang, Q.; Kamo, N.; Miyake, J. Immobilized liposome chromatography to study drug–membrane interactions: Correlation with drug absorption in humans. J. Chromatogr. A 2002, 961, 113–118.
- Waters, L.J.; Shahzad, Y.; Mitchell, J.C. pH effects in micellar liquid chromatographic analysis for determining partition coefficients for a series of pharmaceutically related compounds. Curr. Pharm. Anal. 2012, 8, 272–277.
- Janicka, M.; Stępnik, K.; Pachuta-Stec, A. Quantification of Lipophilicity of 1,2,4-Triazoles Using Micellar Chromatography. Chromatographia 2012, 75, 449–456.
- Tsopelas, F.; Danias, P.; Pappa, A.; Tsantili-Kakoulidou, A. Biopartitioning micellar chromatography under different conditions: Insight into the retention mechanism and the potential to model biological processes. J. Chromatogr. A 2020, 1621, 461027.
- Escuder-Gilabert, L.; Martinez-Pla, J.J.; Sagrado, S.; Villanueva-Camanas, R.M.; Medina-Hernandez, M.J. Biopartitioning micellar separation methods: Modelling drug absorption. J. Chromatogr. B Anal. Technol. Biomed. Life Sci. 2003, 797, 21–35.
- Quiñones-Torrelo, C.; Sagrado, S.; Villanueva-Camañas, R.M.; Medina-Hernández, M.J. Development of Predictive Retention−Activity Relationship Models of Tricyclic Antidepressants by Micellar Liquid Chromatography. J. Med. Chem. 1999, 42, 3154–3162.
- Khaledi, M.G.; Strasters, J.K.; Rodgers, A.H.; Breyer, E.D. Simultaneous enhancement of separation selectivity and solvent strength in reversed-phase liquid chromatography using micelles in hydro-organic solvents. Anal. Chem. 1990, 62, 130–136.
- De Vrieze, M.; Janssens, P.; Szucs, R.; Van der Eycken, J.; Lynen, F. In vitro prediction of human intestinal absorption and blood–brain barrier partitioning: Development of a lipid analog for micellar liquid chromatography. Anal. Bioanal. Chem. 2015, 407, 7453–7466.
- Molero-Monfort, M.; Escuder-Gilabert, L.; Villanueva-Camañas, R.M.; Sagrado, S.; Medina-Hernández, M.J. Biopartitioning micellar chromatography: An in vitro technique for predicting human drug absorption. J. Chromatogr. B Biomed. Sci. Appl. 2001, 753, 225–236.
- Waters, L.J.; Shokry, D.S.; Parkes, G.M.B. Predicting human intestinal absorption in the presence of bile salt with micellar liquid chromatography. Biomed. Chromatogr. 2016, 30, 1618–1624.
- Molero-Monfort, M.; Martín-Biosca, Y.; Sagrado, S.; Villanueva-Camañas, R.M.; Medina-Hernández, M.J. Micellar liquid chromatography for prediction of drug transport. J. Chromatogr. A 2000, 870, 1–11.
- Martínez-Pla, J.J.; Sagrado, S.; Villanueva-Camañas, R.M.; Medina-Hernández, M.J. Retention–property relationships of anticonvulsant drugs by biopartitioning micellar chromatography. J. Chromatogr. B Anal. Technol. Biomed. Life Sci. 2001, 757, 89–99.
- Wu, L.-P.; Chen, Y.; Wang, S.-R.; Chen, C.; Ye, L.-M. Quantitative retention–activity relationship models for quinolones using biopartitioning micellar chromatography. Biomed. Chromatogr. 2008, 22, 106–114.
- Janicka, M.; Mycka, A.; Sztanke, M.; Sztanke, K. Predicting Pharmacokinetic Properties of Potential Anticancer Agents via Their Chromatographic Behavior on Different Reversed Phase Materials. Int. J. Mol. Sci. 2021, 22, 4257.
More
Information
Subjects:
Chemistry, Analytical
Contributors
MDPI registered users' name will be linked to their SciProfiles pages. To register with us, please refer to https://encyclopedia.pub/register
:
View Times:
9.6K
Revisions:
2 times
(View History)
Update Date:
25 Aug 2022
Table of Contents


Notice
You are not a member of the advisory board for this topic. If you want to update advisory board member profile, please contact office@encyclopedia.pub.
OK
Confirm
Only members of the Encyclopedia advisory board for this topic are allowed to note entries. Would you like to become an advisory board member of the Encyclopedia?
Yes
No
${ textCharacter }/${ maxCharacter }
Submit
Cancel
Back
Comments
${ item }
|
${ item.createdUser.fullName }
${ item.createdAt }
${ item.vote }
${ item.reply }
Delete
${ reply.createdUser.fullName }
${ reply.createdAt }
${ reply.vote }
Delete
There is no reply to this comment~
${ item.replyTextCharacter }/${ item.replyMaxCharacter }
Submit
Cancel
More
No more~
There is no comment~
${ textCharacter }/${ maxCharacter }
Submit
Cancel
${ selectedItem.replyTextCharacter }/${ selectedItem.replyMaxCharacter }
Submit
Cancel
Confirm
Are you sure to Delete?
Yes
No