Unmanned aerial vehicles (UAVs) are platforms that have been increasingly used over the last decade to collect data for forest insect pest and disease (FIPD) monitoring. These machines provide flexibility, cost efficiency, and a high temporal and spatial resolution of remotely sensed data.
1. Introduction
Forests play a fundamental role in human well-being
[1]. They are crucial carbon pools
[2], contributing to mitigating the impacts of climate change
[3][4] while ensuring important economic and social benefits, providing soil and water protection, and many other relevant environmental services
[5].
In recent decades, changes in the frequency and severity of meteorological events seem to be related to a concomitant drop in the vitality of forests, namely with the outbreak of new insect pests and diseases
[5][6][7]. These environmental disturbances can facilitate a change in the frequency of the occurrence of forest pests
[8], which undoubtedly impacts the development, survival, reproduction, and dissemination of the species
[5]. Insects have been recognized as the first indicators of climate change
[9]. Reducing forest degradation and increasing its resilience involves managing and preventing these stressors and disturbing agents
[10]. In this context, accurate and timely forest health monitoring is needed to mitigate climate change and support sustainable forest management
[11].
Field sampling and symptom observation on foliage and trunks are the main methods to identify and register forest pests and diseases
[11][12]. When remotely sensed data with high spatial and spectral resolution are collected at ideal times, people can differentiate canopy reflectance signals from noise in forests affected by pests and diseases
[13][14]. Traditional field surveys based on forest inventories and observations are restricted by small area coverage and subjectivity
[15]. However, when combined with unmanned aerial vehicles (UAVs), spatial coverage can be expanded, response time minimized, and the costs of monitoring forested areas reduced. UAV systems provide images of high spatial resolution and can obtain updated and timely data with different sensors
[16][17]. In addition, they can complement the already well-known and explored satellites with airborne remote sensing capabilities
[16][18].
UAVs can also be a valuable field data source to calibrate and validate remote sensing monitoring systems
[19]. UAVs offer automatic movement and navigation, support different sensors, provide safe access to difficult locations, and enable data collection under cloudy conditions
[20]. In addition, these systems can be operated to monitor specific phenological phases of plants or during pest/disease outbreaks
[18][21]. In this sense, UAVs are versatile, flexible, and adaptable to different contexts
[22]. Despite the relevant advantageous characteristics of UAVs, some limitations can also be identified, such as limited area coverage, battery duration, payload weight, and local regulations
[23].
Several literatures have already provided critical aspects related to the application of UAVs to forest insect pest and disease (FIPD) monitoring (Table 1).
Table 1. Unmanned aerial vehicle (UAV) remote sensing for forest insect pests and diseases.
| No. |
Ref. |
Year |
Title |
Journal |
Contents |
| 1 |
[24] |
2017 |
Forestry applications of UAVs in Europe: a review |
International Journal of Remote Sensing |
A review of UAV-based forestry applications and aspects of regulations in Europe. Three studies about FIPDs were reviewed. |
| 2 |
[25] |
2017 |
Hyperspectral Imaging: A Review on UAV-Based Sensors, Data Processing and Applications for Agriculture and Forestry |
Remote Sensing |
A review on UAV-based hyperspectral sensors, data processing, and applications for agriculture and forestry. Three studies about FIPDs were reviewed. |
| 3 |
[26] |
2020 |
Remotely piloted aircraft systems and forests: a global state of the art and future challenges |
Canadian Journal of Forest Research |
A review of UAV-based forestry applications. Six studies about FIPDs were reviewed. |
| 4 |
[16] |
2020 |
Forestry Remote Sensing from Unmanned Aerial Vehicles: A Review Focusing on the Data, Processing and Potentialities |
Remote Sensing |
A review focusing on data, processing, and potentialities. It covers all types of procedures and provides examples. Nine studies about FIPDs were reviewed. |
| 5 |
[27] |
2021 |
Recent Advances in Unmanned Aerial Vehicles Forest Remote Sensing—A Systematic Review. Part II: Research Applications |
Forests |
A systematic review of UAV system solutions, technical advantages, drawbacks of the technology, and considerations on technology transfer. Seventeen studies about FIPDs were reviewed. |
| 6 |
[28] |
2021 |
The Role of Remote Sensing for the Assessment and Monitoring of Forest Health: A Systematic Evidence Synthesis |
Forests |
A systematic evidence synthesis about forest health issues with reference to different remote sensing platforms and techniques. Ten studies about UAV–FIPDs were reviewed. |
| 7 |
[29] |
2021 |
Remotely Piloted Aircraft Systems to Identify Pests and Diseases in Forest Species: The Global State of the Art and Future Challenges |
IEEE Geoscience and remote sensing magazine |
A literature review of UAV-based on forest pest and disease monitoring. Thirty-three studies about FIPDs were reviewed. |
2. Unmanned Aerial Vehicles in Forest Monitoring
2.1. UAV and Sensor Types
2.1.1. UAV Types
Figure 1 shows the circular packing graph where each circle is a group of UAV types considering the number of propellers and architecture. The bubbles inside the circles represent the sub-groups. Each bubble’s size is proportional to the UAV categories used in the studies.
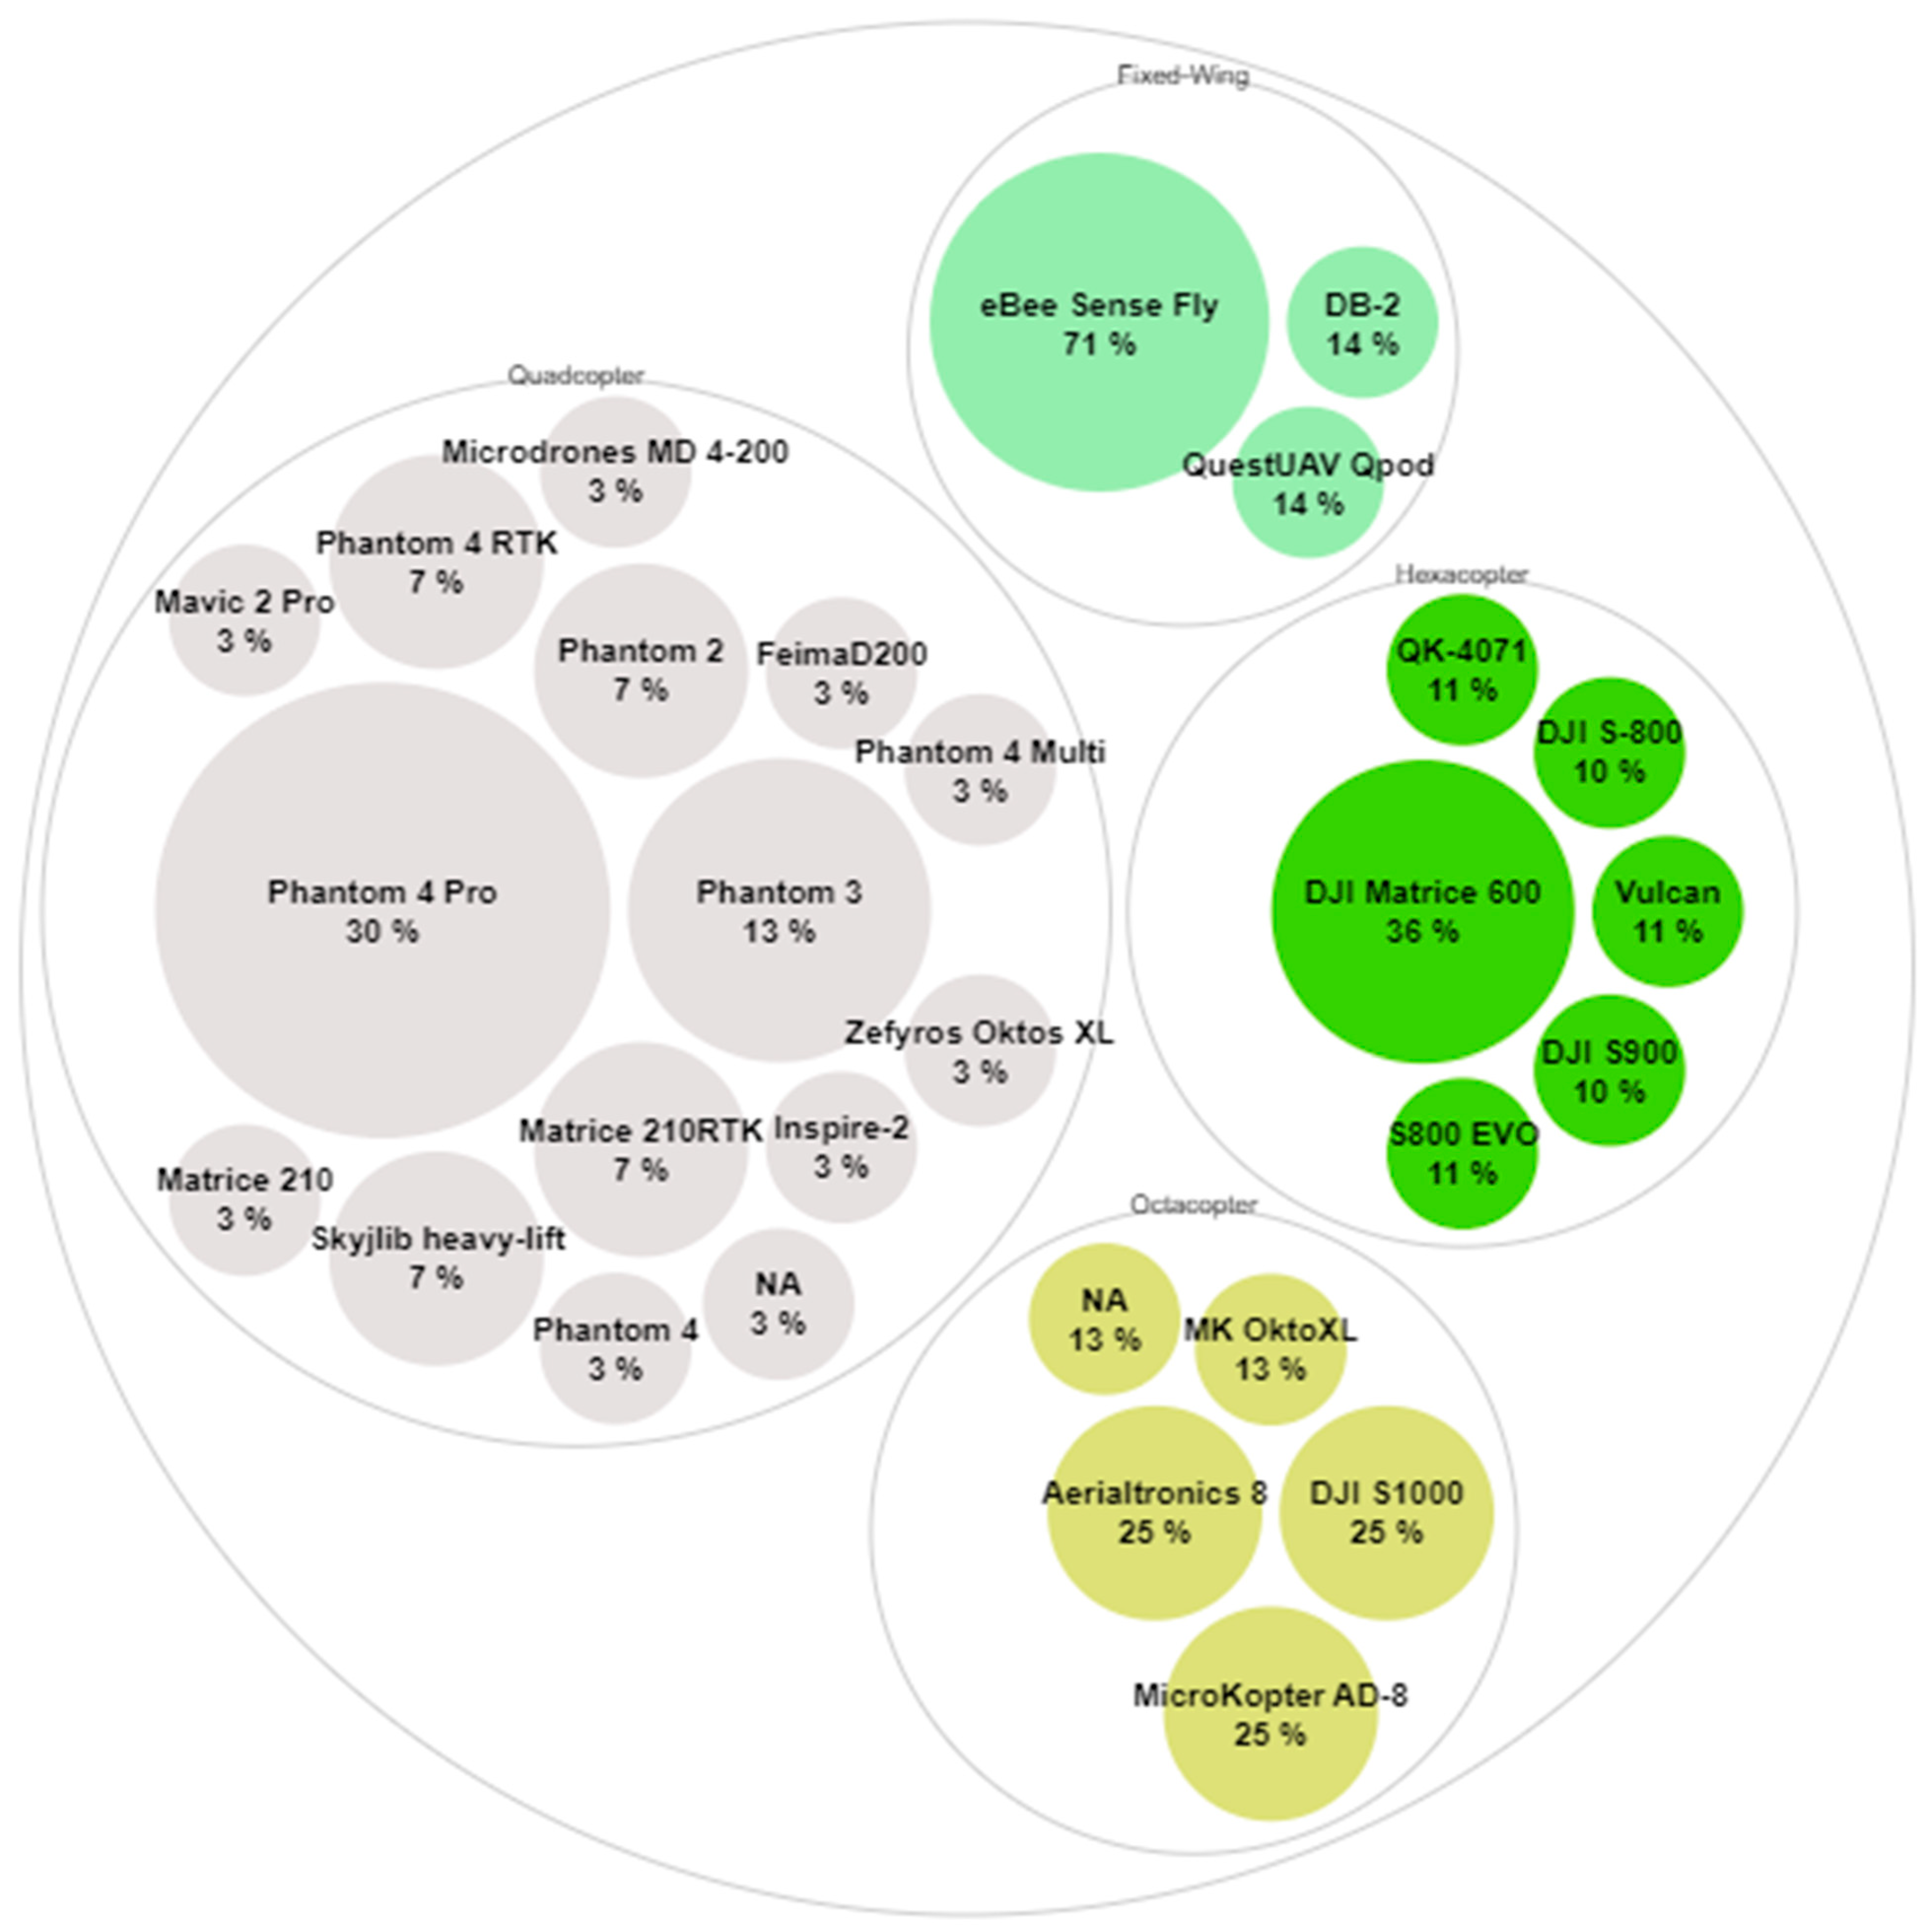
Figure 1. Summary of UAV types and model brands identified in the studies.
Regarding the models used by the number of propellers, the quadcopter model DJI Phantom 4 Pro was used in 30% of the studies and DJI Phantom 3 in 14%. With regard to octocopters, the most used models were the DJI S1000 (25%), Arealtronics (25%), and the MicroKopter Droidwors AD-8 (25%). Thirteen percent made no distinction based on the model used. The hexacopter DJI Matrice 600 model was used in 36% of the works. Finally, in the fixed-wing segment, the most popular was the eBee Sense Fly model with 71% usage, followed by the Quest UAV Qpod (14%) and DB-2 (14%).
Regarding the choice of platform, the most widely adopted was the rotary-wing, which stands out due to its flexibility, versatility, maneuverability, and its ability to hover, offering a much easier automated experience
[20][30][31]. Fixed-wing drones are more efficient, stable in crosswind flights, and have short flight times per unit of a mapped area
[32]. However, they are less versatile for making small flights when compared with rotary-wing drones. In addition, rotary-wing drones are more suitable for mapping small and complex sites, while fixed-wing drones are more appropriate for covering more extensive areas
[33]. Conversely, a faster vehicle may have issues mapping small objects and insufficient overlap
[31]. In spite of this, both UAV types offer the possibility to collect data from short intervals and at a local scale, which is relevant for multitemporal studies
[15][34]. Notably, the preference for quadcopters may be related to the low-cost acquisition, the wide availability on the market, and the assessment of FIPD in small areas
[26]. For example, the DJI Phantom series was the most frequently used in this segment. The hexacopters and octocopters from the DJI series choice were due to the payload capabilities in the remaining studies. Finally, eBee Sense Fly stands out for its maturity in the market. The arguments presented indicate that rotary-wing drones are the most suitable for FIPD monitoring. However, more comparative studies are needed to support the appropriate UAV architecture for this forestry application. Despite these facts, platform choice depends on the survey requirements, the budget, and the experience of the researcher or practitioner. An important point to mention is the market offer of hybrid VTOL (vertical take-off and landing), of which the only disadvantage is the complex system mechanism
[35][36].
2.1.2. Sensor Types
Figure 2a illustrates the number of remote sensing sensors, and Figure 2b shows the top 10 model camera brands coupled with UAVs. The passive remote sensor quantities were grouped into four categories: (i) RGB, i.e., the simplification of multispectral red–green–blue (RGB); (ii) multispectral, including RGB, near-infrared, and red-edge bands; (iii) hyperspectral; and finally, (iv) thermal sensors. Light detection and ranging (LiDAR) was the only active sensor found in the studies.
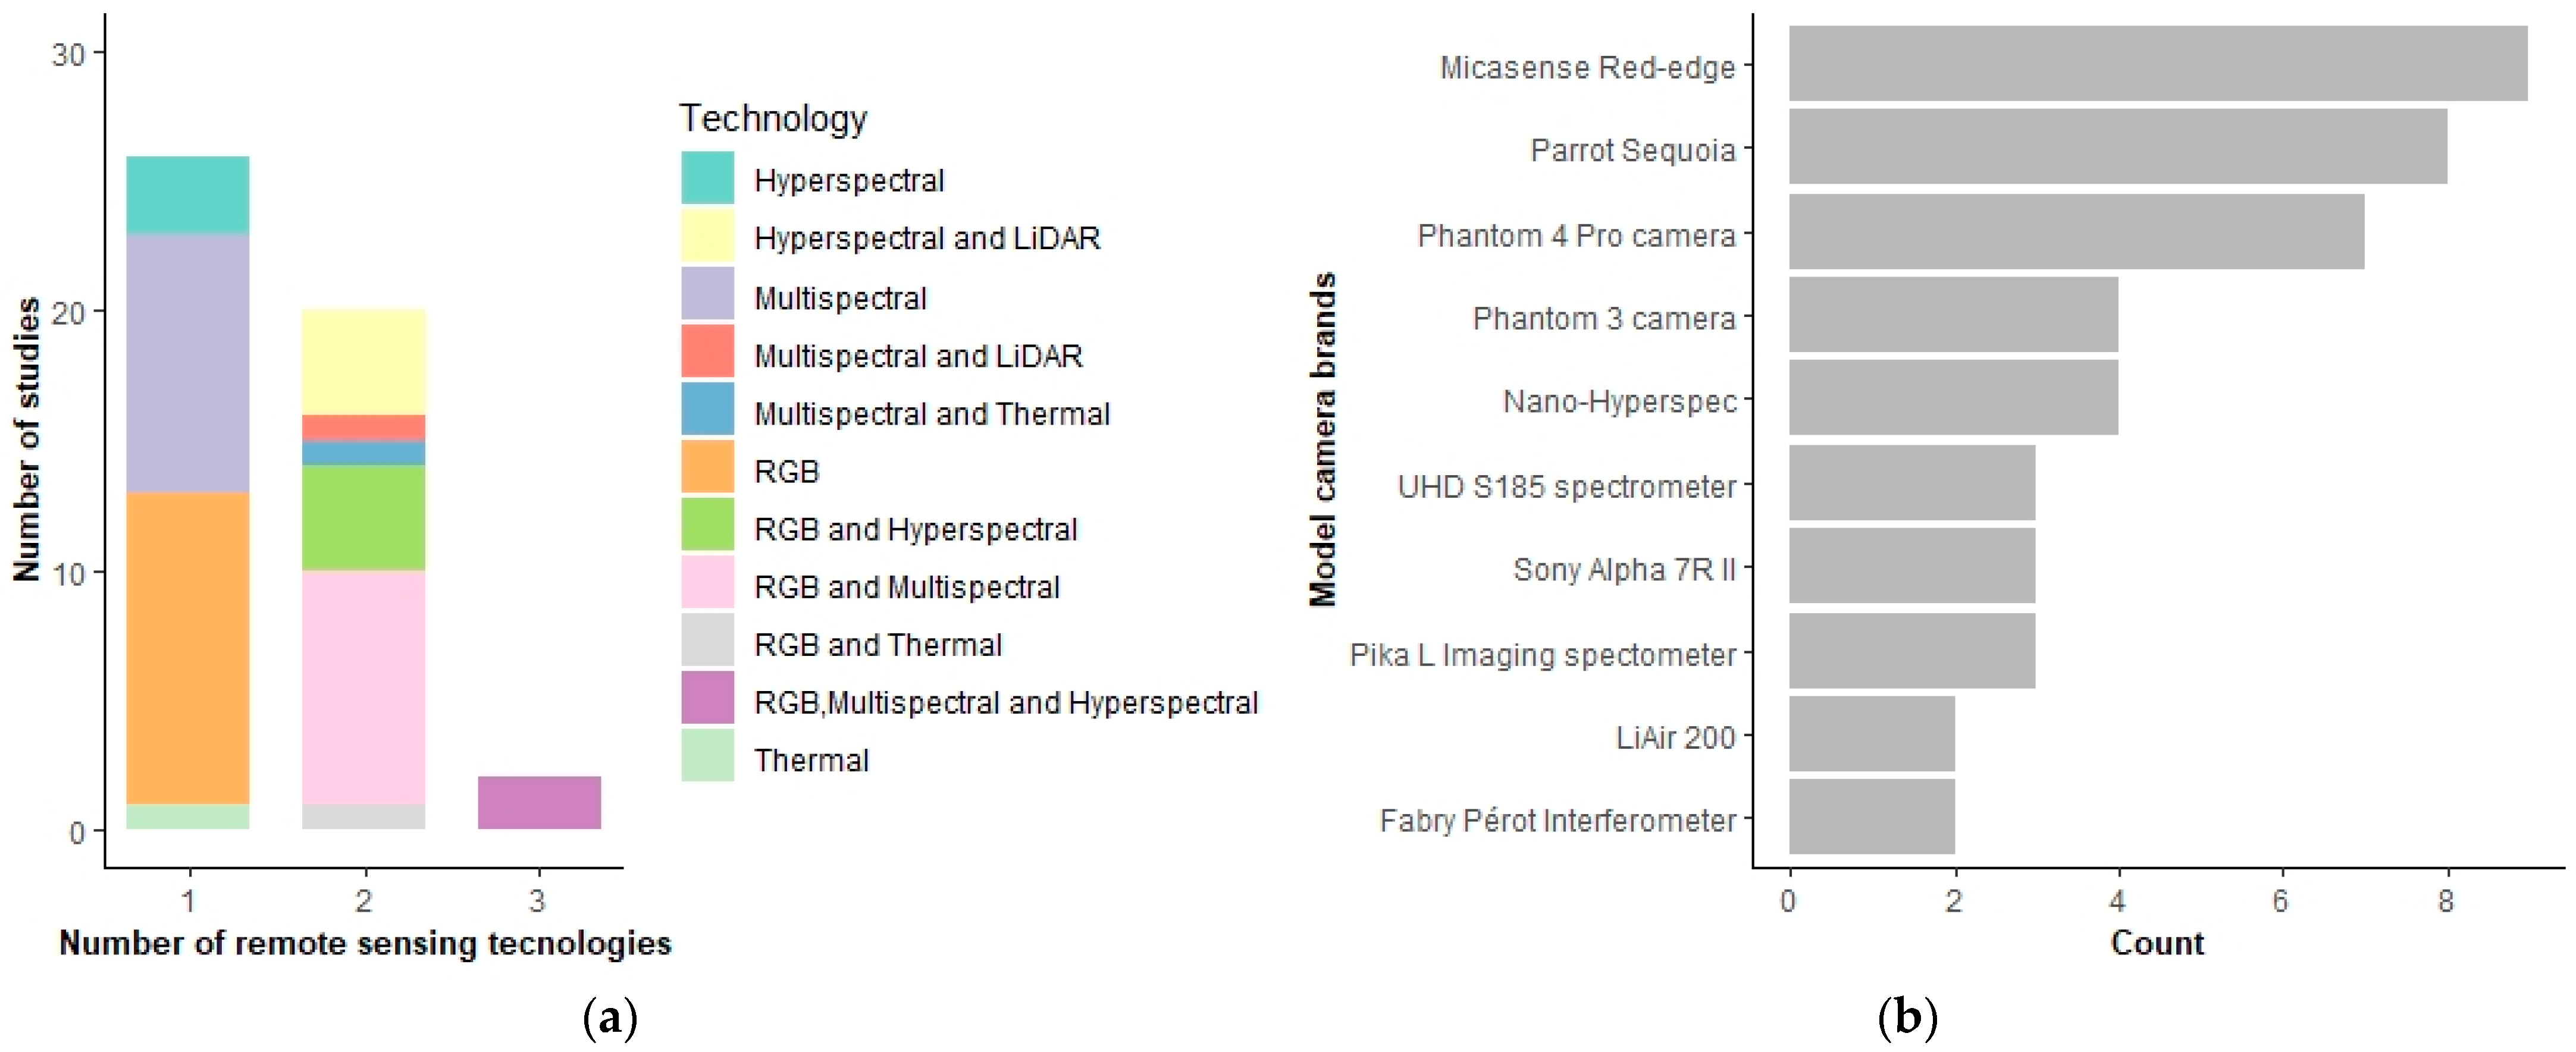
Figure 2. Summary of sensor types, including: (a) types of remote sensing technology identified in each study; (b) top 10 model camera brands.
Concerning the sensor model brands coupled with different UAV architectures, the multispectral cameras Micasense Red-edge and Parrot Sequoia were the most widely used (Figure 2b).
The preferred model brands of the cameras—related to the type and payload of the drones used in FIPD studies—were the DJI Phantom camera, due to the discussed reasons, and the Sony camera, which is known for its quality and specification
[12][37][38][39][40][41]. The Micasense series was the leader of the multispectral cameras, containing five bands that capture data in the RGB, near-infrared, and red-edge regions (400–900 nm). The compact size and weight allow it to be used in a large variety of UAV types. Another preferred multispectral sensor is the Parrot Sequoia, which has a low price when compared with the Micasense series. This camera collects four discrete bands: green, red, red-edge, and NIR (530–810 nm). The interest in this type of camera is due to its ability to obtain information on the state of vegetation, thereby offering the chance calculate vegetation indices, since vegetation is more reflective in the infrared region
[42] for disease detection
[21].
As for the hyperspectral sensors—Nano-Hyperspect, the Pika L. imaging spectrometer, and the UHD S185 spectrometer—these were the most used because they are adopted on a considerable variety of professional drone types. These sensors have a much broader spectrum than multispectral sensors, which allows the discrimination of small changes in pigmentation and minor anomalies
[43], such as water content, and the structure of the tree crown
[38]. For these reasons, their use is growing. Despite this, the authors of
[44] stress that operational efforts, storage needed due to the high dimensional data and noise, and weight
[45] are the main constraints of this type of sensor.
2.2. UAV Data Collection
2.2.1. Area Coverage
The largest mapped area was 16,043 ha, distributed over four sections of 3397 ha, 3825 ha, 5283 ha, and 3537 ha. The smallest area size mapped was 0.12 ha. Eighty seven percent of the studies carried out mappings up to 200 ha, and the remaining were exclusively above 200 ha. The median amount of covered area was 12.25 ha.
2.2.2. Technical Flight Parameters
Table 2 shows the flight height and GSD descriptive statistics by sensor type used in the studies. GSD results from the combination of flight height, focal length, and sensor resolution
[31]. It is crucial to define the camera settings to determine GSD, which corresponds to the distance between pixel centers. The highest flight altitude was 700 m, and the lowest was 20 m performed with a hyperspectral sensor. The median of flight height for thermal sensor was 75 m, and the highest was 100 m using multispectral sensors.
Table 2. Flight height and GSD descriptive statistics by sensor type.
| |
|
Flight Height (m) |
GSD (m) |
| Sensor Type |
No. |
Max |
Min |
Median |
Max |
Min |
Median |
| RGB |
29 |
700 |
30 |
90 |
0.080 |
0.015 |
0.028 |
| Multispectral |
27 |
200 |
50 |
100 |
0.170 |
0.020 |
0.070 |
| Hyperspectral |
12 |
140 |
20 |
95 |
0.560 |
0.047 |
0.200 |
| Thermal |
4 |
122 |
60 |
75 |
0.980 |
0.150 |
0.211 |
In terms of GSD, the maximum value was 0.98 m with the thermal sensor, and the minimum was 0.015 m, acquired by an RGB sensor. The median flight height for thermal sensors’ was 75 m, and the highest was 100 m for the multispectral sensors. The RGB sensors’ median GSD was 0.028 m, and the highest was 0.211 m with the thermal sensors.
2.3. Data Processing and Analytical Methods
2.3.1. Spatial Unit Analysis
Object-based approach and pixel-based approach are c
ommonly used methods. As a minimal unit in a digital image, pixels may be used for every scale study. However, only spectral properties are considered in analytical methods, while object-based approaches are performed using segmentation approaches that group objects based on statistical or feature similarities. This approach is mainly performed before feature extraction and applying classifiers, since these methods cannot add contextual information
[28].
2.3.2. Segmentation of Single Tree Objects
Table 3 summarizes the segmentation single tree methods.
Table 3. Summary of segmentation single tree methods in the studies.
| Segmentation Single Tree |
Method |
Synopsis |
Studies |
| Manually |
Manually segmented trees |
Digitalization of each tree crown above imagery using GIS software. |
[15][34][39][46][47][48][49][50][51][52][53] |
| Local maxima filter and Buffer |
Local maxima filter within a rasterized CHM to detect the treetops, then a buffer applied on the treetop using GIS software. |
[37][46][54][55][56] |
| Raster-based |
Mean shift algorithm |
GEOBIA method. Multispectral image segmentation using ArcGIS segment mean shift tool. |
[57] |
| Multiresolution segmentation |
GEOBIA method. Multispectral image segmentation using eCognition software multiresolution segmentation tool. |
[12][58][59] |
| Local maxima filter and mean shift algorithm |
Local maxima of a sliding window using the brightness of the multispectral image. Then, the select by location tool is used between treetops and for large-scale mean shift algorithm segments (GEOBIA). |
[60] |
| Safonova et al. Wavelet-based local thresholding |
Tree crown delineation using RGB images. The steps are contrast enhancement, crown segmentation based on wavelet transformation and morphological operations, and boundary detection. |
[61] |
| Safonova et al. Treetop detection |
RGB images are transformed into one grey-scale band image; next, the grey-scale band image is converted into a blurred image; finally, the blurred image is converted into a binary image. |
[62] |
| Voronoi Tesselations |
Local maxima filter within a rasterized CHM calculates the treetops and then uses a Voronoi tessellation algorithm [63]. |
[64] |
| Dalponte individual tree segmentation |
Local maxima within a rasterized CHM calculates the treetops and then uses a region-growing algorithm for individual segmentation [65][66]. |
[47][67] |
| Watershed segmentation |
Vicent and Soille original algorithm [68]. When the CHM is inverted, tree tops or vegetation clusters look like “basins”. |
[69] |
| Marker-controlled watershed [70]. Marker and segmentation functions are used for multi-tree identification and segmentation using rasterized CHM [71]. |
[47][72] |
| Binary watershed analysis and the Euclidean distance using rasterized CHM or NIR band. |
[52][73] |
| Hyyppä et al. [74] methodology. |
[43] |
| Nyguen Treetops in nDSM data |
Based on pixel intensity, an iterative sliding window is passed over the nDSM. Finally, the refinement is applied to eliminate treetops that are too close to each other. |
[75] |
| Vector-based |
3D region-growing algorithm |
3D region-growing algorithm applied in a point cloud (LiDAR or photogrammetric) using a built-in function for treetop detection [76]. |
[47][52][77] |
| 3D segmentation of single trees |
Point cloud-based method with tree segmentation using a normalized cut algorithm [78]. |
[79] |
| Voxel-based single tree |
Lidar point cloud data are converted into voxels in order to estimate the leaf area density and the construction of the 3D forest scene. |
[77] |
2.3.3. Feature Extraction and Selection
Table 4 summarizes the feature extraction techniques for UAV imagery applied in the studies.
Table 4. Summary of feature extraction techniques of UAV imagery applied in the studies.
| Feature Type |
Description |
Studies |
| Spectral features |
Statistics of original bands, ratios between bands, vegetation indices |
[12][15][34][37][38][39][41][43][44][46][47][48][49][50][51][52][53][54][55][56][57][58][59][60][67][69][72][73][77][79][80][81][82][83][84][85][86][87][88][89] |
| Textural features |
Gray level co-occurrence matrix (GLCM), grey level difference vector (GLDV) |
[51][54][72] |
| Linear transformations |
Hue, saturated and intensity (HSI), principal component analysis (PCA) |
[38][52][58] |
| Geo-auxiliary |
Original and normalized digital surface models (DSM) such as digital elevation models (DEM), canopy height models (CHM), slope, aspect, height percentiles |
[12][46][47][48][51][54][56][64][72][75][77][79][84][86][88] |
| Multisensor |
Inclusion of data obtained from different sensors in analytical methods |
[52][55][79][80][84] |
| Multitemporal |
Inclusion of multitemporal data classification in analytical methods |
[15][34][54][67][73] |
2.3.4. Analysis Type, Algorithms, and Overall Accuracy (OA)
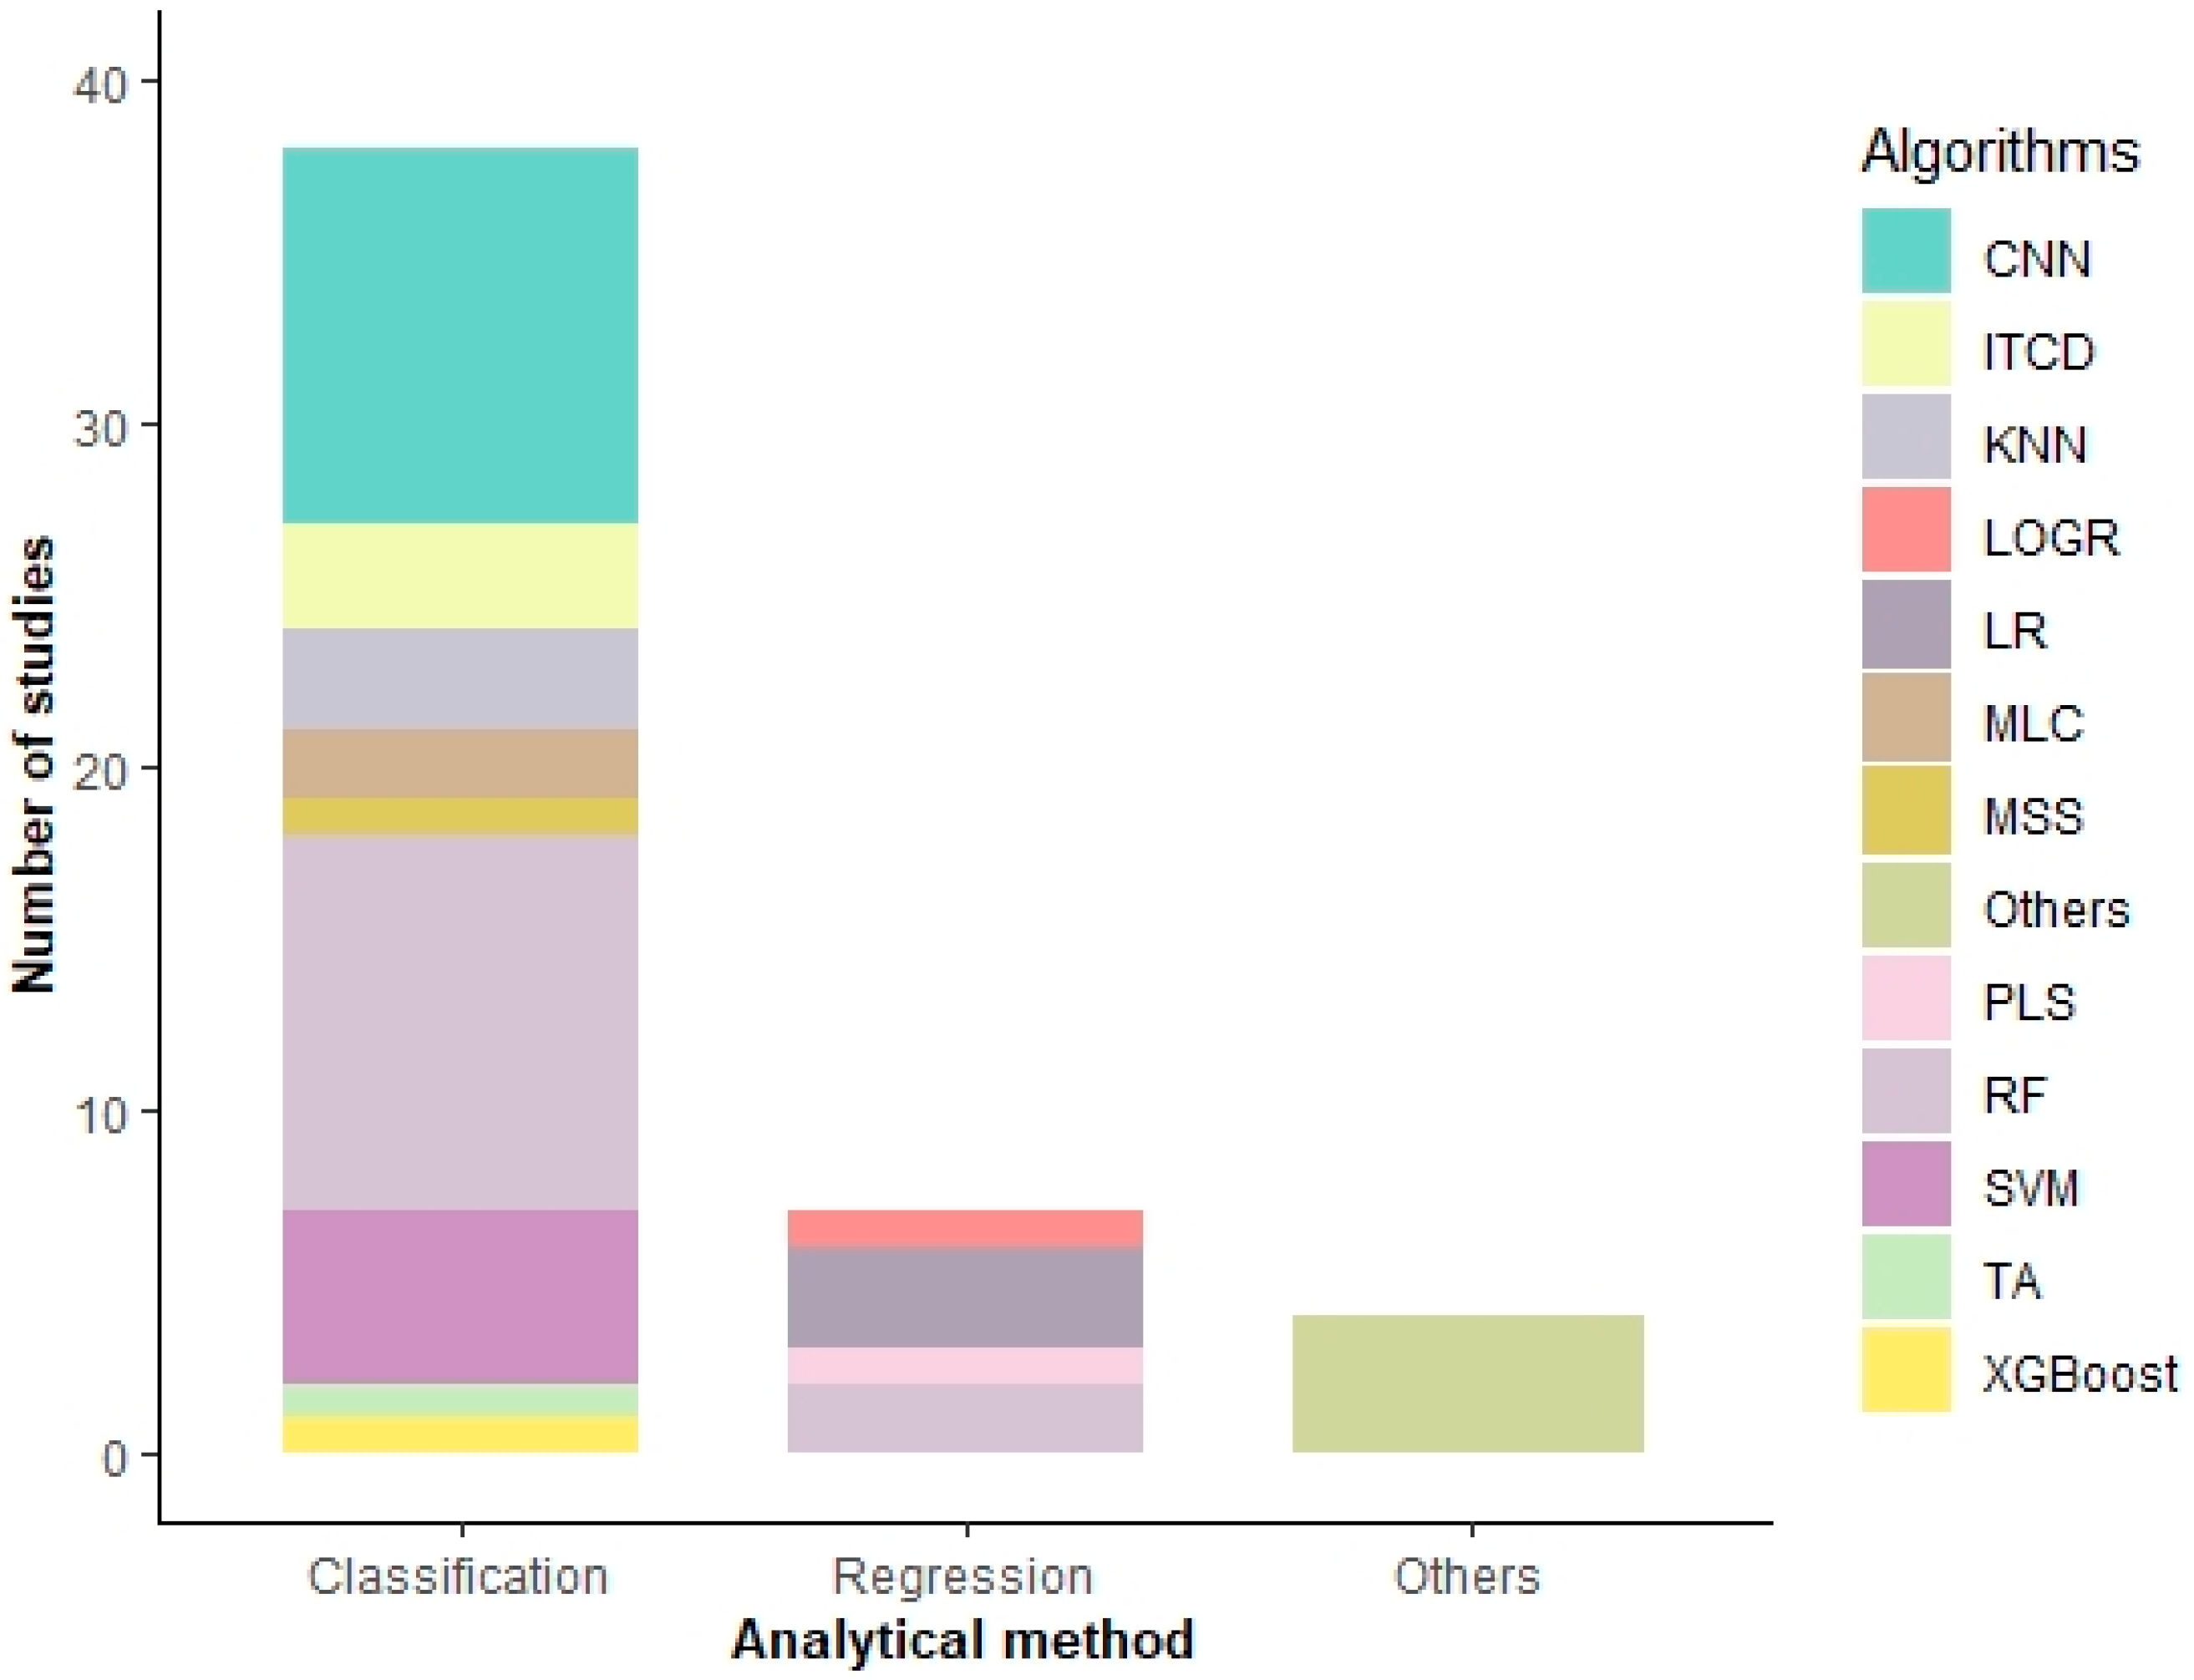
Figure 3 summarizes the algorithms used by the analysis method.
Figure 3. Summary of the algorithms used in the studies: CNN: convolutional neural network; ITCD: individual tree crown delineation; KNN: K-nearest neighbor; LOGR: logistic regression; LR: linear regression; MLC: maximum likelihood; MSS: multiscale segmentation; PLS: partial least squares; RF: random forest; SVM: support vector machine; TA: thresholding analysis; XGBoost: eXtreme gradient boosting.
The classification approach is broadly used for quantifying trees. Regarding the analysis methods, most of the studies used a classification approach. Regression studies focus on a different level of damage and provide statistical significance for regression coefficients and the relation between classes. Statistical methods, physically based models such as radiosity applicable to porous individual objects to calculate different vegetation variables, and specific frameworks were also used to estimate the level of damage.
 +1 credit