 +1 credit
| Version | Summary | Created by | Modification | Content Size | Created at | Operation |
|---|---|---|---|---|---|---|
| 1 | Stefan Bluml | -- | 4518 | 2022-06-22 20:20:38 | | | |
| 2 | Beatrix Zheng | Meta information modification | 4518 | 2022-06-27 04:19:56 | | | | |
| 3 | Beatrix Zheng | + 89 word(s) | 4607 | 2022-06-27 09:03:24 | | | | |
| 4 | Beatrix Zheng | Meta information modification | 4607 | 2022-06-27 09:04:19 | | | | |
| 5 | Beatrix Zheng | -17 word(s) | 4590 | 2022-07-01 05:06:54 | | |
Video Upload Options
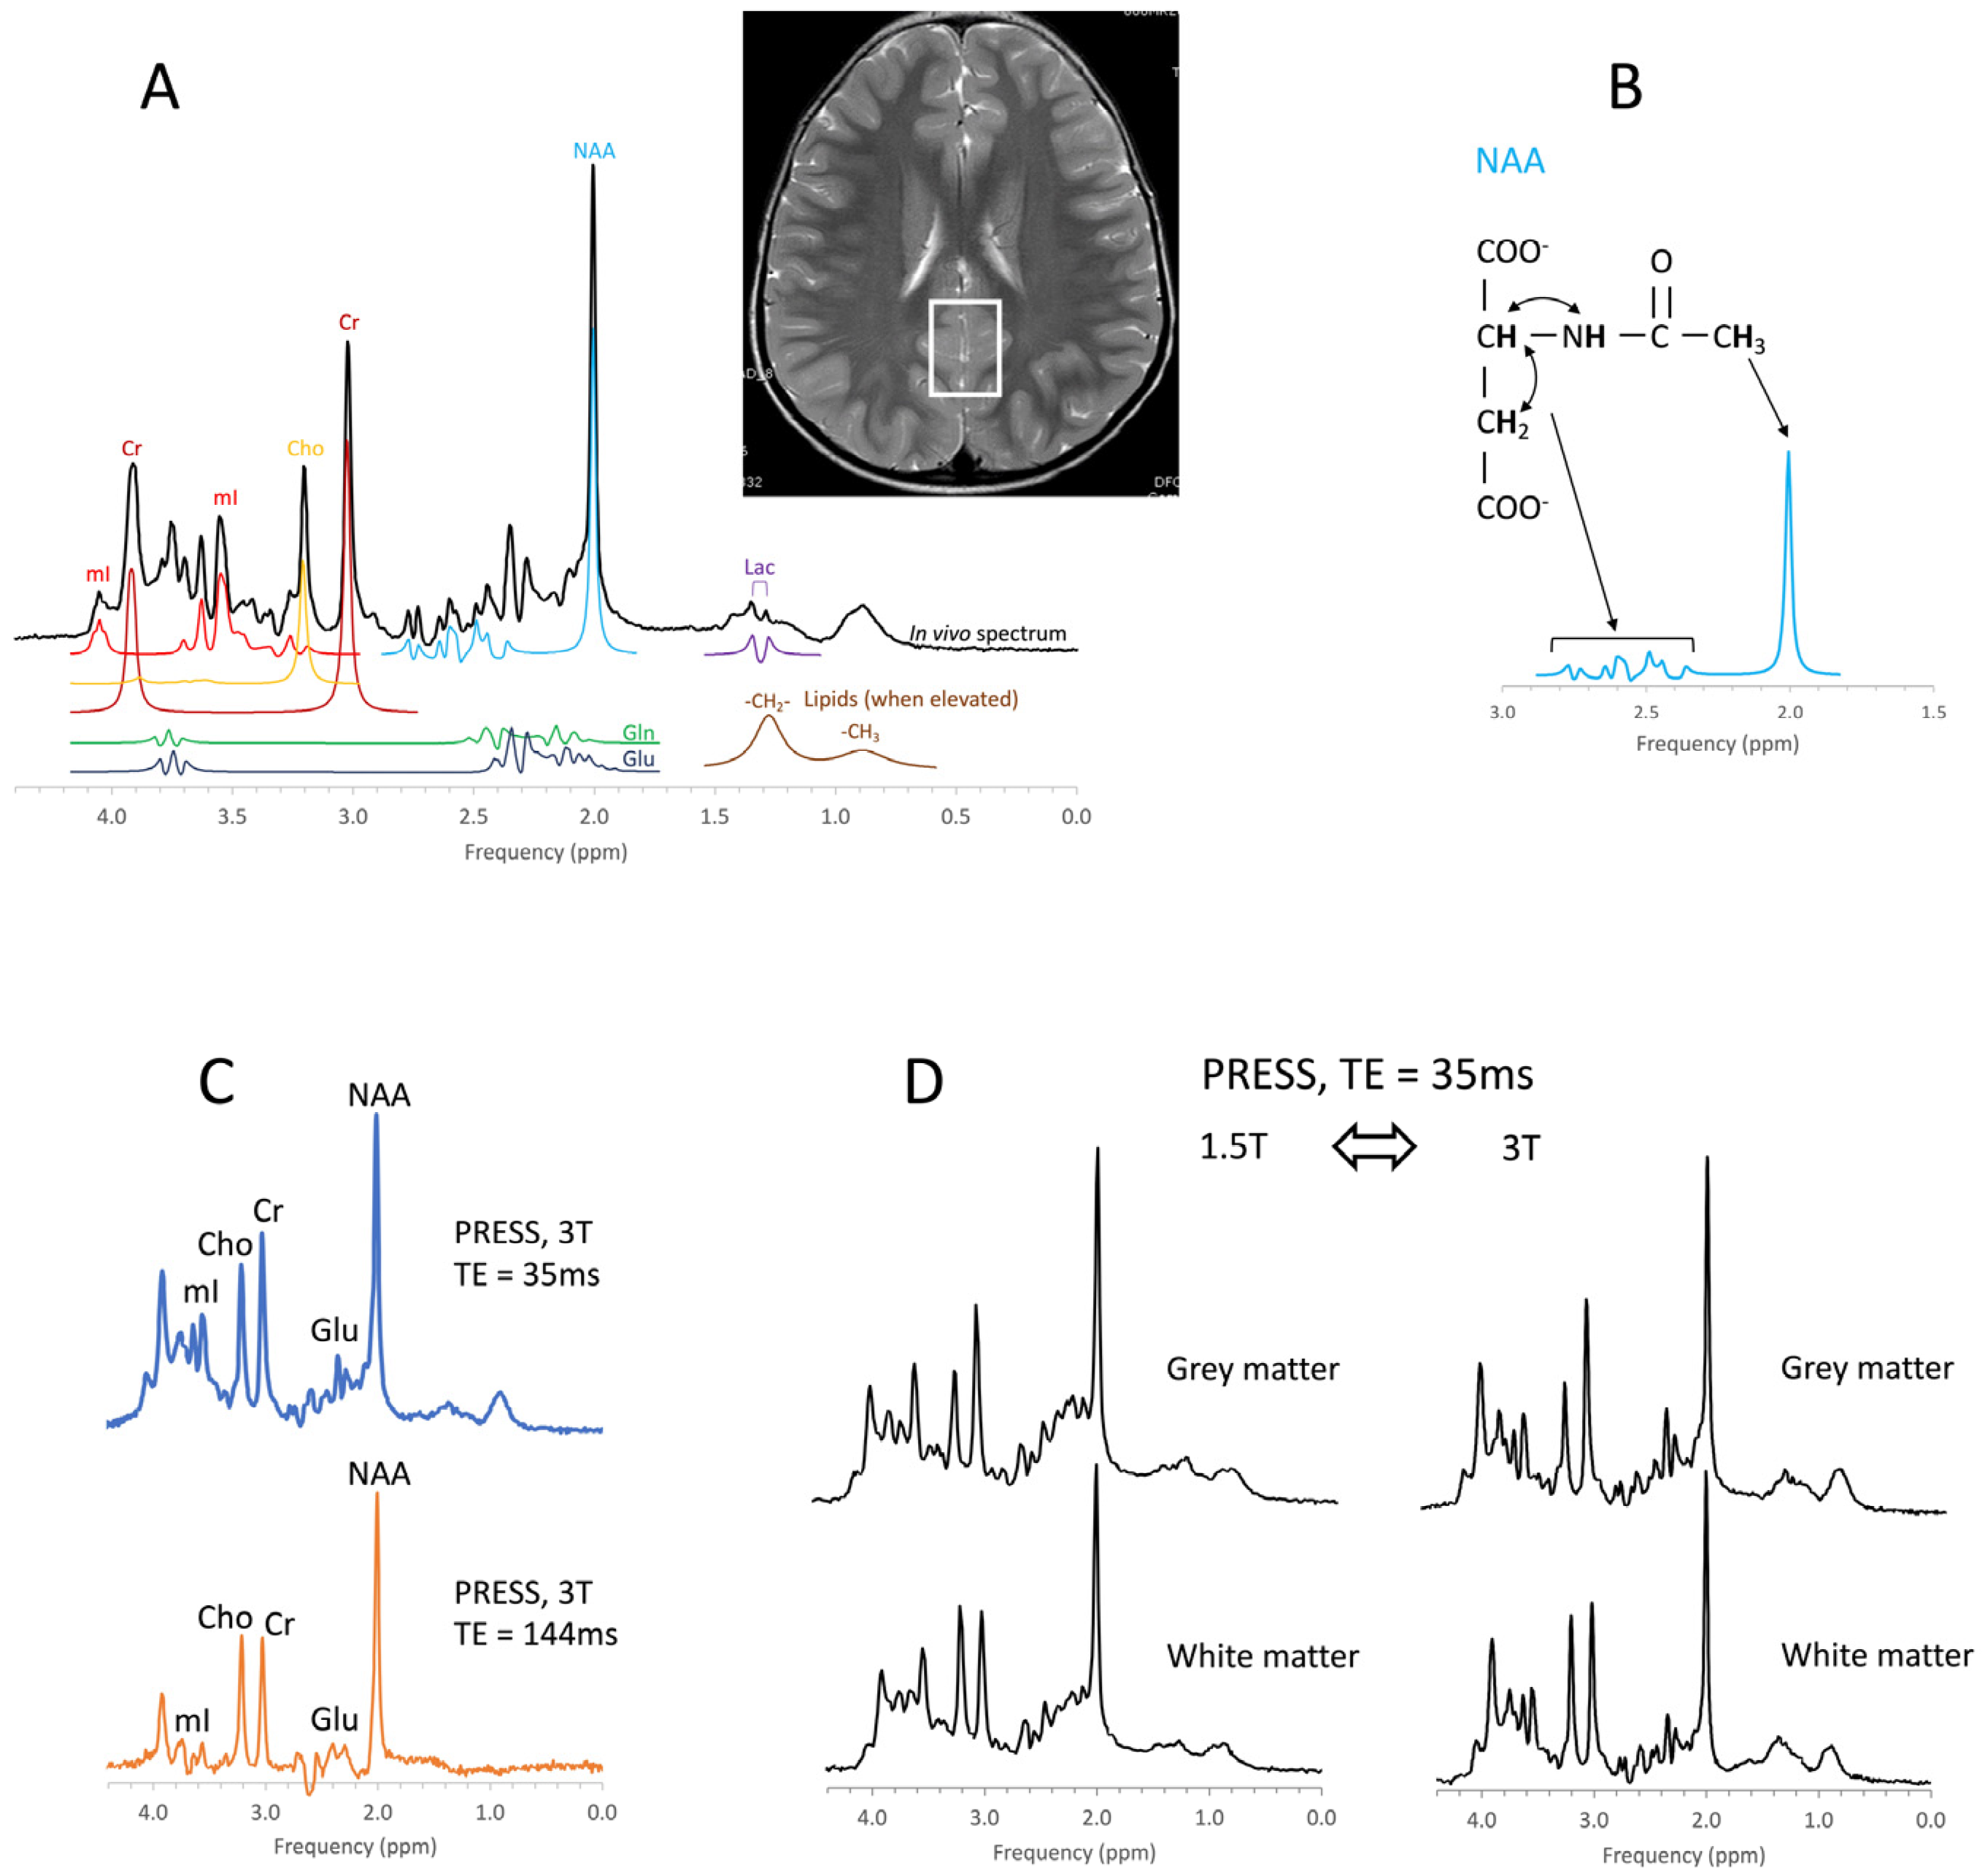
In vivo MR spectroscopy is a non-invasive methodology that provides information about the biochemistry of tissues. It is available as a “push-button” application on state-of-the-art clinical MR scanners. MR spectroscopy has been used to study various brain diseases including tumors, stroke, trauma, degenerative disorders, epilepsy/seizures, inborn errors, neuropsychiatric disorders, and others.
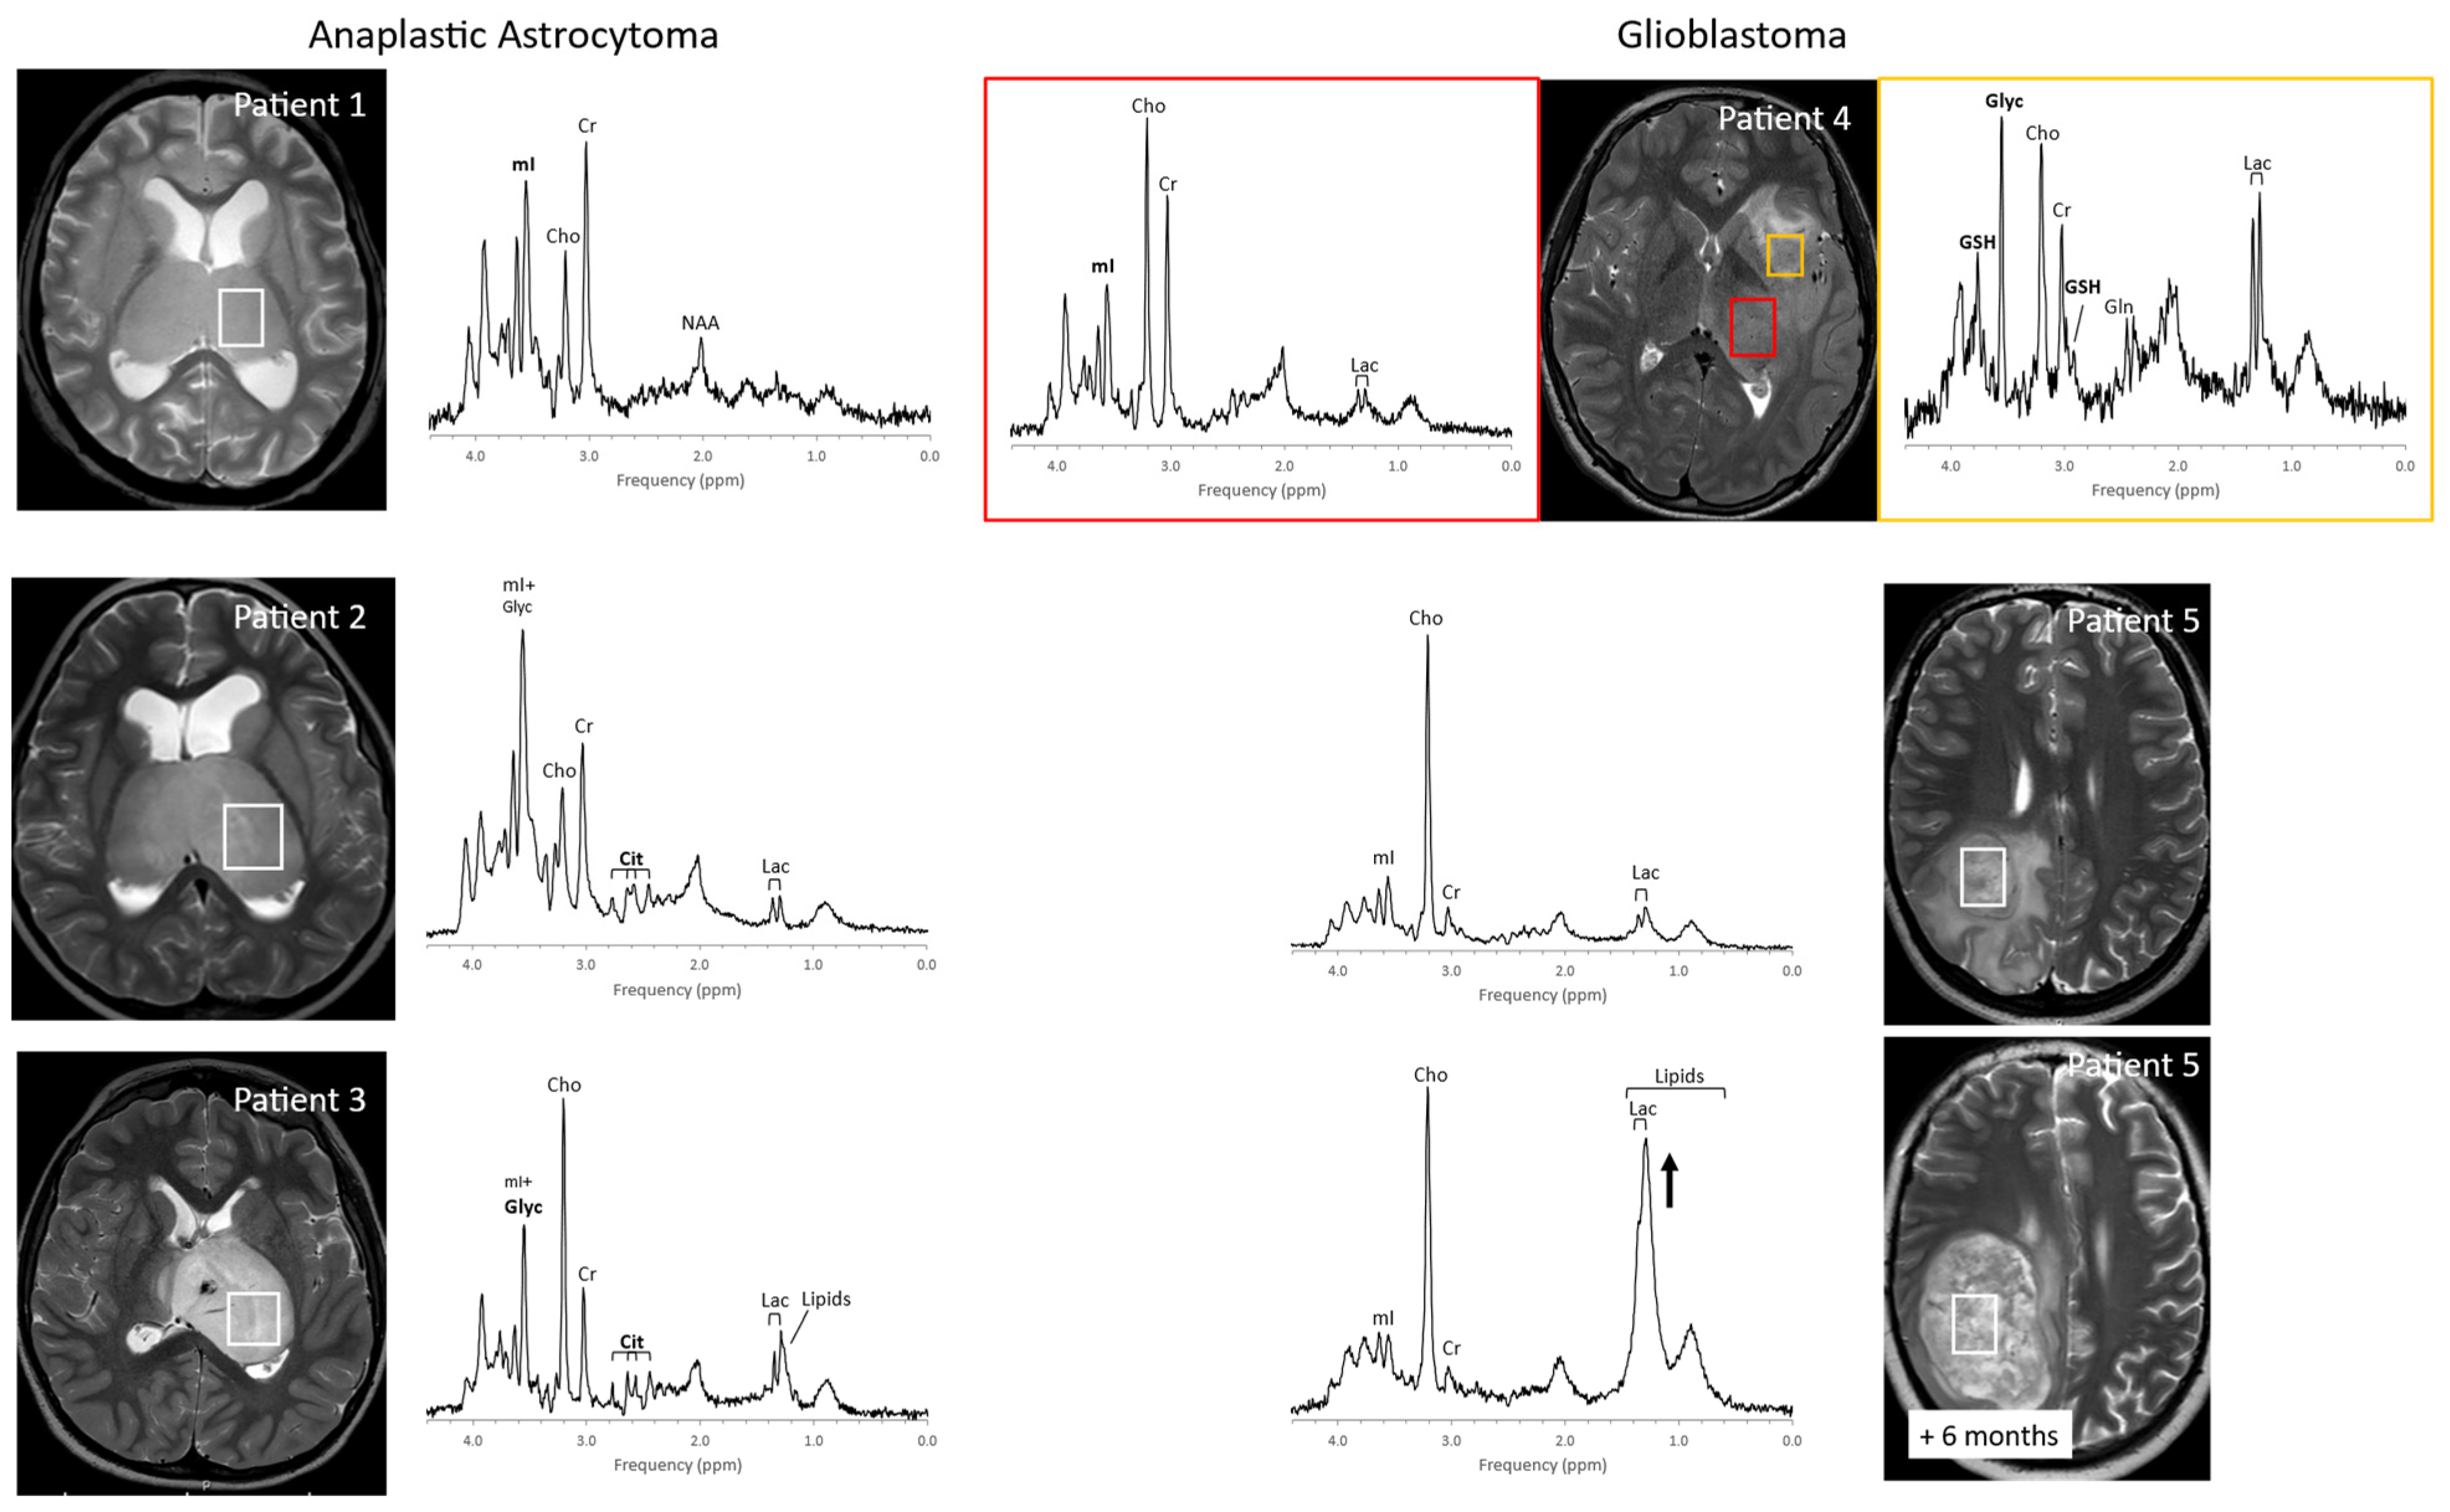
1. Pediatric Brain Tumors
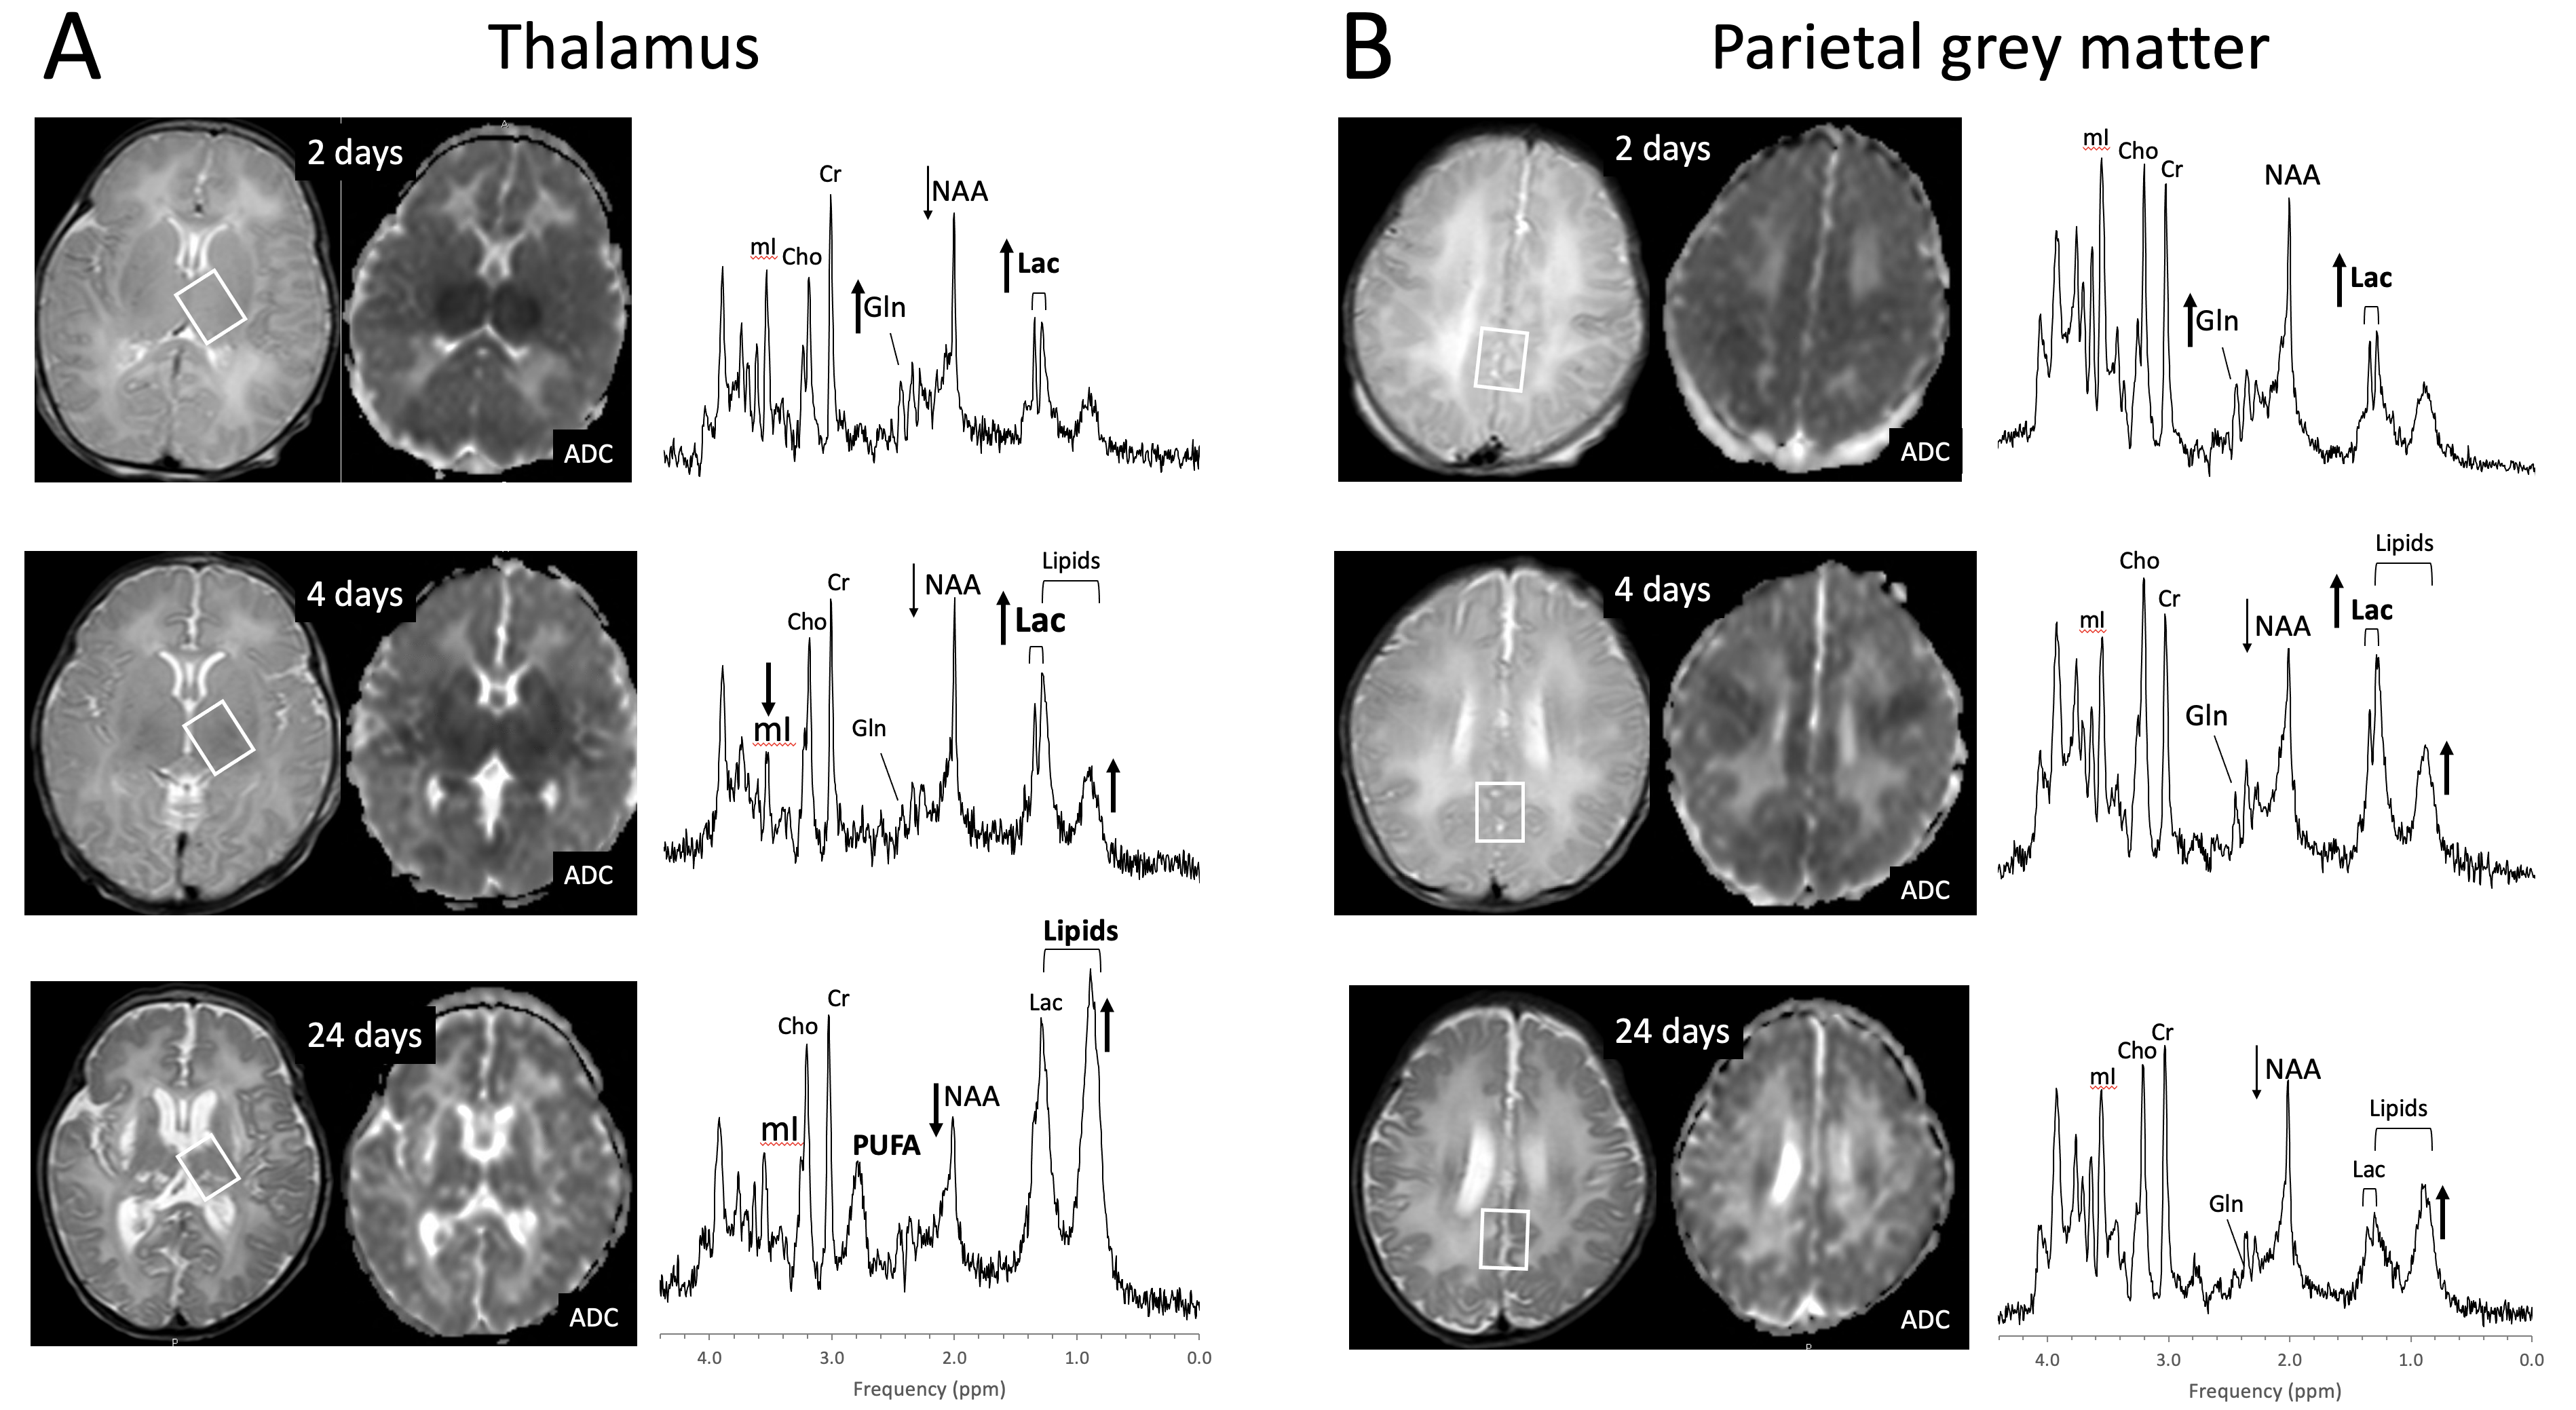
2. Perinatal Hypoxic–Ischemic Encephalopathy
3. Inborn Errors of Metabolism
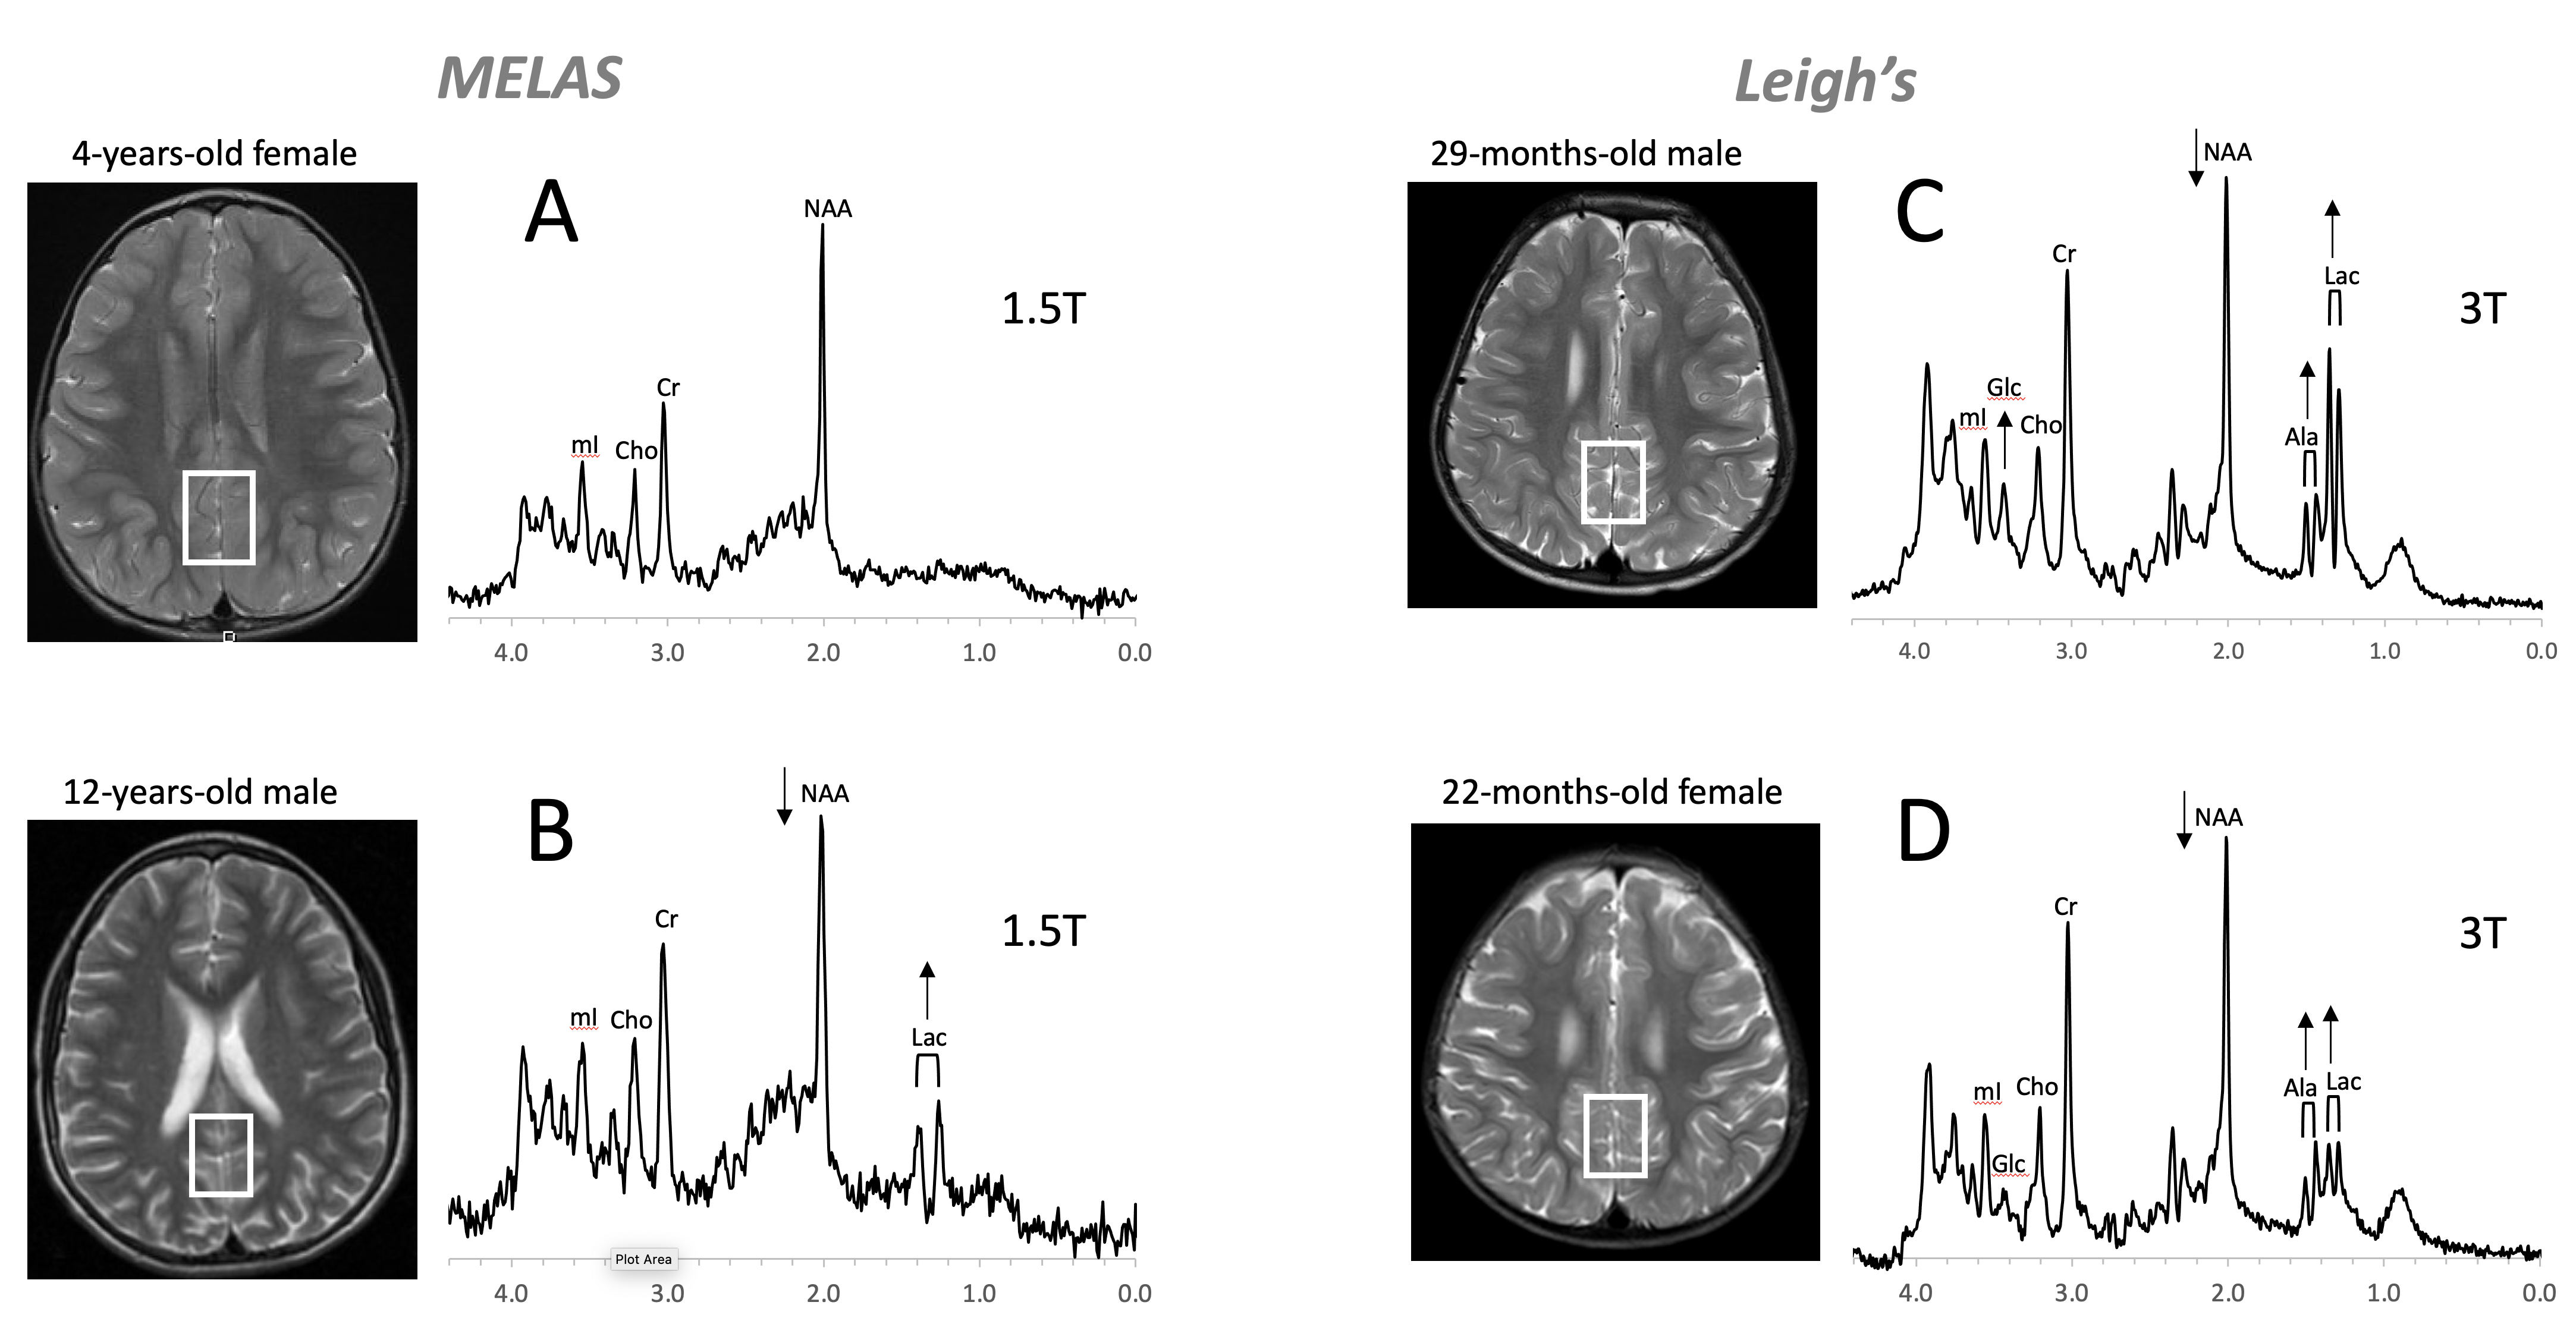
Figure 8. Mitochondrial disorders. MRS of parieto/occipital gray matter of mild form of MELAS (mitochondrial encephalomyopathy, lactic acidosis, and stroke-like episodes) with an unremarkable MRI is essentially normal with no evidence for elevated lactate (Lac) (A). In contrast, Lac is readily detectable in another MELAS patient with a borderline normal MRI. Note that NAA (relative to Cr) is reduced in this patient (B). MR spectra of two patients diagnosed with Leigh’s syndrome (siblings) are shown on the right. In addition to Lac, alanine (Ala) is elevated. In both spectra, NAA is reduced, and glucose (Glc) seems to accumulate in the upper spectrum (C,D). Spectra were acquired with SV-PRESS, TE = 35 ms, TR = 1.5 s on a 1.5T scanner (A,B) and TE = 35 ms, TR = 2 s on a 3T scanner (C,D).
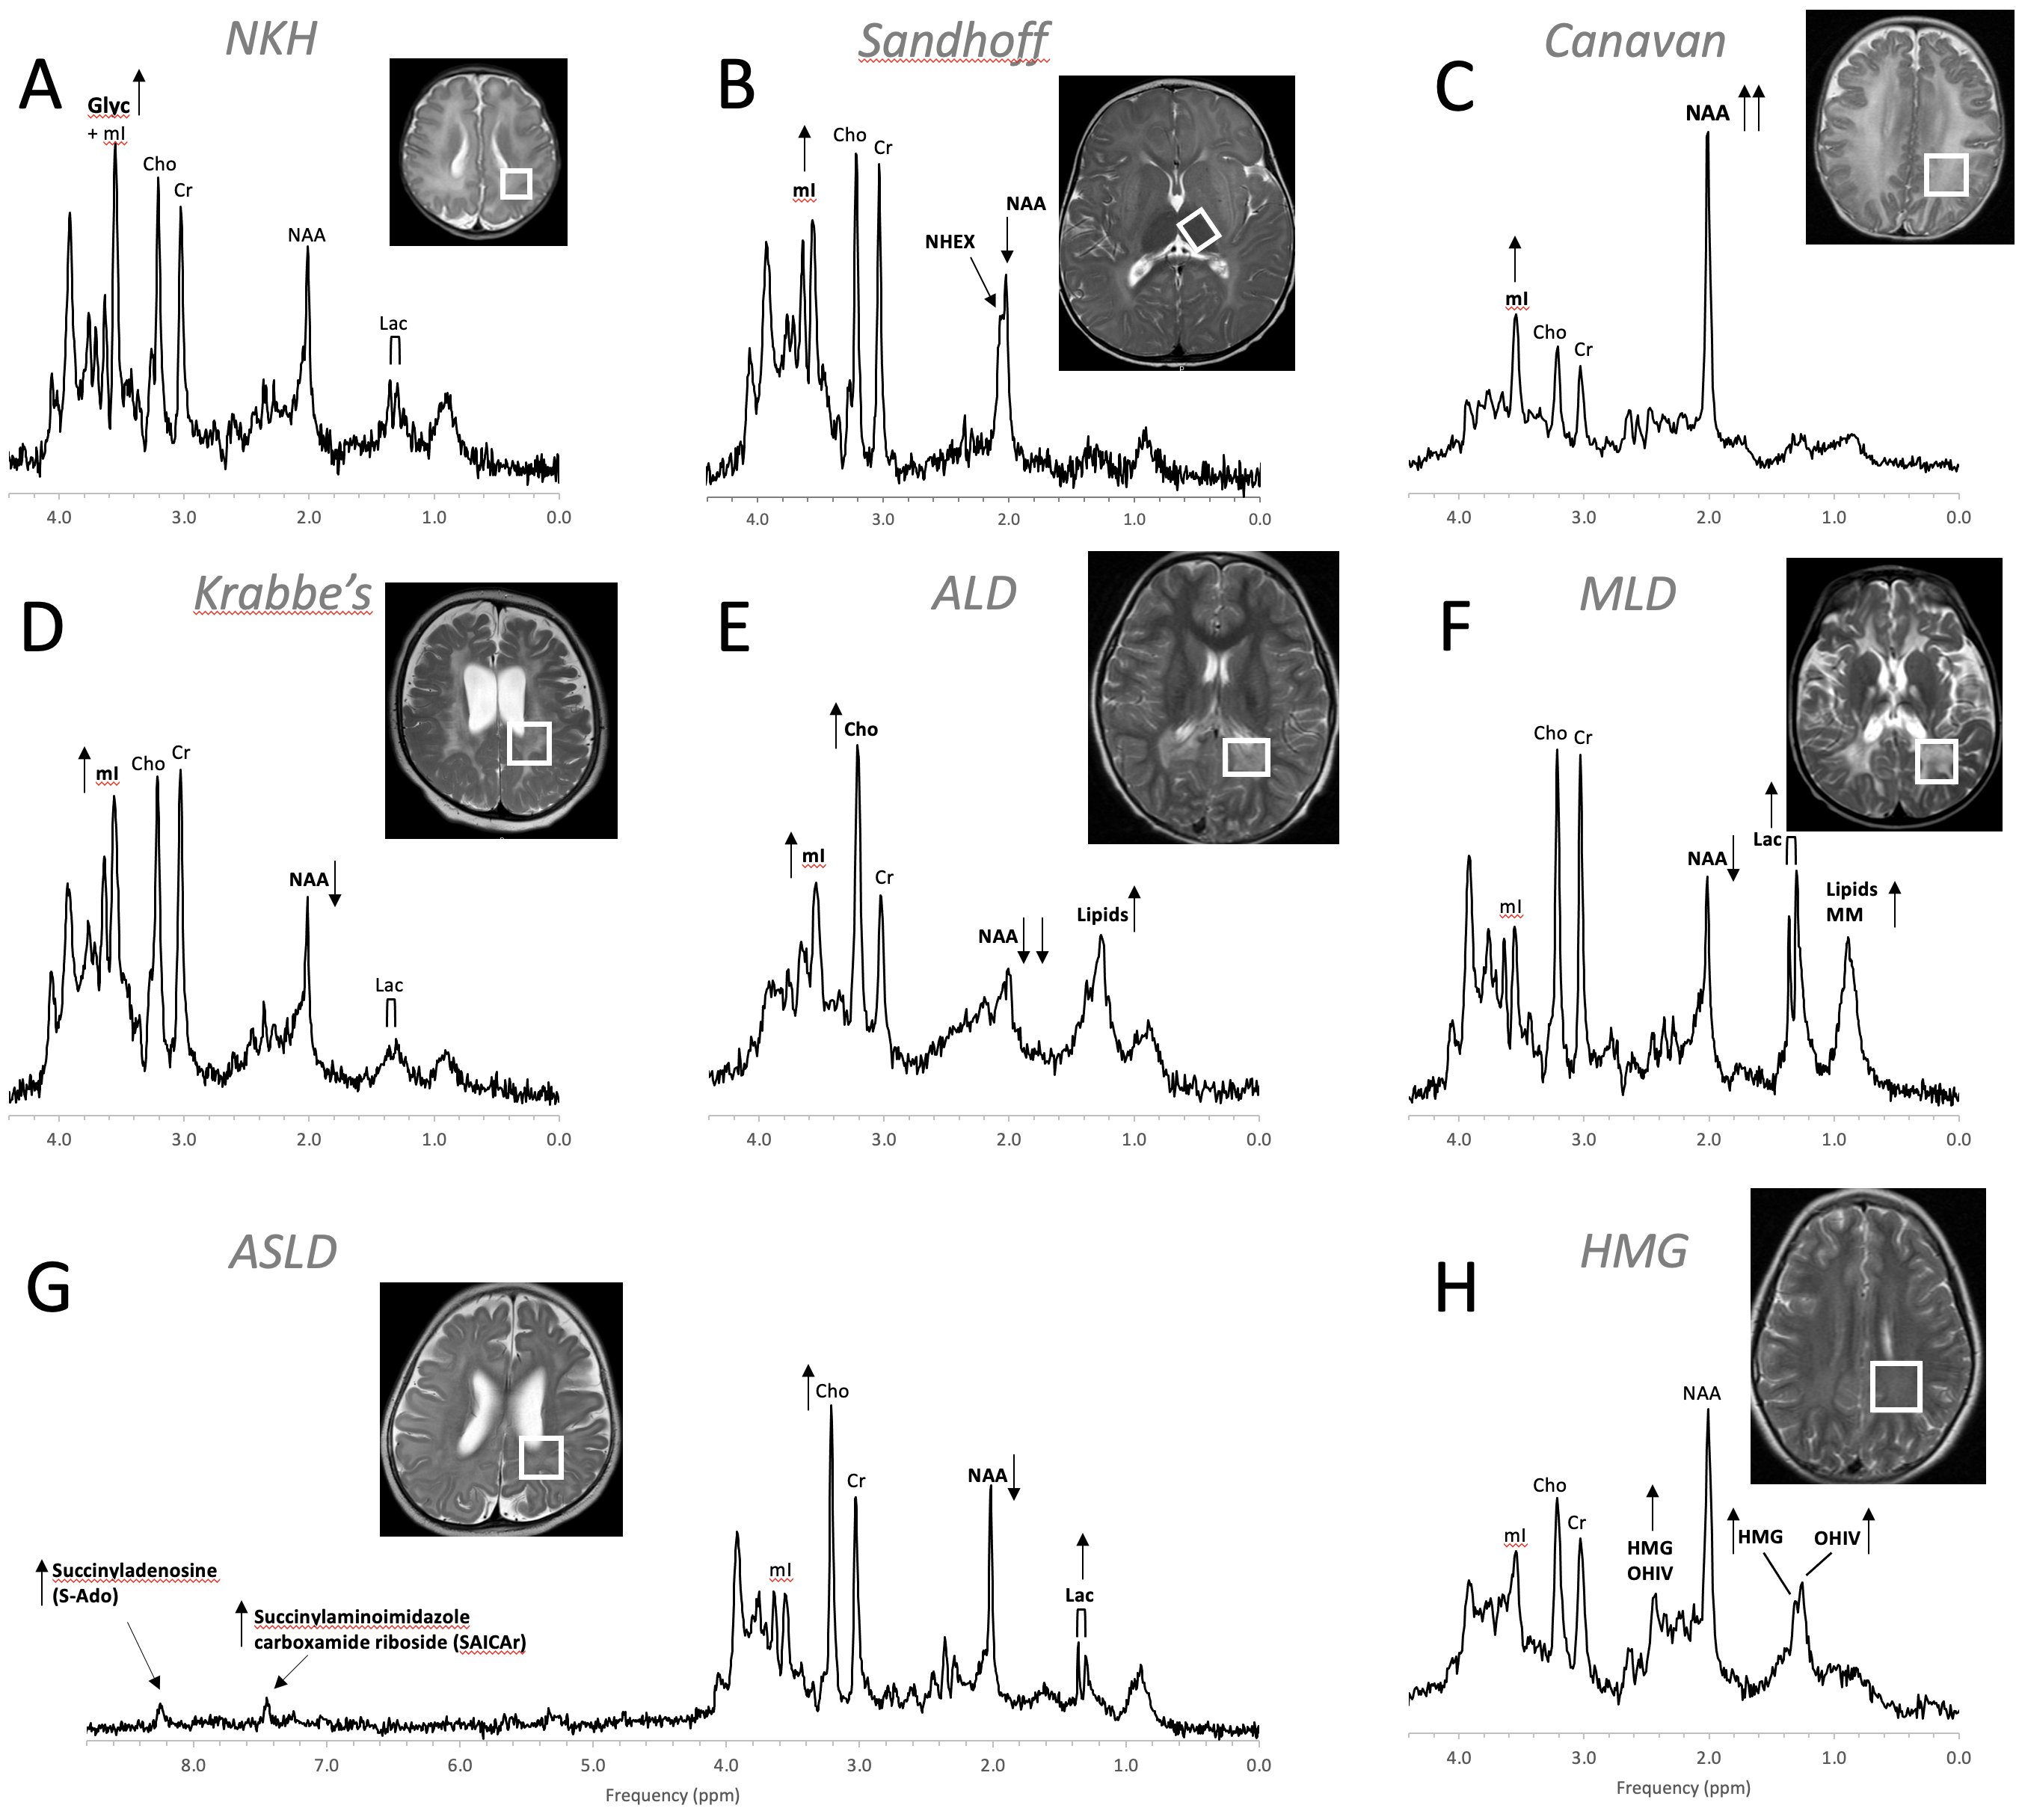
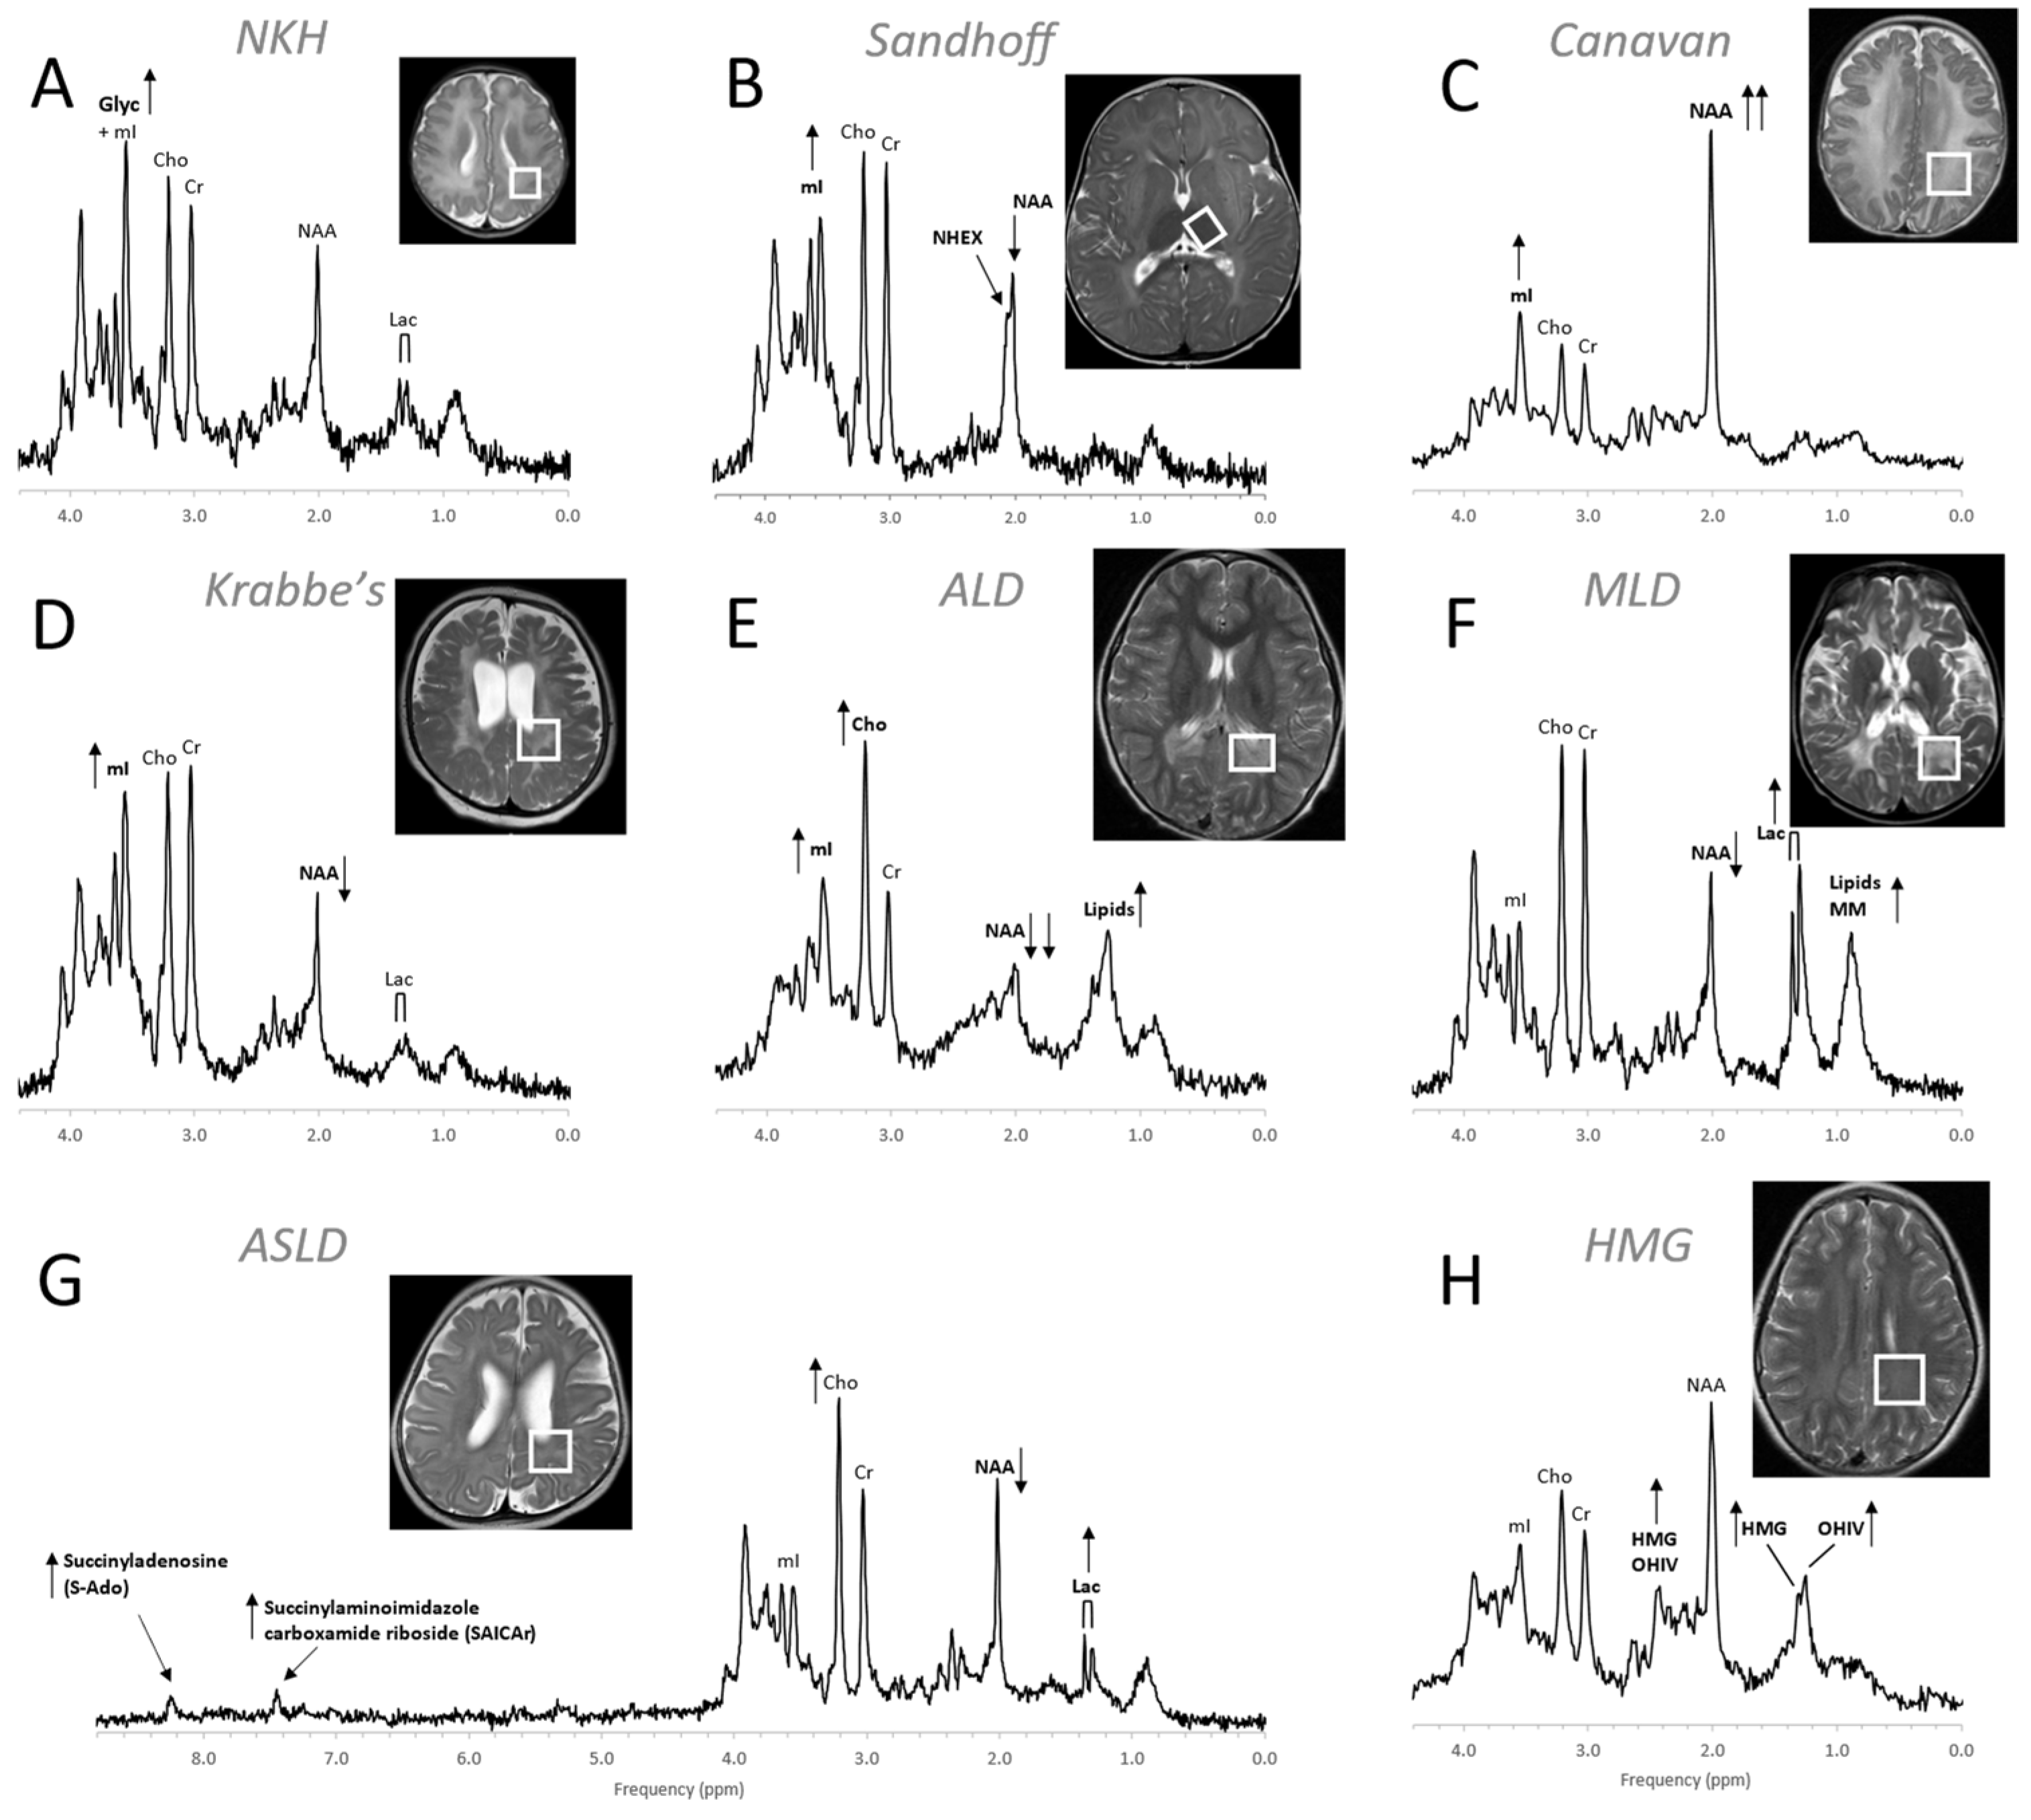
Figure 9. MR spectra of various inborn errors of metabolism. (A) Non-ketotic hyperglycinemia (NKH): A 15-day-old male newborn examined to confirm suspicion of acute NKH. The elevated glycine (Glyc) signal is consistent with hyperglycinemia, an amino aciduria in which a defect of the enzyme that breaks down glycine results in the abnormal accumulation of glycine in tissue. Note that for a 15-day-old newborn, the NAA and Lac signals are within normal. Other metabolic features are also unremarkable when adjusted for age. For the above patient, the MR images were mostly unremarkable. (B) Sandhoff disease: A 14-month-old female presenting with global developmental delay and hypotonia with delayed myelination and diffuse white matter abnormalities. The signal at approximately ≈2.07 ppm has been assigned to N-acetylhexosamine (NHEX), specific for Sandhoff disease . In addition, elevated mI and reduced NAA is noted. (C) Canavan disease: Canavan disease is a leukodystrophy where a defect in aspartoacylase (ASPA), the enzyme that breaks down N-acetylaspartate (NAA), results in excessive accumulation of NAA. In above spectrum, myo-inositol (mI) is also elevated. The MR images of the 6-month-old male patient showed significant diffuse white and gray matter abnormalities. (D) Krabbe’s leukodystrophy: Krabbe’s leukodystrophy is a lipid storage disorder caused by a deficiency of galactocerebrosidase (GALC), the enzyme required for the breakdown of the sphingolipids, galactosylceremide and psychosine. MR images of a 3-year-old child with Krabbe’s leukodystrophy demonstrate white matter dysmyelination and loss. MRS of white matter show a significant reduction of NAA and elevated mI. (E) Adrenoleukodystrophy (ALD): ALD is caused by mutations in the ABCD1 genes. In vivo MRS of affected the white matter in a 5-year-old male shows, relative to creatine (Cr), elevated lipids, depleted NAA, elevated choline (Cho), and elevated mI. Note that the spectrum carries some similarities with the spectra of gliosis and gliomas. (F) Metachromatic leukodystrophy (MLD): In MLD the accumulation of sulfatides causes the destruction of the myelin sheath. MR images show profoundly abnormal white matter. The MR spectrum shows elevated lipids and macromolecules (MM), elevated Lac, and reduced NAA. (G) Adenylosuccinate lyase deficiency (ASLD): ASLD causes the buildup of succinylaminoimidazole carboxamide riboside (SAICA riboside) and succinyladenosine (S-Ado), which are detectable at 7.5 and 8.3 ppm. In addition, in this patient, Lac is elevated, NAA is reduced, and Cho is elevated relative to Cr. The MR images of the 17-month-old female showed general volume loss and hypomyelination. (H) 3-hydroxy-3-methylglutaric acid (HMG) CoA lyase deficiency: In HMG CoA lyase deficiency, cells are unable to process leucine and synthesize ketone bodies. The MR images of this 12-year-old female were mildly abnormal. The MR spectrum acquired in parietal white matter demonstrates accumulation of HMG and of 3-hydroxy isovaleric acid (OHIV). All spectra were acquired on clinical 1.5T (C,E,) or 3T scanners (A,B,D,F,G) with SV-PRESS sequence, TE = 35 ms, and TR = 1.5 s (1.5T) or TR = 2 s (3T).
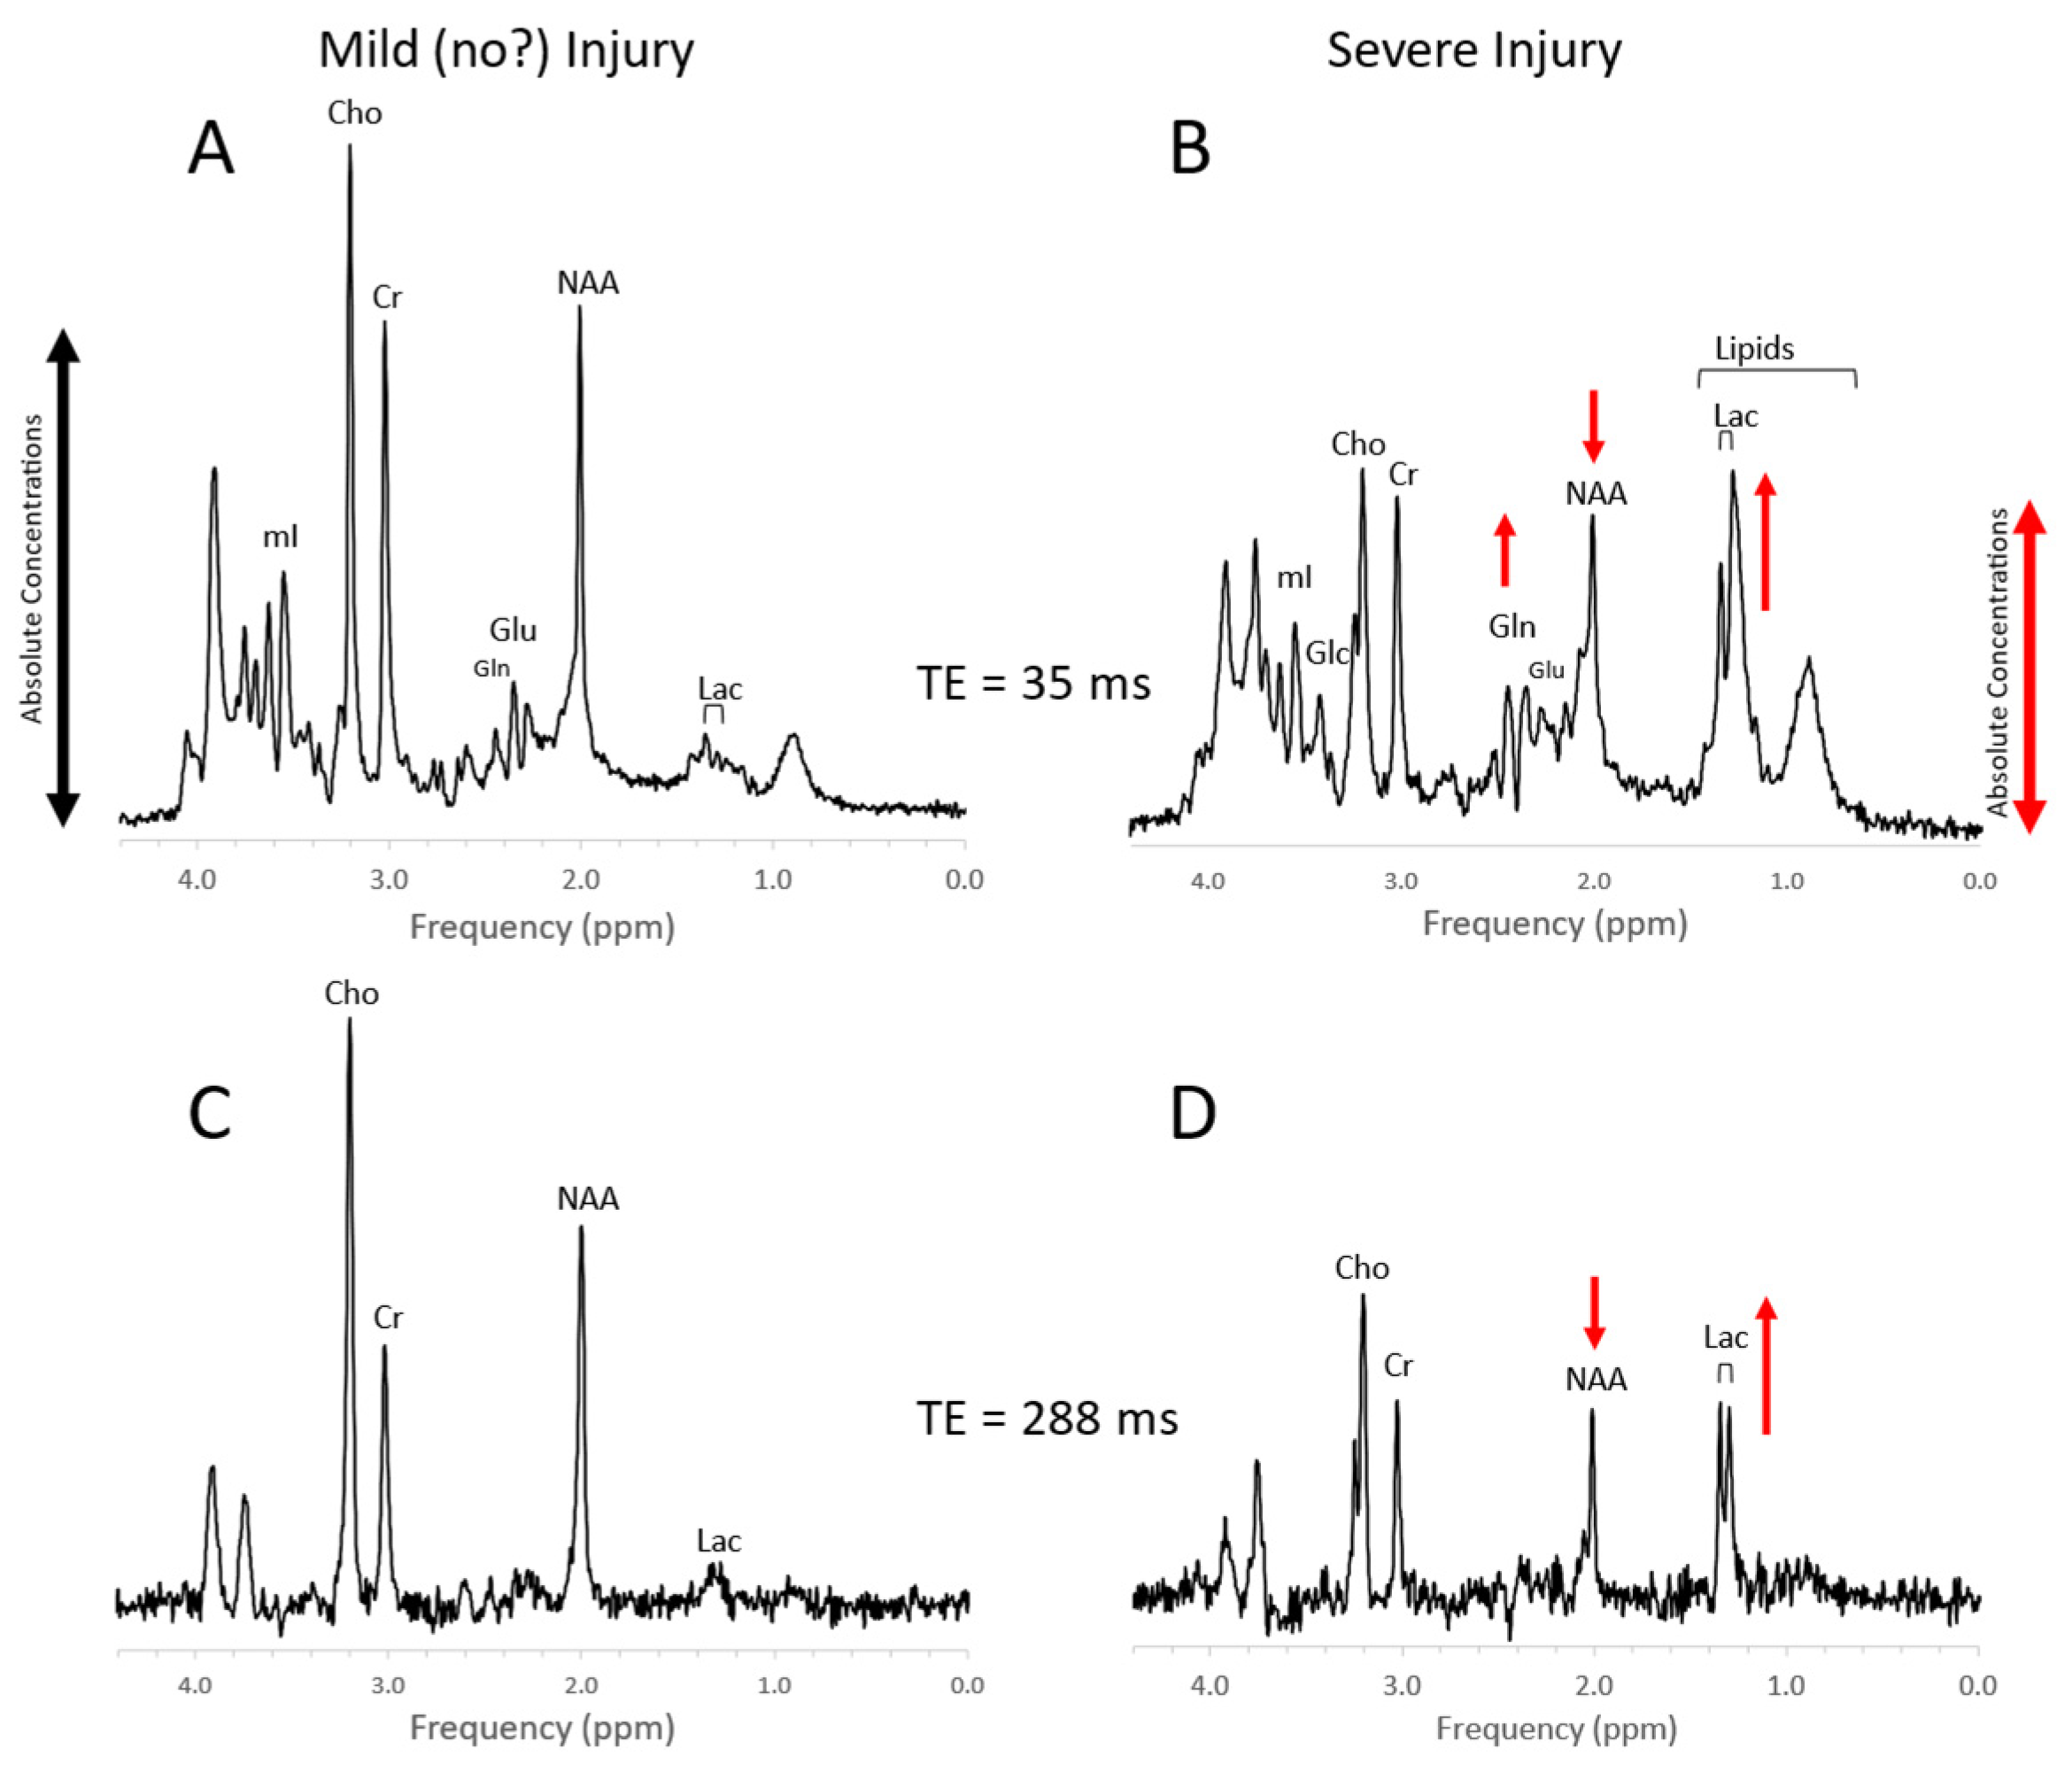
4. Trauma
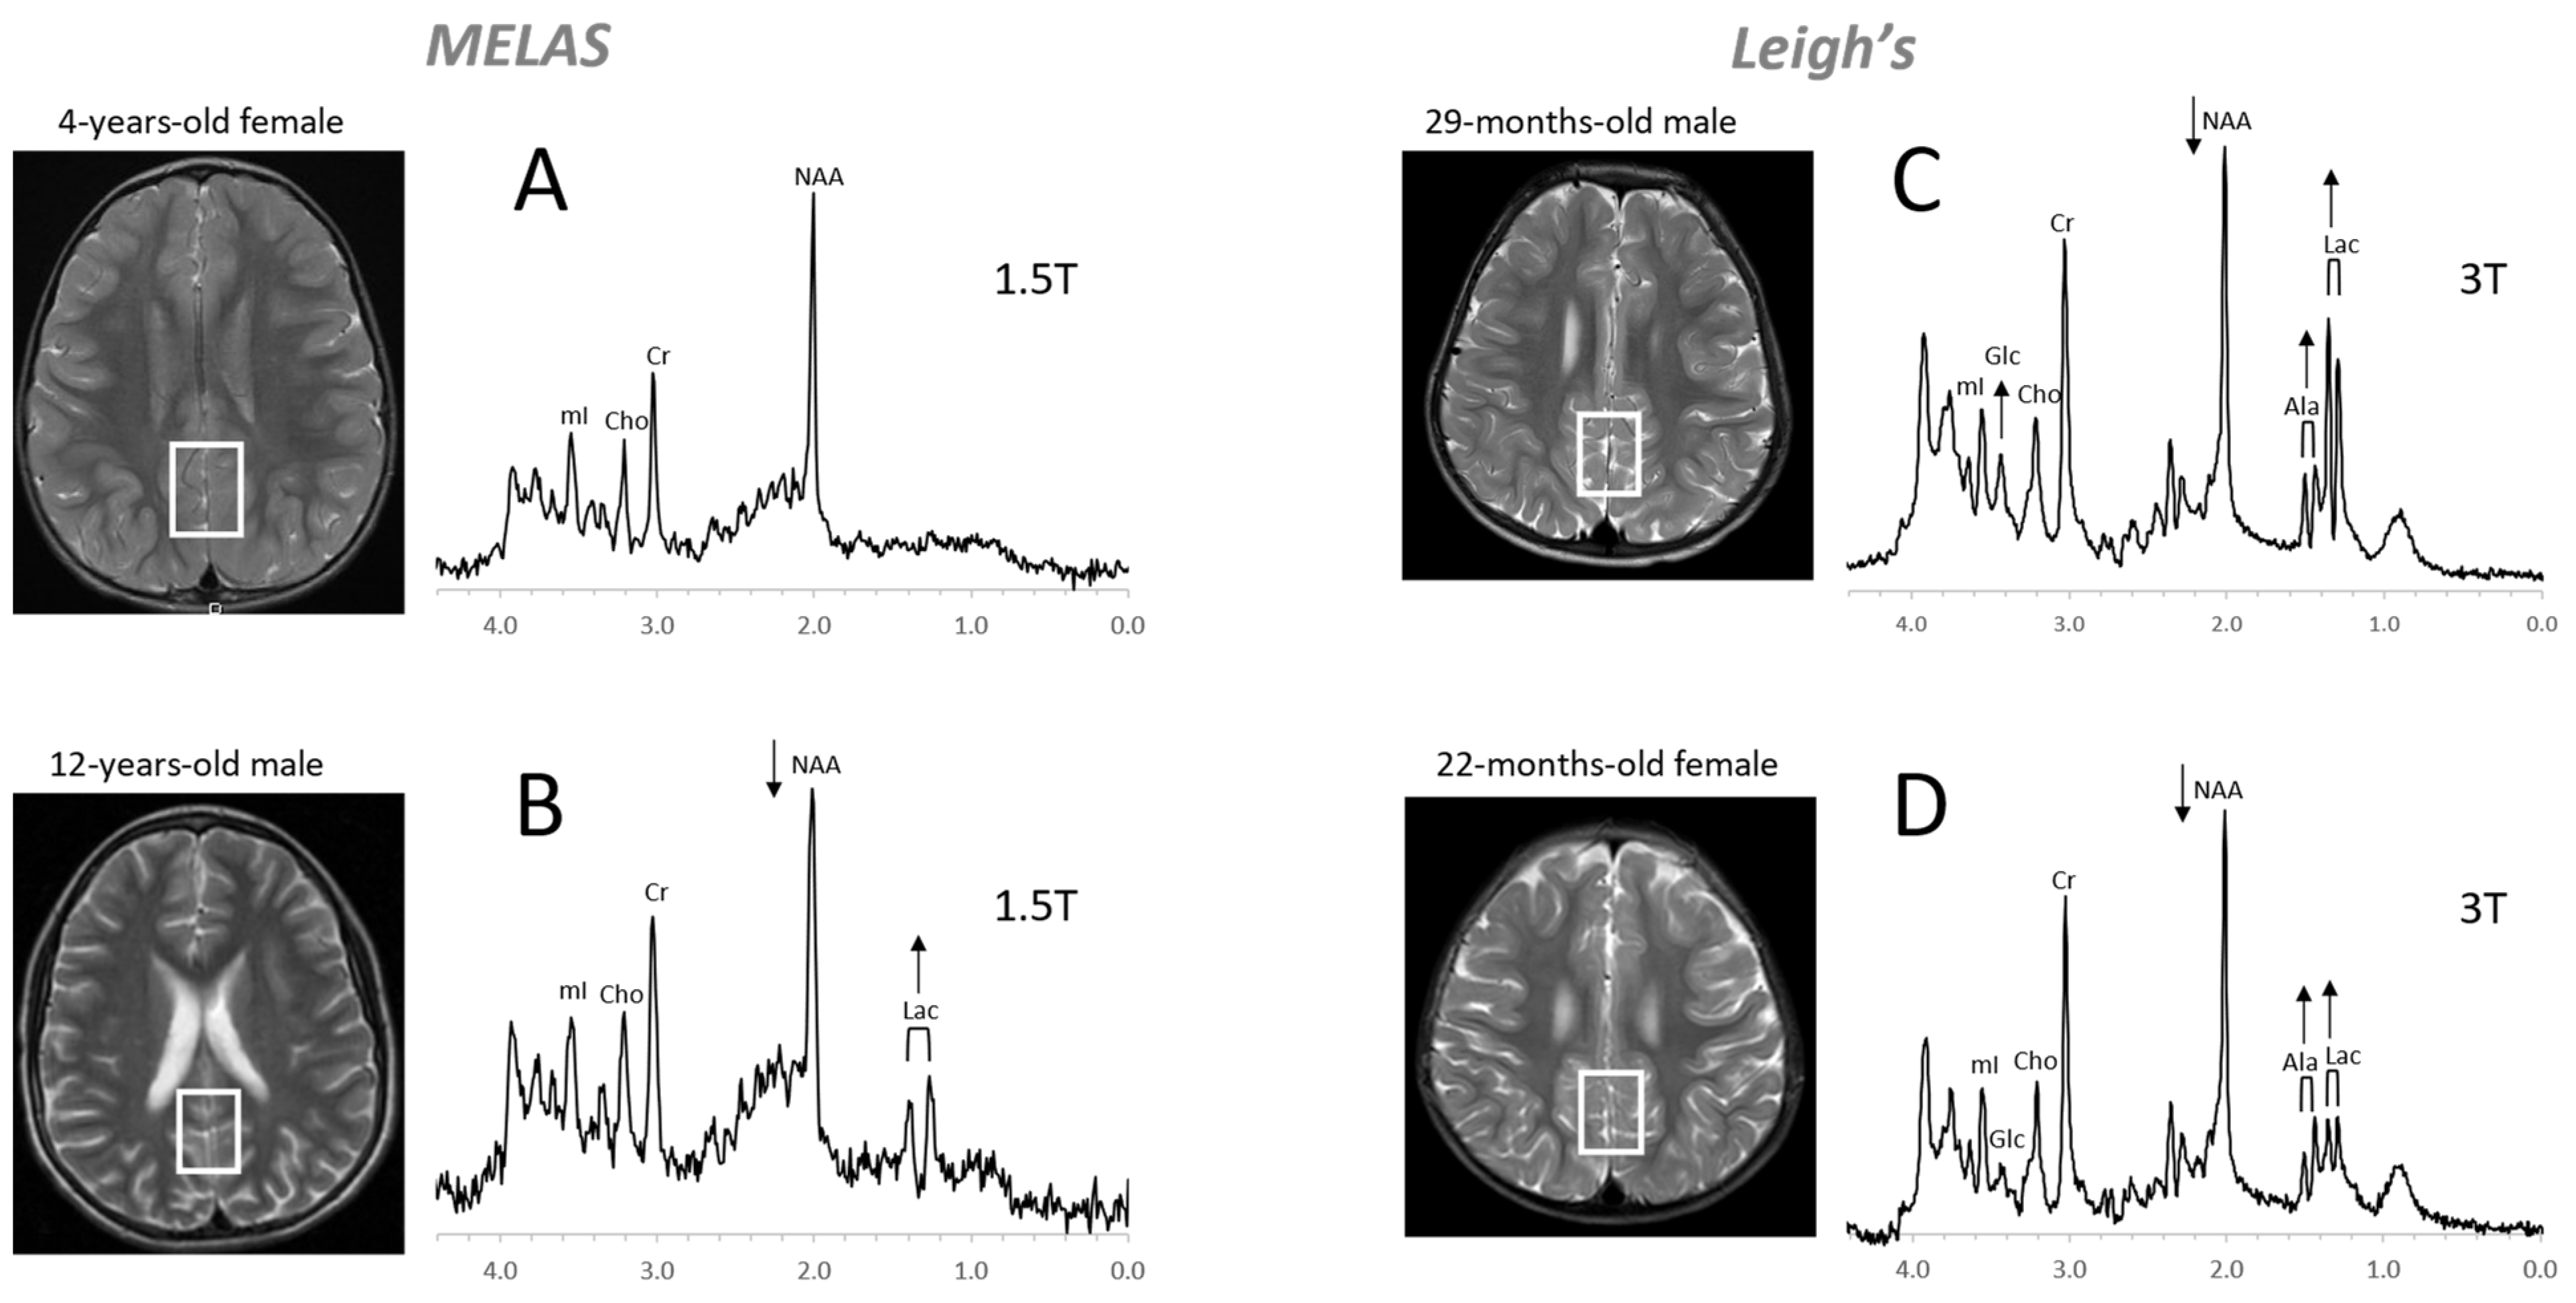
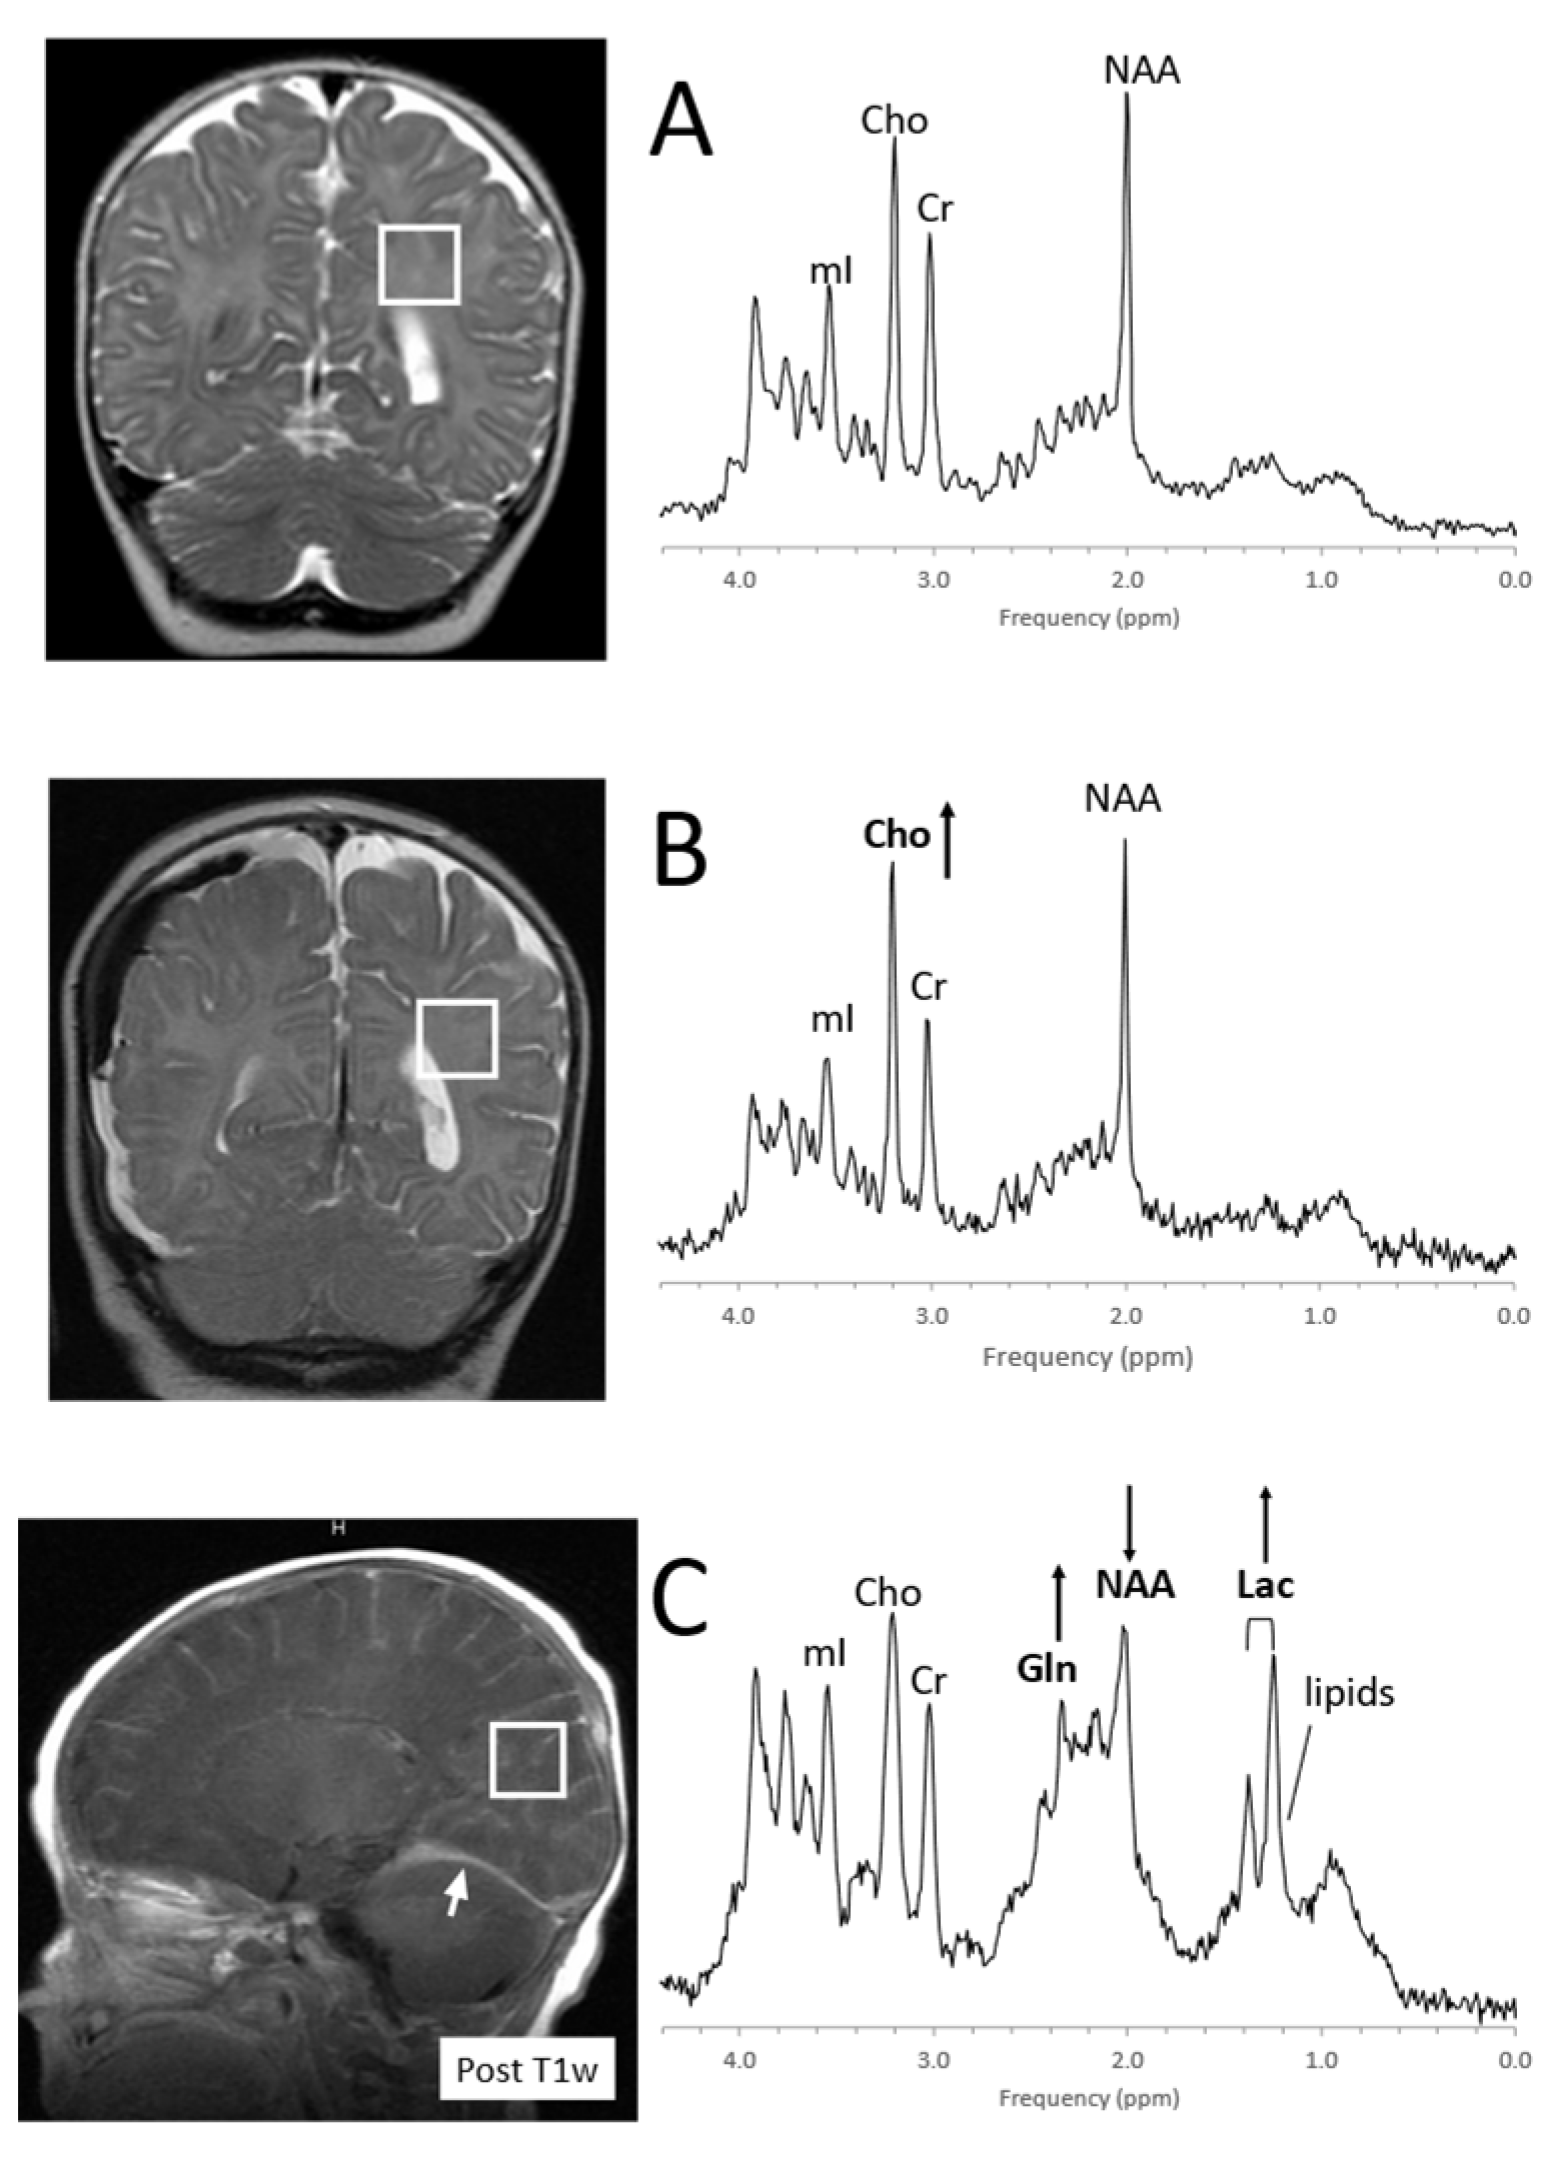
Figure 10. MRS of suspected non-accidental trauma. A parietal white matter spectrum acquired from a 5-month-old male with subarachnoid hemorrhage but otherwise unremarkable MR imaging. The MR spectrum appears to be normal for age (A). Six-month-old with subdural hemorrhages and diffuse supratentorial volume loss. Choline (Cho) appears to be elevated suggestive for axonal injury (B). Two-month-old with acute subdural hemorrhage in the posterior fossa and diffusion abnormality consistent with acute infarct. Lactate is elevated and NAA is reduced. The elevated signal in the 2.2–2.5 ppm range is likely from glutamine (Gln) (C). All spectra were acquired on a 1.5T system with SV-PRESS, TE = 35 ms, TR= 1.5 s.
5. Infections, Inflammation
6. Epilepsy
Ketogenic diets have been effective in reducing seizure activities for a subgroup of patients. Albeit ketosis can readily be monitored with urine ketone levels, it should be noted that the accumulation of ketone bodies in the brain can be observed with in vivo MRS [97] (Figure 12).
7. Neuropsychiatric Disorders
8. Metabolites
Chemicals detectable by MRS (Table 1) are small, mobile, and mostly intracellular metabolites, whereas large immobile macromolecules and phospholipids, myelin, proteins, RNA, and DNA are rendered “invisible” to MRS. Synthesis and breakdown of the small amino acids, carbohydrates, fatty acids, and lipids that contribute to cell metabolism is closely controlled by enzymes, and their concentrations are, thus, kept close to constant. Therefore, the MR spectra of normal in vivo brain biochemistry are remarkably robust and comparable across subjects and serially in individuals with no “Monday morning” vs. “Friday afternoon” metabolism.
Table 1. Metabolites detectable with clinical MR spectroscopy in the human brain.
|
Metabolite (Abbr.) |
Functional Role and Remarks |
Decreased a |
Increased a |
|
Acetate (Act) |
Energy source, precursor of acetyl-CoA, common building block for biosynthesis |
Disease correlate unknown |
Infection/abscesses, brain death |
|
Acetoacetate (AcAc) |
Energy source, produced in the mitochondria of liver cells from acetoacetyl coenzyme A (CoA) |
Disease correlate unknown |
Ketosis |
|
Acetone (Acn) |
Produced by decarboxylation of acetoacetate, singlet at 2.22 ppm more readily detectable than βHB (see below) |
Disease correlate unknown |
Ketosis |
|
Alanine (Ala) |
Amino acid, protein constituent, glucose–alanine cycle |
Disease correlate unknown |
Inborn errors; meningioma and subgroups of other tumors |
|
Aspartate (Asp) |
Excitatory neurotransmitter NAA and Glu precursor |
Disease correlate unknown |
Challenging to recognize due to complex signal and signal overlap with NAA and other chemicals |
|
β-Hydroxybutyrate (βHB) |
Produced by the decarboxylation of acetoacetate, doublet similar to lactate but at 1.19 ppm |
Disease correlate unknown |
Ketosis |
|
Choline (Cho) = glycerophosphocholine + phosphocholine + free choline |
Membrane/myelin synthesis/degradation, acetylcholine precursor, osmolyte |
Liver disease; hypo-osmotic state; during cooling (hypometabolic?) |
De novo synthesis of biomass, including tumors, brain growth, tissue repair; hyper-osmotic state |
|
Citrate (Cit) |
TCA cycle intermediate, produced when the glycolytic rate exceeds TCA activity, fatty acid synthesis |
Disease correlate unknown |
Newborns, subgroups of tumors, most common in diffuse intrinsic brainstem gliomas |
|
Creatine (Cr) = free creatine (fCR) + phosphocreatine (PCr)
|
Energy metabolism, energy storage PCr <-> fCr + ATP |
Cells without creatine kinase, creatine deficiencies, some tumors |
Subgroups of gliomas, gliosis? |
|
γ-Aminobutyric acid (GABA) |
Inhibitory neurotransmitter |
Disease correlate unknown |
Challenging to recognize due to complex signal and signal overlap with other chemicals |
|
Glucose (Glc) (α and β isomers) |
Principal fuel for cells |
Hypoglycemia, detection challenging |
Uncontrolled diabetes; hyperglycemia |
|
Glutamate (Glu) |
Excitatory neurotransmitter |
Most tumors, hepatic encephalopathy, acute hypoxic/ischemic injury |
Subgroup of seizures |
|
Glutamine (Gln) |
Part of the Glu–Gln neurotransmitter cycle; hyper ammonia detoxifier, fuel, osmolyte |
Disease correlate unknown |
Most tumors, edema (relative increase), demyelinating lesions, hepatic encephalopathy, acute hypoxic/ischemic injury |
|
Glutathione (GSH)
|
Consists of glycine, cysteine, and glutamate. Present in reduced (predominant) and oxidized form. Marker of oxidative stress |
Disease correlate unknown |
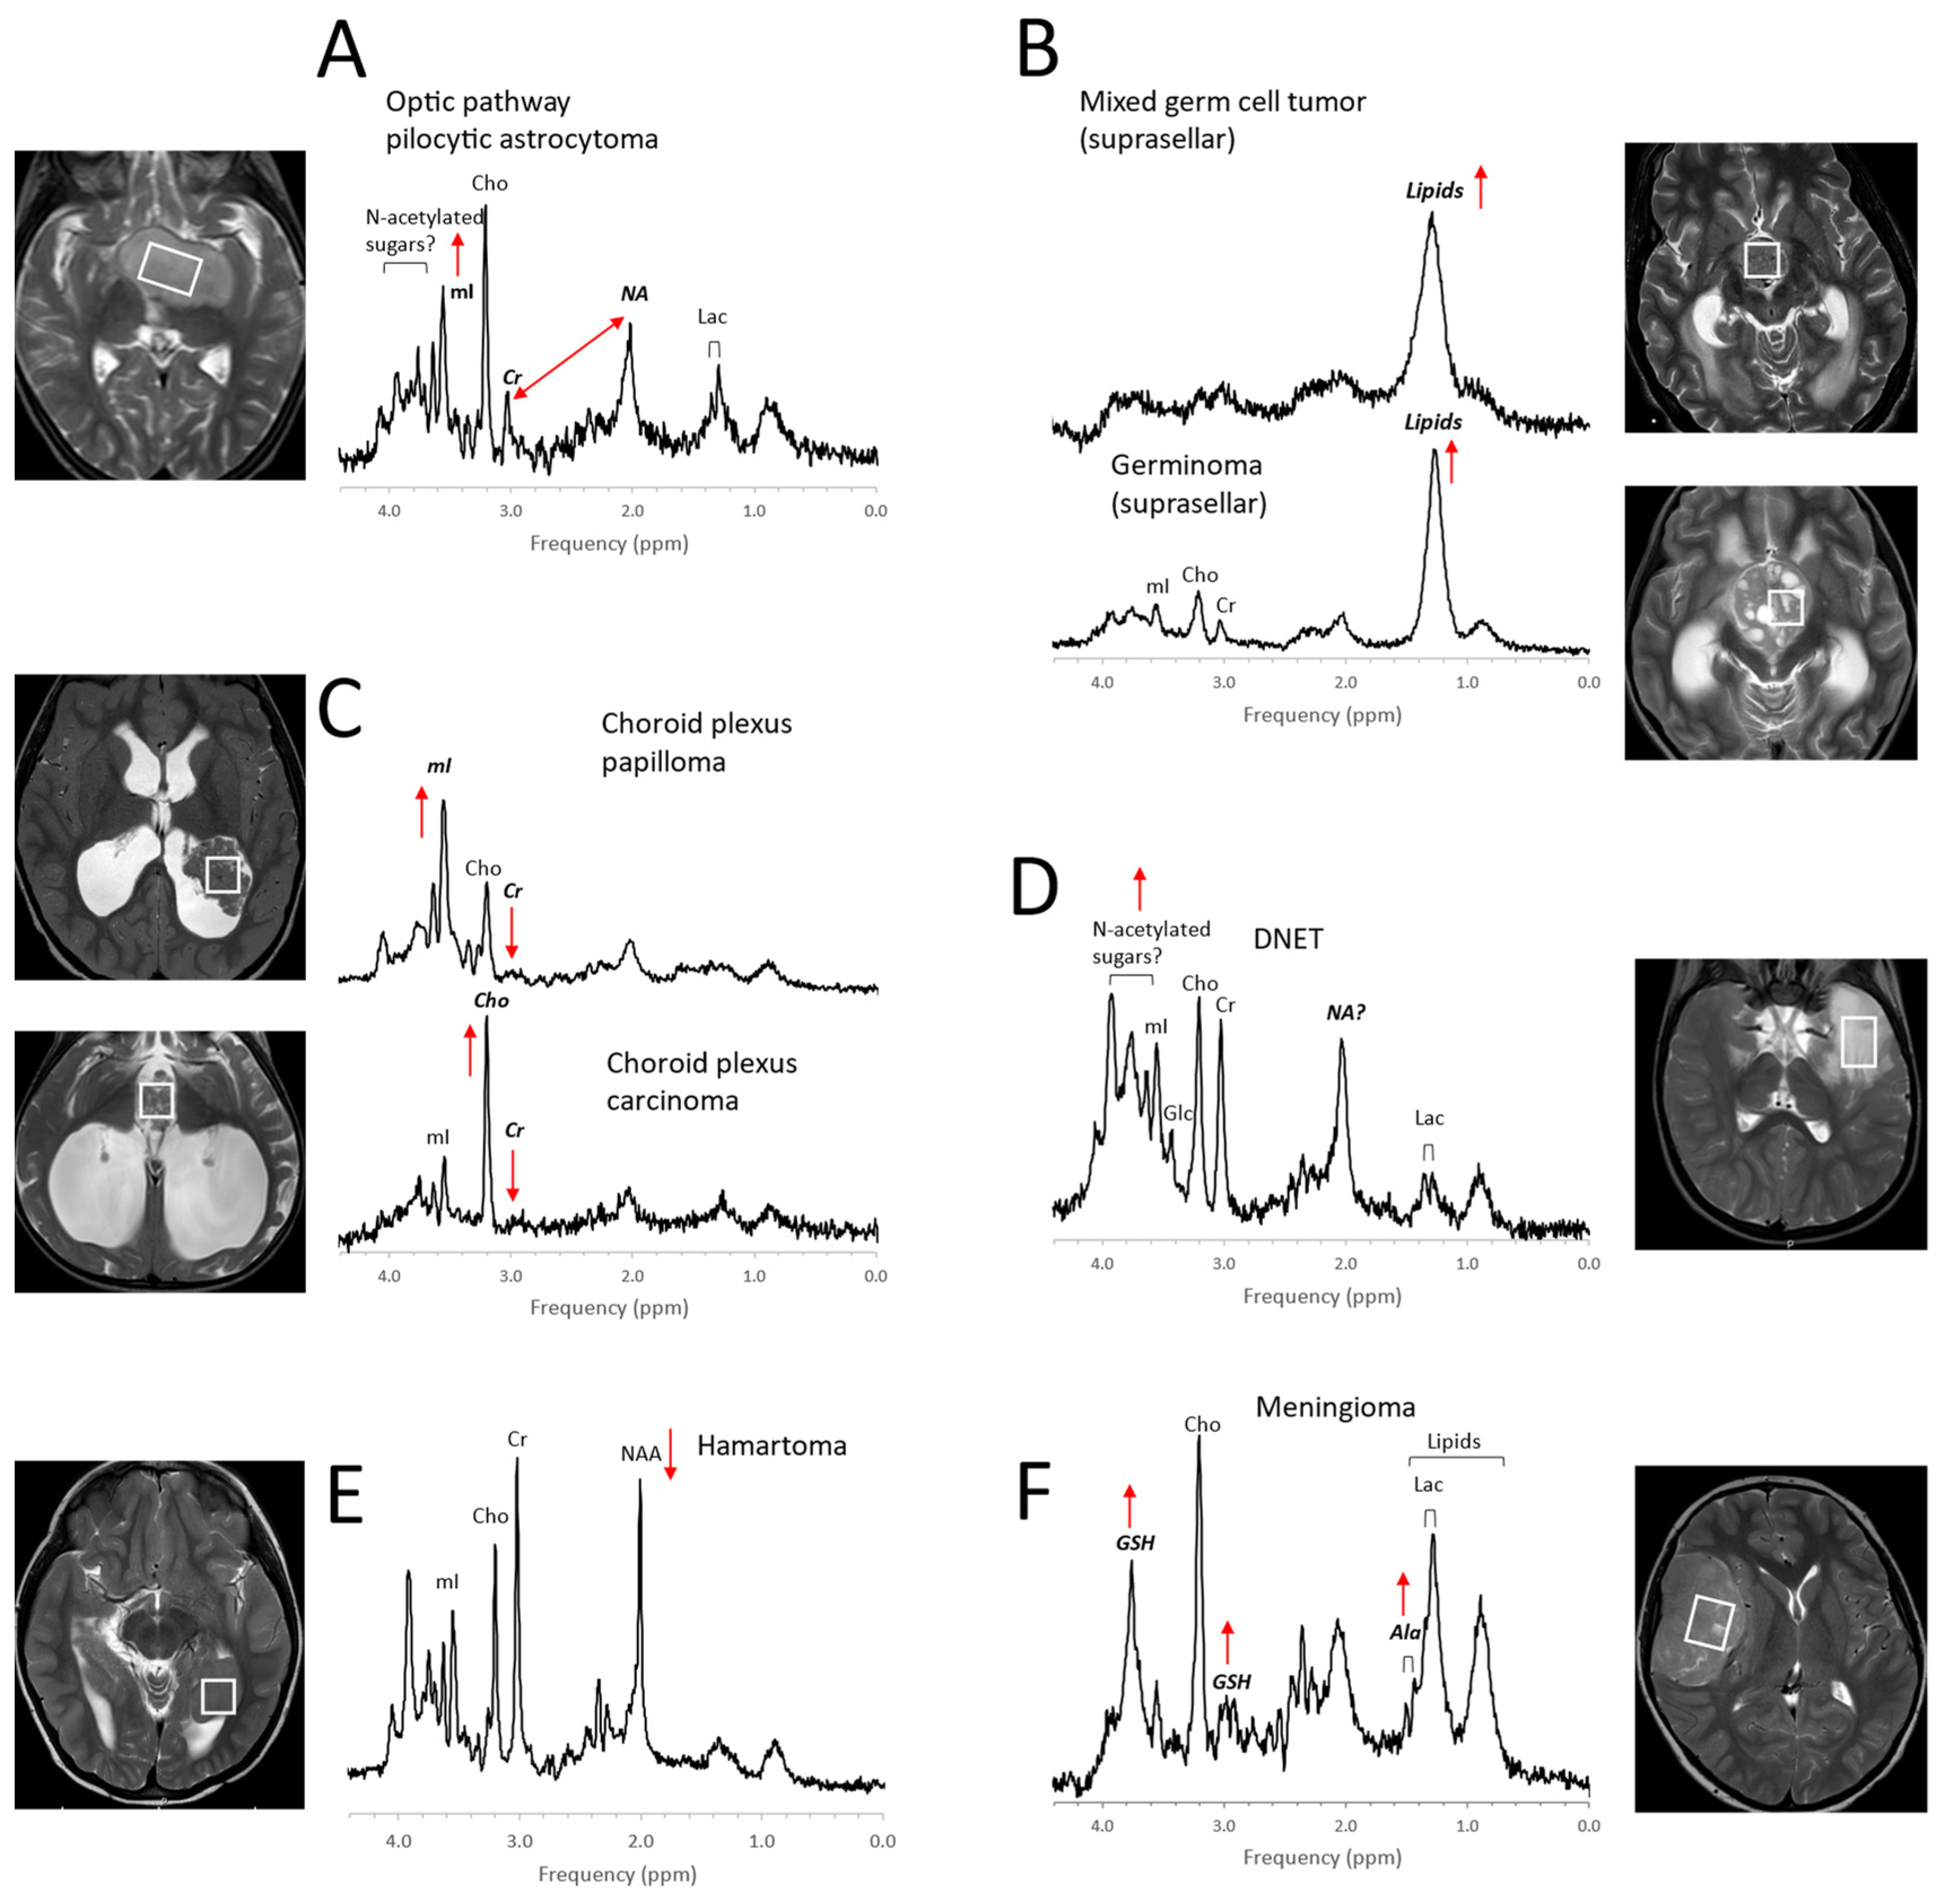
Meningioma |
|
Glycine (Glyc) |
Neurotransmitter inhibitory and excitatory, cellular migration and circuit formation, antioxidant |
Disease correlate unknown |
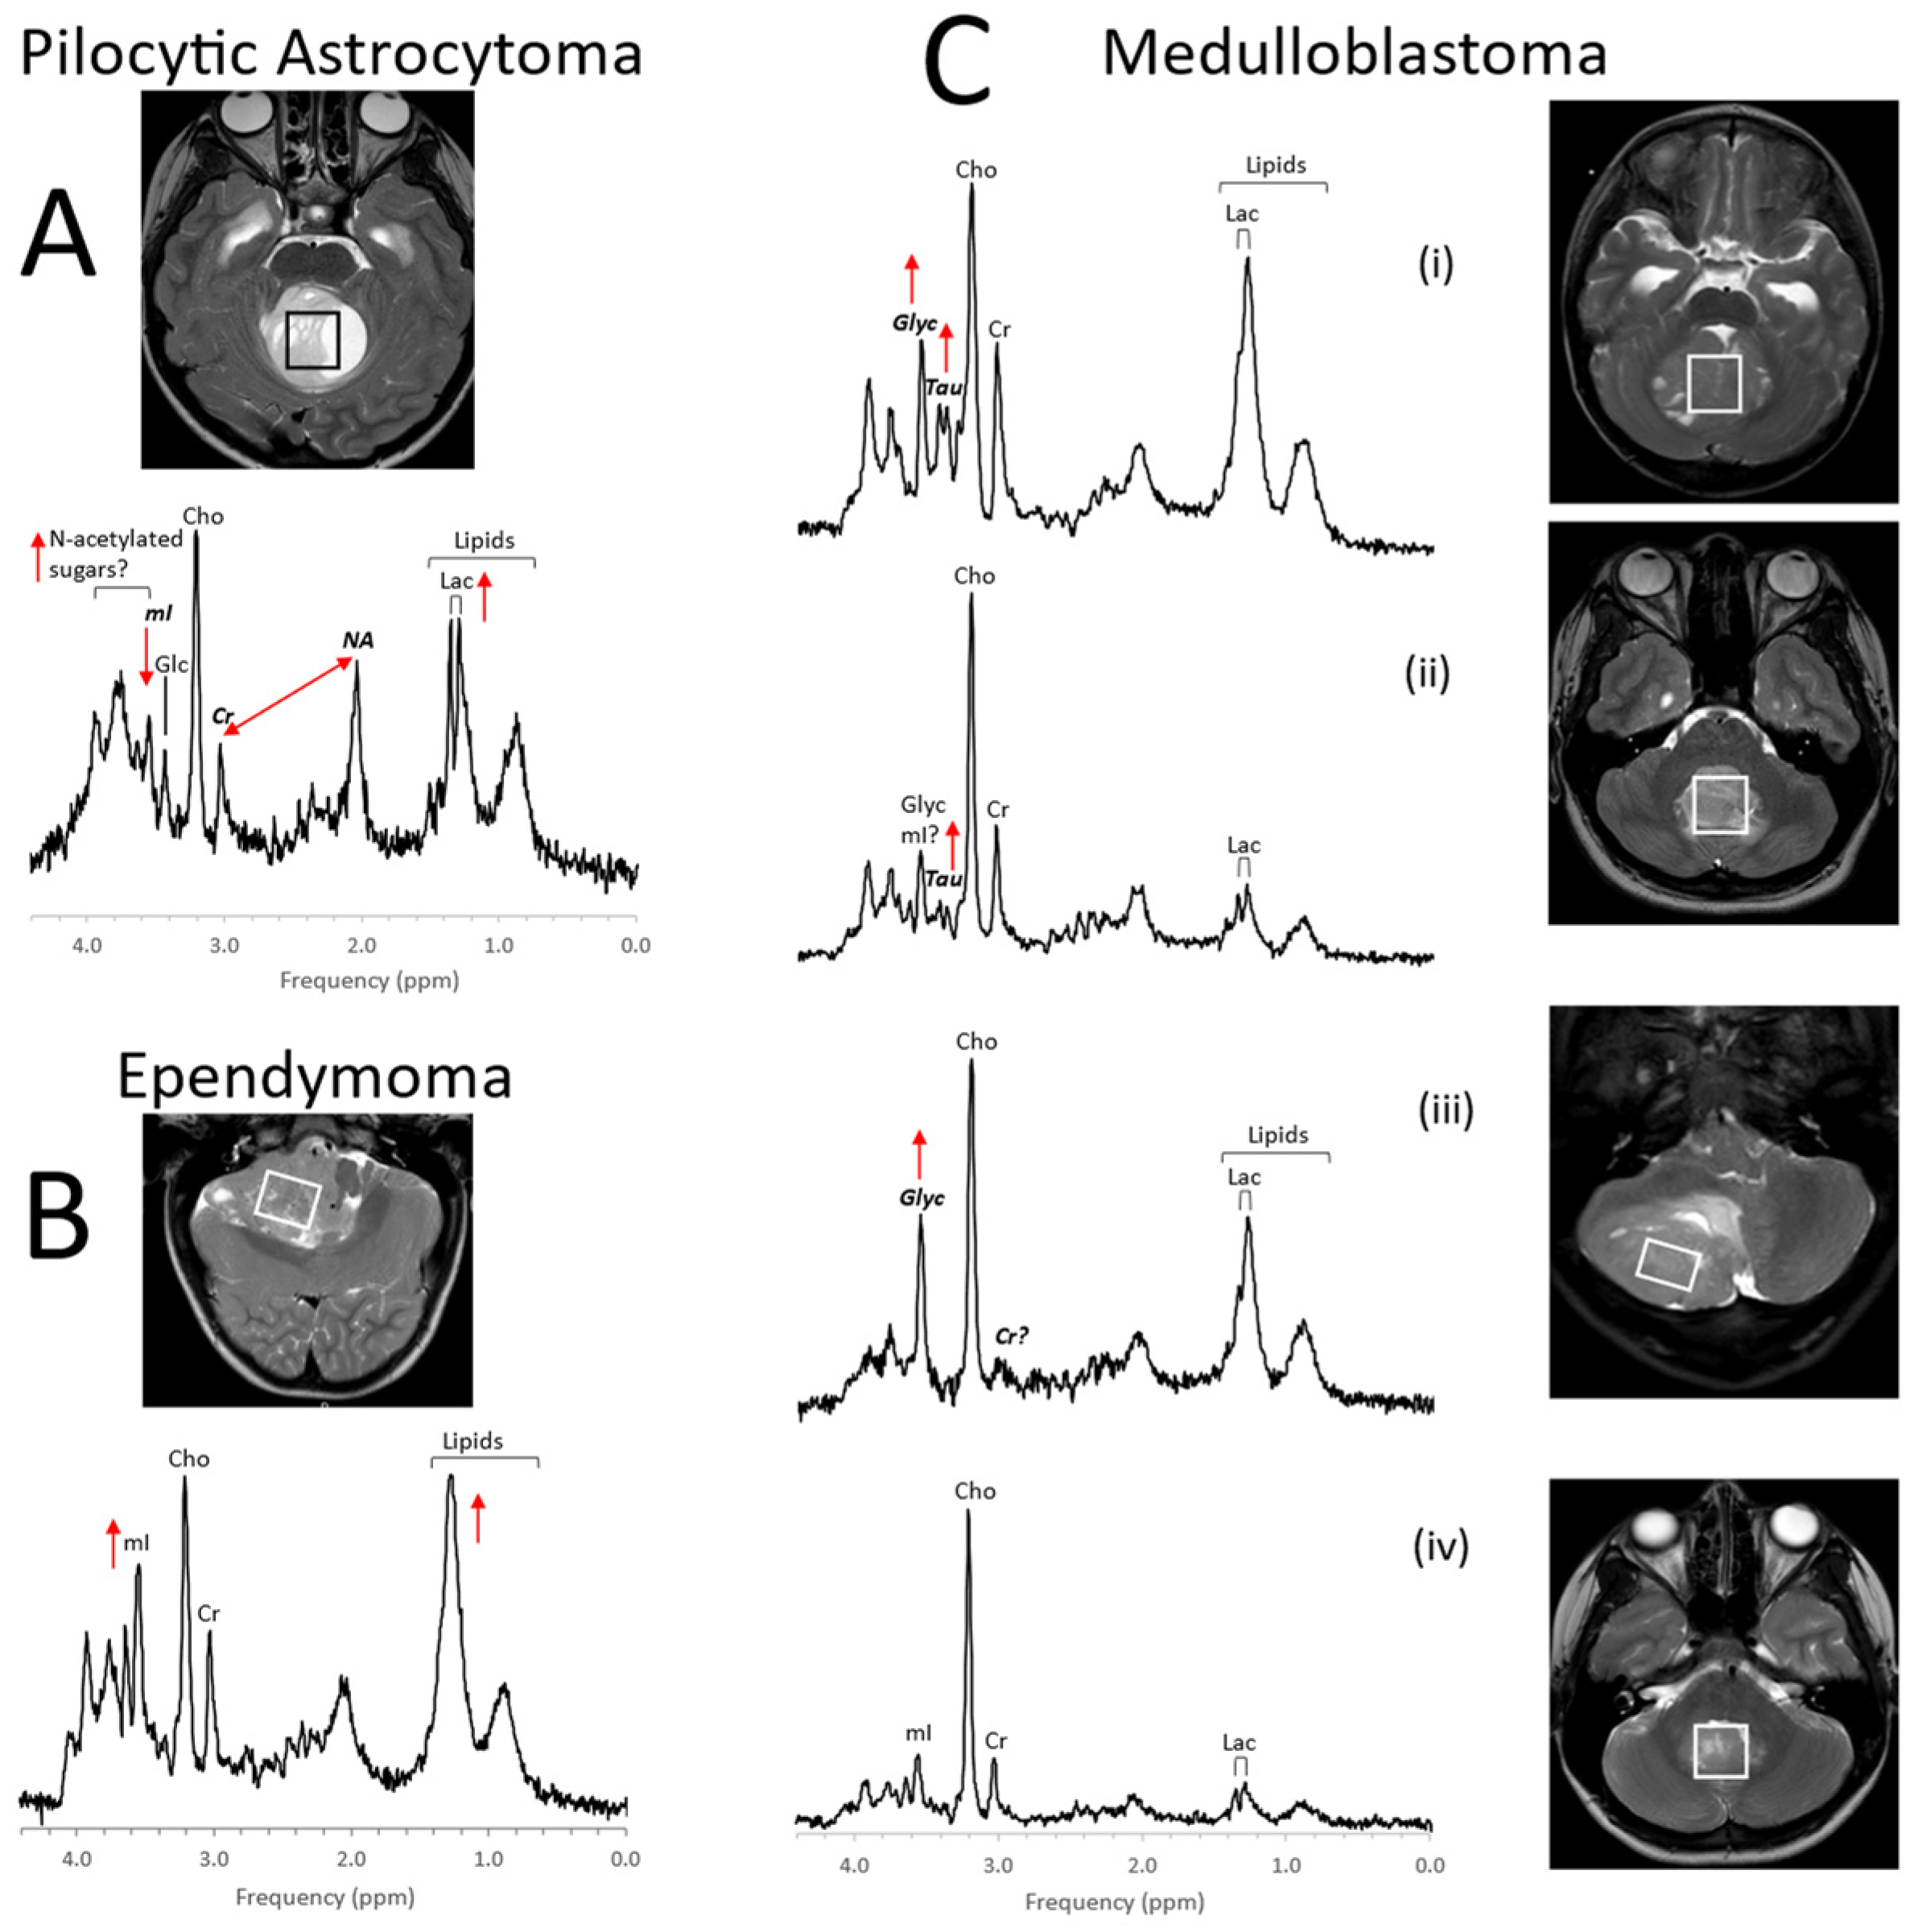
Medulloblastoma and other tumors; hyperglycinemia |
|
Lactate (Lac) |
Endpoint of anaerobic glycolysis, in normal brain present in cerebrospinal fluid at higher concentrations than in tissue |
Disease correlate unknown |
Inborn errors of energy metabolism, hypoxic/ischemic injury; tumors, cystic lesions, normal newborn |
|
Lipids (Lip) with contributions from macromolecules (MM) |
Indicators for cell membrane breakdown when elevated |
Disease correlate unknown |
Injury/cell death and tumor subgroups |
|
Leucine (Leu), iso-leucine (ILeu), valine (Val) |
Branched-chain amino acids (BCAA) |
Disease correlate unknown |
Elevated in inborn error of BCAA metabolism, acute abscesses |
|
Myo-inositol (mI) |
Glial marker, involved in phospholipid membrane metabolism, osmolyte |
Liver disease, hepatic encephalopathy, osmotic imbalance |
Normal newborns, astrocytes, subgroups of tumors (e.g., astrocytoma, ependymoma, choroid plexus papilloma), osmotic imbalance |
|
N-acetylaspartate (NAA) |
Marker for mature neurons and axons |
Pathologies associated with neuronal/axonal damage/loss, mitochondrial function? |
Canavan disease |
|
N-acetylaspartate glutamate (NAAG) |
Neurotransmitter release modulator, small shoulder next to NAA, detectable in high-quality spectra |
Disease correlate unknown |
unknown |
|
Phenylalanine |
Essential amino acid |
Disease correlate unknown |
Uncontrolled phenylketonuria (PKU, phenylalanine hydroxylase deficiency) |
|
Propylene glycol (Pgc) |
Medication solvent (e.g., anticonvulsants), metabolizes to lactate, doublet similar to lactate but at 1.14 ppm |
Disease correlate unknown |
Frequently seen in newborns on medications, possibly because of underdeveloped blood–brain barrier |
|
Scyllo-inositol (sI) |
Symmetric sugar–alcohol isomer, osmolyte, inhibits amyloid-beta aggregation? |
Disease correlate unknown in majority of population |
Detectable under normal conditions in a subgroup of the population; glial tumors |
|
Succinate (Suc) |
TCA cycle intermediate |
Disease correlate unknown |
Abscesses, infection |
|
Taurine (Tau) |
Osmolyte, modulator of neurotransmission |
Decreasing with normal brain maturation |
Newborns; medulloblastoma (group 3, group 4), germinoma, pineoblastoma, and possibly others |
aThe accuracy for detecting some of the metabolites is low, even if they are present in the tissue, due to low concentrations and/or due to complex signals that overlap with signals from other chemicals. For these chemicals, observing a reduction or even an increase is virtually impossible and, unless dramatic, may be missed in individual spectra.
References
- Ostrom, Q.T.; Gittleman, H.; Fulop, J.; Liu, M.; Blanda, R.; Kromer, C.; Wolinsky, Y.; Kruchko, C.; Barnholtz-Sloan, J.S. CBTRUS Statistical Report: Primary Brain and Central Nervous System Tumors Diagnosed in the United States in 2008–2012. Neuro-Oncology 2015, 17 (Suppl. 4), iv1–iv62.
- Gurney, J.; Smith, M.; Bunin, G. CNS and miscellaneous intracranial and intraspinal neoplasms. In Cancer Incidence and Survival among Children and Adolescents: United States SEER Program 1975–1995; Ries, L., Smith, M., Gurney, J., Linet, M., Tamra, T., Young, J., Eds.; National Cancer Institute, SEER Program: Bethesda, MD, USA, 1999; NIH Pub. No. 99-4649.
- Wang, Z.; Sutton, L.N.; Cnaan, A.; Haselgrove, J.C.; Rorke, L.B.; Zhao, H.; Bilaniuk, L.T.; A Zimmerman, R. Proton MR spectroscopy of pediatric cerebellar tumors. AJNR Am. J. Neuroradiol. 1995, 16, 1821–1833.
- Sutton, L.N.; Wang, Z.J.; Wehrli, S.L.; Marwaha, S.; Molloy, P.; Phillips, P.C.; Zimmerman, R.A. Proton Spectroscopy of Suprasellar Tumors in Pediatric Patients. Neurosurgery 1997, 41, 388–395.
- Arle, J.E.; Morriss, C.; Wang, Z.; Zimmerman, R.A.; Phillips, P.G.; Sutton, L.N. Prediction of posterior fossa tumor type in children by means of magnetic resonance image properties, spectroscopy, and neural networks. J. Neurosurg. 1997, 86, 755–761.
- Tzika, A.A.; Astrakas, L.G.; Zarifi, M.K.; Zurakowski, D.; Poussaint, T.Y.; Goumnerova, L.; Tarbell, N.J.; Black, P.M. Spectroscopic and perfusion magnetic resonance imaging predictors of progression in pediatric brain tumors. Cancer 2004, 100, 1246–1256.
- A Lazareff, J.; Olmstead, C.; Bockhorst, K.H.; Alger, J.R. Proton magnetic resonance spectroscopic imaging of pediatric low-grade astrocytomas. Child’s Nerv. Syst. 1996, 12.
- Peet, A.C.; Lateef, S.; MacPherson, L.; Natarajan, K.; Sgouros, S.; Grundy, R.G. Short echo time 1 H magnetic resonance spectroscopy of childhood brain tumours. Child’s Nerv. Syst. 2006, 23, 163–169.
- Davies, N.P.; Wilson, M.; Harris, L.M.; Natarajan, K.; Lateef, S.; Macpherson, L.; Sgouros, S.; Grundy, R.G.; Arvanitis, T.N.; Peet, A.C. Identification and characterisation of childhood cerebellar tumours by in vivo proton MRS. NMR Biomed. 2008, 21, 908–918.
- Panigrahy, A.; Krieger, M.; Gonzalez-Gomez, I.; Liu, X.; McComb, J.; Finlay, J.; Nelson, M.; Gilles, F.; Blüml, S. Quantitative Short Echo Time 1H-MR Spectroscopy of Untreated Pediatric Brain Tumors: Preoperative Diagnosis and Characterization. Am. J. Neuroradiol. 2006, 27, 560–572.
- Shiroishi, M.S.; Panigrahy, A.; Moore, K.R.; Nelson, M.D.; Gilles, F.H.; González-Gómez, I.; Blüml, S. Combined MRI and MRS improves pre-therapeutic diagnoses of pediatric brain tumors over MRI alone. Neuroradiology 2015, 57, 951–956.
- Tamrazi, B.; Nelson, M.D.; Blüml, S. MRS of pilocytic astrocytoma: The peak at 2 ppm may not be NAA. Magn. Reson. Med. 2016, 78, 452–456.
- Jones, C.; Karajannis, M.A.; Jones, D.T.W.; Kieran, M.W.; Monje, M.; Baker, S.J.; Becher, O.J.; Cho, Y.-J.; Gupta, N.; Hawkins, C.; et al. Pediatric high-grade glioma: Biologically and clinically in need of new thinking. Neuro-Oncology 2016, 19, 153–161.
- Blüml, S.; Margol, A.S.; Sposto, R.; Kennedy, R.J.; Robison, N.J.; Vali, M.; Hung, L.T.; Muthugounder, S.; Finlay, J.L.; Erdreich-Epstein, A.; et al. Molecular subgroups of medulloblastoma identification using noninvasive magnetic resonance spectroscopy. Neuro Oncol. 2015, 18, 126–131.
- Shimizu, H.; Kumabe, T.; Shirane, R.; Yoshimoto, T. Correlation between Choline Level Measured by Proton MR Spectroscopy and Ki-67 Labeling Index in Gliomas. Am. J. Neuroradiol. 2000, 21, 659–665.
- Clymer, J.; Kieran, M.W. The Integration of Biology Into the Treatment of Diffuse Intrinsic Pontine Glioma: A Review of the North American Clinical Trial Perspective. Front. Oncol. 2018, 8, 169.
- Pan, E.; Prados, M. Pediatric CNS Tumors; Gupta, N., Haas-Kogen, D., Banerjee, A., Eds.; Springer: Berlin/Heidelberg, Germany; New York, NY, USA; Volume 3, pp. 49–61.
- Yoshimura, J.; Onda, K.; Tanaka, R.; Takahashi, H. Clinicopathological Study of Diffuse Type Brainstem Gliomas: Analysis of 40 Autopsy Cases. Neurol. Med.-Chir. 2003, 43, 375–382.
- Panigrahy, A.; Nelson, M.D.; Finlay, J.L.; Sposto, R.; Krieger, M.D.; Gilles, F.H.; Blüml, S. Metabolism of diffuse intrinsic brainstem gliomas in children. Neuro-Oncology 2008, 10, 32–44.
- Seymour, Z.A.; Panigrahy, A.; Finlay, J.L.; Nelson, M.D., Jr.; Bluml, S. Citrate in pediatric CNS tumors? AJNR Am. J. Neuroradiol. 2008, 29, 1006–1011.
- Blüml, S.; Panigrahy, A.; Laskov, M.; Dhall, G.; Krieger, M.D.; Nelson, M.D.; Finlay, J.L.; Gilles, F.H. Elevated citrate in pediatric astrocytomas with malignant progression. Neuro-Oncology 2011, 13, 1107–1117.
- Harris, L.M.; Davies, N.; MacPherson, L.; Lateef, S.; Natarajan, K.; Brundler, M.-A.; Sgouros, S.; English, M.W.; Arvanitis, T.; Grundy, R.G.; et al. Magnetic resonance spectroscopy in the assessment of pilocytic astrocytomas. Eur. J. Cancer 2008, 44, 2640–2647.
- Davies, N.P.; Wilson, M.; Natarajan, K.; Sun, Y.; MacPherson, L.; Brundler, M.A.; Arvanitis, T.N.; Grundy, R.G.; Peet, A.C. Non-invasive detection of glycine as a biomarker of malignancy in childhood brain tumours using in-vivo 1H MRS at 1.5 tesla confirmed by ex-vivo high-resolution magic-angle spinning NMR. NMR Biomed. 2010, 23, 80–87.
- Carapella, C.M.; Carpinelli, G.; Knijn, A.; Raus, L.; Caroli, F.; Podo, F. Potential Role of in vitro 1H Magnetic Resonance Spectroscopy in the Definition of Malignancy Grading of Human Neuroepithelial Brain Tumours. Acta Neurochir. Suppl. 1997, 68, 127–132.
- Tzika, A.A.; Righi, V.; Andronesi, O.C.; Mintzopoulos, D.; Black, P.M. High-resolution magic angle spinning magnetic resonance spectroscopy detects glycine as a biomarker in brain tumors. Int. J. Oncol. 2009, 36, 301–306.
- Louis, D.N.; Perry, A.; Wesseling, P.; Brat, D.J.; Cree, I.A.; Figarella-Branger, D.; Hawkins, C.; Ng, H.K.; Pfister, S.M.; Reifenberger, G.; et al. The 2021 WHO Classification of Tumors of the Central Nervous System: A summary. Neuro-Oncology 2021, 23, 1231–1251.
- A Northcott, P.; Dubuc, A.M.; Pfister, S.; Taylor, M.D. Molecular subgroups of medulloblastoma. Expert Rev. Neurother. 2012, 12, 871–884.
- Tamrazi, B.; Venneti, S.; Margol, A.; Hawes, D.; Cen, S.; Nelson, M.; Judkins, A.; Biegel, J.; Blüml, S. Pediatric Atypical Teratoid/Rhabdoid Tumors of the Brain: Identification of Metabolic Subgroups Using In Vivo 1H-MR Spectroscopy. Am. J. Neuroradiol. 2019, 40, 872–877.
- Panwalkar, P.; Tamrazi, B.; Dang, D.; Chung, C.; Sweha, S.; Natarajan, S.K.; Pun, M.; Bayliss, J.; Ogrodzinski, M.P.; Pratt, D.; et al. Targeting integrated epigenetic and metabolic pathways in lethal childhood PFA ependymomas. Sci. Transl. Med. 2021, 13.
- Lawn, J.; Shibuya, K.; Stein, C. No cry at birth: Global estimates of intrapartum stillbirths and intrapartum-related neonatal deaths. Bull. World Health Organ. 2005, 83, 409–417.
- Barkovich, A.J.; Hajnal, B.L.; Vigneron, D.; Sola, A.; Partridge, J.C.; Allen, F.; Ferriero, D.M. Prediction of neuromotor outcome in perinatal asphyxia: Evaluation of MR scoring systems. AJNR Am. J. Neuroradiol. 1998, 19, 143–149.
- Miller, S.; Ramaswamy, V.; Michelson, D.; Barkovich, A.J.; Holshouser, B.; Wycliffe, N.; Glidden, D.; Deming, D.; Partridge, J.C.; Wu, Y.W.; et al. Patterns of brain injury in term neonatal encephalopathy. J. Pediatr. 2005, 146, 453–460.
- Groenendaal, F.; Veenhoven, R.H.; van der Grond, J.; Jansen, G.H.; Witkamp, T.D.; de Vries, L.S. Cerebral Lactate and N-Acetyl-Aspartate/Choline Ratios in Asphyxiated Full-Term Neonates Demonstrated In Vivo Using Proton Magnetic Resonance Spectroscopy. Pediatr. Res. 1994, 35, 148–151.
- Alderliesten, T.; De Vries, L.S.; Benders, M.J.N.L.; Koopman, C.; Groenendaal, F. MR Imaging and Outcome of Term Neonates with Perinatal Asphyxia: Value of Diffusion-weighted MR Imaging and H MR Spectroscopy. Radiology 2011, 261, 235–242.
- Parmentier, C.E.J.; de Vries, L.S.; Groenendaal, F. Magnetic Resonance Imaging in (Near-)Term Infants with Hypoxic-Ischemic Encephalopathy. Diagnostics 2022, 12, 645.
- Miller, S.P.; Newton, N.; Ferriero, D.M.; Partridge, J.C.; Glidden, D.V.; Barnwell, A.; A Chuang, N.; Vigneron, D.B.; Barkovich, A.J. Predictors of 30-Month Outcome after Perinatal Depression: Role of Proton MRS and Socioeconomic Factors. Pediatr. Res. 2002, 52, 71–77.
- Azzopardi, D.; Edwards, A.D. Magnetic resonance biomarkers of neuroprotective effects in infants with hypoxic ischemic encephalopathy. Semin. Fetal Neonatal Med. 2010, 15, 261–269.
- Cheong, J.; Cady, E.; Penrice, J.; Wyatt, J.; Cox, I.; Robertson, N. Proton MR Spectroscopy in Neonates with Perinatal Cerebral Hypoxic-Ischemic Injury: Metabolite Peak-Area Ratios, Relaxation Times, and Absolute Concentrations. Am. J. Neuroradiol. 2006, 27, 1546–1554.
- Barkovich, A.J.; Baranski, K.; Vigneron, D.; Partridge, J.C.; Hallam, D.K.; Hajnal, B.L.; Ferriero, D.M. Proton MR Spectroscopy for the Evaluation of Brain Injury in Asphyxiated, Term Neonates. Am. J. Neuroradiol. 1999, 20, 1399–1405.
- Mitra, S.; Kendall, G.S.; Bainbridge, A.; Sokolska, M.; Dinan, M.; Uria-Avellanal, C.; Price, D.; McKinnon, K.; Gunny, R.; Huertas-Ceballos, A.; et al. Proton magnetic resonance spectroscopy lactate/N-acetylaspartate within 2 weeks of birth accurately predicts 2-year motor, cognitive and language outcomes in neonatal encephalopathy after therapeutic hypothermia. Arch. Dis. Child.-Fetal Neonatal Ed. 2018, 104, F424–F432.
- Aida, N. 1H-MR Spectroscopy of the Early Developmental Brain, Neonatal Encephalopathies, and Neurometabolic Disorders. Magn. Reson. Med. Sci. 2022, 21, 9–28.
- Thayyil, S.; Chandrasekaran, M.; Taylor, A.; Bainbridge, A.; Cady, E.B.; Chong, W.K.K.; Murad, S.; Omar, R.Z.; Robertson, N.J. Cerebral Magnetic Resonance Biomarkers in Neonatal Encephalopathy: A Meta-analysis. Pediatrics 2010, 125, e382–e395.
- Shanmugalingam, S.; Thornton, J.S.; Iwata, O.; Bainbridge, A.; O’Brien, F.E.; Priest, A.N.; Ordidge, R.J.; Cady, E.B.; Wyatt, J.S.; Robertson, N.J. Comparative Prognostic Utilities of Early Quantitative Magnetic Resonance Imaging Spin-Spin Relaxometry and Proton Magnetic Resonance Spectroscopy in Neonatal Encephalopathy. Pediatrics 2006, 118, 1467–1477.
- Kreis, R.; Arcinue, E.; Ernst, T.; Shonk, T.K.; Flores, R.; Ross, B.D. Hypoxic encephalopathy after near-drowning studied by quantitative 1H-magnetic resonance spectroscopy. J. Clin. Investig. 1996, 97, 1142–1154.
- Cady, E.B.; Lorek, A.; Penrice, J.; Reynolds, E.O.; Iles, R.A.; Burns, S.P.; Coutts, G.A.; Cowan, F.M. Detection of propan-1,2-diol in neonatal brain by in vivo proton magnetic resonance spectroscopy. Magn. Reson. Med. 1994, 32, 764–767.
- Whitehead, M.T.; Lai, L.M.; Blüml, S. Clinical 1H MRS in childhood neurometabolic diseases—Part 1: Technique and age-related normal spectra. Neuroradiology 2022, 64, 1101–1110.
- Paul, A.R.; Adamo, M.A. Non-accidental trauma in pediatric patients: A review of epidemiology, pathophysiology, diagnosis and treatment. Transl. Pediatr. 2014, 3, 195–207.
- Keenan, H.T.; Runyan, D.K.; Marshall, S.W.; Nocera, M.A.; Merten, D.F.; Sinal, S.H. A population-based study of inflicted traumatic brain injury in young children. JAMA 2003, 290, 621–626.
- Theodore, A.D.; Chang, J.J.; Runyan, D.K.; Hunter, W.M.; Bangdiwala, S.I.; Agans, R. Epidemiologic Features of the Physical and Sexual Maltreatment of Children in the Carolinas. Pediatrics 2005, 115, e331–e337.
- Kay, T.; Harrington, D.E.R.A.; Anderson, T.; Berrol, S.; Cicerone, K. Definition of mild traumatic brain injury. J. Head Trauma Rehabil. 1993, 8, 86–87.
- Arbogast, K.B.; Curry, A.; Pfeiffer, M.R.; Zonfrillo, M.; Haarbauer-Krupa, J.; Breiding, M.J.; Coronado, V.G.; Master, C. Point of Health Care Entry for Youth With Concussion Within a Large Pediatric Care Network. JAMA Pediatr. 2016, 170, e160294.
- Meehan, W.P., 3rd; Bachur, R.G. Sport-related concussion. Pediatrics 2009, 123, 114–123.
- Field, M.; Collins, M.W.; Lovell, M.R.; Maroon, J. Does age play a role in recovery from sports-related concussion? A comparison of high school and collegiate athletes. J. Pediatr. 2003, 142, 546–553.
- Makoroff, K.L.; Cecil, K.M.; Caré, M.; Ball, W.S. Elevated lactate as an early marker of brain injury in inflicted traumatic brain injury. Pediatr. Radiol. 2005, 35, 668–676.
- Ashwal, S.; A Holshouser, B.; Shu, S.K.; Simmons, P.L.; Perkin, R.M.; Tomasi, L.G.; Knierim, D.S.; Sheridan, C.; Craig, K.; Andrews, G.H.; et al. Predictive value of proton magnetic resonance spectroscopy in pediatric closed head injury. Pediatr. Neurol. 2000, 23, 114–125.
- Aaen, G.S.; Holshouser, B.A.; Sheridan, C.; Colbert, C.; McKenney, M.; Kido, D.; Ashwal, S. Magnetic Resonance Spectroscopy Predicts Outcomes for Children With Nonaccidental Trauma. Pediatrics 2010, 125, 295–303.
- Haseler, L.J.; Arcinue, E.; Danielsen, E.R.; Bluml, S.; Ross, B.D. Evidence From Proton Magnetic Resonance Spectroscopy for a Metabolic Cascade of Neuronal Damage in Shaken Baby Syndrome. Pediatrics 1997, 99, 4–14.
- A Holshouser, B.; Ashwal, S.; Luh, G.Y.; Shu, S.; Kahlon, S.; Auld, K.L.; Tomasi, L.G.; Perkin, R.M.; Hinshaw, D.B. Proton MR spectroscopy after acute central nervous system injury: Outcome prediction in neonates, infants, and children. Radiology 1997, 202, 487–496.
- Ross, B.D.; Ernst, T.; Kreis, R.; Haseler, L.J.; Bayer, S.; Danielsen, E.; Bluml, S.; Shonk, T.; Mandigo, J.C.; Caton, W.; et al. 1H MRS in acute traumatic brain injury. J. Magn. Reson. Imaging 1998, 8, 829–840.
- Holshouser, B.A.; Ashwal, S.; Shu, S.; Hinshaw, D.B., Jr. Proton MR spectroscopy in children with acute brain injury: Comparison of short and long echo time acquisitions. J. Magn. Reson. Imaging 2000, 11, 9–19.
- Friedman, S.; Brooks, W.; Jung, R.; Chiulli, S.; Sloan, J.; Montoya, B.; Hart, B.; Yeo, R. Quantitative proton MRS predicts outcome after traumatic brain injury. Neurology 1999, 52, 1384.
- Holshouser, B.A.; Tong, K.A.; Ashwal, S. Proton MR Spectroscopic Imaging Depicts Diffuse Axonal Injury in Children with Traumatic Brain Injury. Am. J. Neuroradiol. 2005, 26, 1276–1285.
- Govindaraju, V.; Gauger, G.E.; Manley, G.T.; Ebel, A.; Meeker, M.; Maudsley, A.A. Volumetric Proton Spectroscopic Imaging of Mild Traumatic Brain Injury. Am. J. Neuroradiol. 2004, 25, 730–737.
- Brooks, W.M.; Stidley, C.A.; Petropoulos, H.; Jung, R.E.; Weers, D.C.; Friedman, S.; Barlow, M.A.; Sibbitt, W.; Yeo, R.A. Metabolic and Cognitive Response to Human Traumatic Brain Injury: A Quantitative Proton Magnetic Resonance Study. J. Neurotrauma 2000, 17, 629–640.
- Gasparovic, C.; Arfai, N.; Smid, N.; Feeney, D.M. Decrease and Recovery of N-Acetylaspartate/Creatine in Rat Brain Remote from Focal Injury. J. Neurotrauma 2001, 18, 241–246.
- Schuhmann, M.U.; Stiller, D.; Skardelly, M.; Thomas, S.; Samii, M.; Brinker, T. Long-Time in-Vivo Metabolic Monitoring Following Experimental Brain Contusion Using Proton Magnetic Resonance Spectroscopy. Acta Neurochir. Suppl. 2002, 81, 209–212.
- Cecil, K.M.; Hills, E.C.; Sandel, M.E.; Smith, D.H.; McIntosh, T.K.; Mannon, L.J.; Sinson, G.P.; Bagley, L.J.; Grossman, R.I.; Lenkinski, R.E. Proton magnetic resonance spectroscopy for detection of axonal injury in the splenium of the corpus callosum of brain-injured patients. J. Neurosurg. 1998, 88, 795–801.
- Pal, D.; Bhattacharyya, A.; Husain, M.; Prasad, K.; Pandey, C.; Gupta, R. In Vivo Proton MR Spectroscopy Evaluation of Pyogenic Brain Abscesses: A Report of 194 Cases. Am. J. Neuroradiol. 2009, 31, 360–366.
- Lai, P.-H.; Hsu, S.-S.; Ding, S.-W.; Ko, C.-W.; Fu, J.-H.; Weng, M.-J.; Yeh, L.-R.; Wu, M.-T.; Liang, H.-L.; Chen, C.-K.; et al. Proton magnetic resonance spectroscopy and diffusion-weighted imaging in intracranial cystic mass lesions. Surg. Neurol. 2007, 68, S25–S36.
- Luthra, G.; Parihar, A.; Nath, K.; Jaiswal, S.; Prasad, K.; Husain, N.; Husain, M.; Singh, S.; Behari, S.; Gupta, R. Comparative Evaluation of Fungal, Tubercular, and Pyogenic Brain Abscesses with Conventional and Diffusion MR Imaging and Proton MR Spectroscopy. Am. J. Neuroradiol. 2007, 28, 1332–1338.
- Gupta, R.K.; Jain, K.K.; Mittal, S.K.; Kumar, S. Imaging features of central nervous system fungal infections. Neurol. India 2007, 55, 241–250.
- Ferraz-Filho, J.R.; Santana-Netto, P.V.; Rocha-Filho, J.A.; Sgnolf, A.; Mauad, F.; Sanches, R.A. Application of magnetic resonance spectroscopy in the differentiation of high-grade brain neoplasm and inflammatory brain lesions. Arq. Neuro-Psiquiatr. 2009, 67, 250–253.
- Keller, M.A.; Venkatraman, T.N.; Thomas, A.; Deveikis, A.; LoPresti, C.; Hayes, J.; Berman, N.; Walot, I.; Padilla, S.; Johnston-Jones, J.; et al. Altered neurometabolite development in HIV-infected children: Correlation with neuropsychological tests. Neurology 2004, 62, 1810–1817.
- van der Voorn, J.P.; Pouwels, P.J.; Vermeulen, R.J.; Barkhof, F.; van der Knaap, M.S. Quantitative MR imaging and spectroscopy in congenital cytomegalovirus infection and periventricular leukomalacia suggests a comparable neuropathological substrate of the cerebral white matter lesions. Neuropediatrics 2009, 40, 168–173.
- Takanashi, J.-I.; Sugita, K.; Ishii, M.; Aoyagi, M.; Niimi, H. Longitudinal MR imaging and proton MR spectroscopy in herpes simplex encephalitis. J. Neurol. Sci. 1997, 149, 99–102.
- Cecil, K.M.; Jones, B.V.; Williams, S.; Hedlund, G.L. CT, MRI and MRS of Epstein-Barr virus infection: Case report. Neuroradiology 2000, 42, 619–622.
- Cecil, K.M.; Lindquist, D.M. Infection and Encephalitis. In MR Spectroscopy of Pediatric Brain Disorders; Springer: New York, NY, USA, 2013; pp. 155–166.
- Mader, I.; Wolff, M.; Nägele, T.; Niemann, G.; Grodd, W.; Küker, W. MRI and proton MR spectroscopy in acute disseminated encephalomyelitis. Child’s Nerv. Syst. 2005, 21, 566–572.
- Seo, H.-E.; Hwang, S.-K.; Choe, B.H.; Cho, M.-H.; Park, S.-P.; Kwon, S. Clinical Spectrum and Prognostic Factors of Acute Necrotizing Encephalopathy in Children. J. Korean Med. Sci. 2010, 25, 449–453.
- Gupta, R.K.; Roy, R.; Dev, R.; Husain, M.; Poptani, H.; Pandey, R.; Kishore, J.; Bhaduri, A.P. Finger printing of Mycobacterium tuberculosis in patients with intracranial tuberculomas by using in vivo, ex vivo, and in vitro magnetic resonance spectroscopy. Magn. Reson. Med. 1996, 36, 829–833.
- Gupta, R.K.; Husain, M.; Vatsal, D.K.; Kumar, R.; Chawla, S.; Husain, N. Comparative evaluation of magnetization transfer MR imaging and in-vivo proton MR spectroscopy in brain tuberculomas. Magn. Reson. Imaging 2002, 20, 375–381.
- Malhotra, H.; Jain, K.; Agarwal, A.; Singh, M.; Yadav, S.; Husain, M.; Krishnani, N.; Gupta, R. Characterization of tumefactive demyelinating lesions using MR imaging and in-vivo proton MR spectroscopy. Mult. Scler. J. 2008, 15, 193–203.
- Cianfoni, A.; Niku, S.; Imbesi, S. Metabolite Findings in Tumefactive Demyelinating Lesions Utilizing Short Echo Time Proton Magnetic Resonance Spectroscopy. Am. J. Neuroradiol. 2007, 28, 272–277.
- Saindane, A.M.; Cha, S.; Law, M.; Xue, X.; Knopp, E.A.; Zagzag, D. Proton MR Spectroscopy of Tumefactive Demyelinating Lesions. Am. J. Neuroradiol. 2002, 23, 1378–1386.
- Urenjak, J.; Williams, S.R.; Gadian, D.G.; Noble, M. Specific expression of N-acetylaspartate in neurons, oligodendrocyte-type-2 astrocyte progenitors, and immature oligodendrocytes in vitro. J. Neurochem. 1992, 59, 55–61.
- Signoretti, S.; Marmarou, A.; Tavazzi, B.; Lazzarino, G.; Beaumont, A.; Vagnozzi, R. N-Acetylaspartate Reduction as a Measure of Injury Severity and Mitochondrial Dysfunction Following Diffuse Traumatic Brain Injury. J. Neurotrauma 2001, 18, 977–991.
- Varho, T.; Komu, M.; Sonninen, P.; Lähdetie, J.; Holopainen, I.E. Quantitative 1H MRS and MRI Volumetry Indicate Neuronal Damage in the Hippocampus of Children with Focal Epilepsy and Infrequent Seizures. Epilepsia 2005, 46, 696–703.
- Miller, E.; Widjaja, E. Magnetic Resonance Spectroscopy in Epilepsy. In MR Spectroscopy of Pediatric Brain Disorders; Bluml, S., Panigrahy, A., Eds.; Springer: New York, NY, USA, 2013; pp. 175–192.
- Najm, I.M.; Wang, Y.; Hong, S.C.; Luders, H.O.; Ng, T.C.; Comair, Y.G. Temporal Changes in Proton MRS Metabolites After Kainic Acid-Induced Seizures in Rat Brain. Epilepsia 1997, 38, 87–94.
- Baslow, M.H. Evidence supporting a role for N-acetyl-l-aspartate as a molecular water pump in myelinated neurons in the central nervous system: An analytical review. Neurochem. Int. 2002, 40, 295–300.
- Najm, I.M.; Wang, Y.; Shedid, D.; Luders, H.O.; Ng, T.C.; Comair, Y.G. MRS metabolic markers of seizures and seizure-induced neuronal damage. Epilepsia 1998, 39, 244–250.
- Woermann, F.G.; McLean, M.A.; Bartlett, P.A.; Parker, G.J.; Barker, G.J.; Duncan, J.S. Short echo time single-voxel 1H magnetic resonance spectroscopy in magnetic resonance imaging-negative temporal lobe epilepsy: Different biochemical profile compared with hippocampal sclerosis. Ann. Neurol. 1999, 45, 369–376.
- Simister, R.J.; McLean, M.A.; Barker, G.J.; Duncan, J.S. A Proton Magnetic Resonance Spectroscopy Study of Metabolites in the Occipital Lobes in Epilepsy. Epilepsia 2003, 44, 550–558.
- Sherwin, A.; Robitaille, Y.; Quesney, F.; Olivier, A.; Villemure, J.; Leblanc, R.; Feindel, W.; Andermann, E.; Gotman, J.; Ethier, R.; et al. Excitatory amino acids are elevated in human epileptic cerebral cortex. Neurology 1988, 38, 920.
- Petroff, O.A.; Pleban, L.A.; Spencer, D.D. Symbiosis between in vivo and in vitro NMR spectroscopy: The creatine, N-acetylaspartate, glutamate, and GABA content of the epileptic human brain. Magn. Reson. Imaging 1995, 13, 1197–1211.
- Pfund, Z.; Chugani, D.C.; Juhász, C.; Muzik, O.; Chugani, H.T.; Wilds, I.B.; Seraji-Bozorgzad, N.; Moore, G.J. Evidence for Coupling between Glucose Metabolism and Glutamate Cycling Using FDG PET and 1H Magnetic Resonance Spectroscopy in Patients with Epilepsy. J. Cereb. Blood Flow Metab. 2000, 20, 871–878.
- Seymour, K.J.; Bluml, S.; Sutherling, J.; Sutherling, W.; Ross, B.D. Identification of cerebral acetone by 1H-MRS in patients with epilepsy controlled by ketogenic diet. Magma 1999, 8, 33–42.
- Horska, A.; Mahone, E.M. 1H Magnetic Resonance Spectroscopy of the Brain During Adolescence: Normal Brain Development and Neuropsychiatric Disorders. In MR Spectroscopy of Pediatric Brain Disorders; Bluml, S., Panigrahy, A., Eds.; Springer: New York, NY, USA, 2013; pp. 193–212.
- Levitt, J.G.; O’Neill, J.; Alger, J.R. Magnetic Resonance Spectroscopy Studies of Autistic Spectrum Disorders. In MR Spectroscopy of Pediatric Brain Disorders; Bluml, S., Panigrahy, A., Eds.; Springer: New York, NY, USA, 2013; pp. 213–227.
- O’Neill, J.; Levitt, J.G.; Alger, J.R. Magnetic Resonance Spectroscopy Studies of Attention Deficit Hyperactivity Disorder. In MR Spectroscopy of Pediatric Brain Diseases; Bluml, S., Panigrahy, A., Eds.; Springer: New York, NY, USA, 2013; pp. 229–275.

