Your browser does not fully support modern features. Please upgrade for a smoother experience.
Submitted Successfully!
 +1 credit
Thank you for your contribution! You can also upload a video entry or images related to this topic.
For video creation, please contact our Academic Video Service.
| Version | Summary | Created by | Modification | Content Size | Created at | Operation |
|---|---|---|---|---|---|---|
| 1 | Nur Adibah Mohidem | -- | 3833 | 2022-04-28 07:18:09 | | | |
| 2 | Vivi Li | + 637 word(s) | 4470 | 2022-04-28 10:17:12 | | |
Video Upload Options
We provide professional Academic Video Service to translate complex research into visually appealing presentations. Would you like to try it?
Cite
If you have any further questions, please contact Encyclopedia Editorial Office.
Mohidem, N.A.; , .; Che Ya, N.N.; Saberioon, M.; Tarmidi, Z.; Arif Shah, J.; Fazlil Ilahi, W.F.; Man, N. Mobile Computing for Pest and Disease Management. Encyclopedia. Available online: https://encyclopedia.pub/entry/22417 (accessed on 22 July 2026).
Mohidem NA, , Che Ya NN, Saberioon M, Tarmidi Z, Arif Shah J, et al. Mobile Computing for Pest and Disease Management. Encyclopedia. Available at: https://encyclopedia.pub/entry/22417. Accessed July 22, 2026.
Mohidem, Nur Adibah, , Norasma N Che Ya, Mohammadmehdi Saberioon, Zakri Tarmidi, Jasmin Arif Shah, Wan Fazilah Fazlil Ilahi, Norsida Man. "Mobile Computing for Pest and Disease Management" Encyclopedia, https://encyclopedia.pub/entry/22417 (accessed July 22, 2026).
Mohidem, N.A., , ., Che Ya, N.N., Saberioon, M., Tarmidi, Z., Arif Shah, J., Fazlil Ilahi, W.F., & Man, N. (2022, April 28). Mobile Computing for Pest and Disease Management. In Encyclopedia. https://encyclopedia.pub/entry/22417
Mohidem, Nur Adibah, et al. "Mobile Computing for Pest and Disease Management." Encyclopedia. Web. 28 April, 2022.
Copy Citation
The demand for mobile applications in agriculture is increasing as smartphones are continuously developed and used for many purposes; one of them is managing pests and diseases in crops. Using mobile applications, farmers can detect early infection and improve the specified treatment and precautions to prevent further infection from occurring. Furthermore, farmers can communicate with agricultural authorities to manage their farm from home, and efficiently obtain information such as the spectral signature of crops. Therefore, the spectral signature can be used as a reference to detect pests and diseases with a hyperspectral sensor more efficiently than the conventional method, which takes more time to monitor the entire crop field.
crop
disease
mobile app
pest
spectral signature
1. Introduction
Smartphones are small, lightweight, easy-to-carry devices that can be connected to the Internet, and they make people’s lives easier because most of their daily activities can be performed on a smartphone. The price of a smartphone is affordable if an individual requires only the necessary features, but if users desire additional applications on their devices, they may be required to pay a higher price for a smartphone that includes advanced functions. Today, almost everyone has a smartphone. They contain multiple functions that enable advanced computing capabilities and connectivity compared to a regular phone that only consists of basic functions such as sending or receiving calls and text messages. Applications in smartphones can help users fulfil their needs, such as sending emails for communication, playing games for entertainment, and reading the news for information [1].
Many sectors have utilized mobile applications, such as business [2], health [3], map navigation [4], and agricultural [5] industries. Specifically, precision agriculture constitutes a management practice combined with on-farm technologies employed to decrease the input of a crop, such as a pesticide and fertilizer, by applying them at the right time, right place, and in the right amount, resulting in gaining a higher profit [6]. Therefore, mobile applications are one of the technologies used in this field, used for purposes such as analysing a crop’s health. A crop’s health could be affected by several factors, two of which are pests and diseases that can both decrease yield production [7]. Pest and disease monitoring has often been conducted by a farmer from farmer associations or governmental agencies when the disease is severe and hard to treat. To be a professional farmer, one must have knowledge of agriculture or be advised by experts. Therefore, using mobile applications for pest and disease monitoring could help farmers observe and diagnose an infestation in its early stages [8]. Furthermore, farmers could use their smartphones to identify pests and diseases they are unfamiliar with by referring to the information in the app [9]. The survey results and observations regarding pests and diseases could guide farmers in managing other crops in the future [10].
Spectral signatures can be applied to identify the pest and disease species with higher accuracy than image identification [11]. The spectral signature of plants is vital because it demonstrates the unique values and characteristics of plant species. The same concept applies to different species of pests and diseases, as each of them has a different graph curve depending on the individual characteristics. Consequently, a spectral library may be used to compare the reflectance of pests and diseases with plants in the field and estimate the extent of the infestation [12]. Moreover, it could be employed in mobile applications to differentiate and identify the location of the pest and disease in the plant. Thus, pest and disease mapping is feasible [13]. The spectral signature graph is stored in the spectral signature library in a digital database to avoid loss of the data and provide easy access to researchers worldwide [14]. The mobile application can collect information about diseases and pests in a region and help fight or prevent the spread, helping several farmers.
In South China, a vegetation spectral library was established to record spectral data for specific growth stages of various crops and provide crop control strategy management to users [15]. Two spectral libraries have also been developed for selected plants in a tropical rainforest to store data from vegetation spectra such as leaf condition, vigour, and other physiological and biological factors [16]. Aside from that, the rubber tree disease spectral library was created to detect disease spread over a large area [17]. All spectrum libraries were created in response to particular observations and, for the most part, are inaccessible to the general public. Mobile applications help monitor pests and diseases but lack functions measuring the spectral signature between different pests and diseases. Therefore, a spectral library is an alternative approach to gathering all the spectral data for pests and diseases.
2. Mobile Application for Pest and Disease Management
2.1. Role of Mobile Applications in Monitoring Pest and Disease
Technologies developed in agriculture can help farmers to increase crop yield. However, damage caused by pests and diseases increases losses in crop production. Farmers typically carry out the detection of pests and diseases when the crop is in a severe condition. The early detection of pests and diseases using mobile applications is an alternative approach. Farmers can only send a report to the app by providing information that a particular crop is infected. The area of the infected crop will also be displayed on a map, and the system will be synchronised to inform all the farmers to observe their crop and suggest a method of control to prevent the spread to other neighbouring areas.
The developed applications are mostly focused on describing pests and diseases together with their (i) causal agent, (ii) symptoms, (iii) treatment of the infection and its results, and (iv) methods to control the infection. Previously, mobile applications developed for pest and disease management were applied to different crops such as rice [18][19], palm oil [20], cocoa [21], rubber [22], coffee [23], potato [24], wheat [25], cassava [26], and barley [27]. Table 1 shows the list of mobile applications that are widely used in pest and disease management.
Table 1. List of mobile applications and their function in pest and disease management.
| Name of Application | Function of Application | Country | Accuracy of Pest and/or Disease Identification | Reference |
|---|---|---|---|---|
| PlantifyAI | To diagnose 26 diseases across 14 crop species by offering treatment methods, common symptoms, and access to suggested cure treatments for each disease. | United States of America | Disease and crop classification: 95.7%. | Shrimali et al. [28] |
| Not mentioned | To identify and classify pests in images, extract characteristics of pests, and evaluate areas that prone to pests | Taiwan | Pest identification: 84%, and pest classification: 86% | Chen et al. [29] |
| Padi2U | To create a database of spectral signatures of weed species in rice fields | Malaysia | Weed separation species: 710 nm to 750 nm areas | Roslin et al. [30] |
| Mentha Mitra | To provide information about improved menthol mint types, nutrient requirements, diseases, and mechanisms for insect-pest control. | India | Not mentioned | Singh et al. [31] |
| Sistem Pakar Identifikasi Hama dan Penyakit Padi | To obtain a response from the user on the signs of pests and diseases that exist in rice | Indonesia | Not mentioned | Triono and Tristono [32] |
| e-RICE | To categorise the symptoms in order to make an accurate diagnosis of common rice diseases and problems. | Philippines | 4.29 rating by respondents agree that the app is functional in detecting disease | Morco et al. [33] |
| Dr Lada | To identify pests and diseases in peppers and propose appropriate techniques to solve the problem | Malaysia | Pest and disease diagnosis: 97% | Adama et al. [34] |
| PEST APP | To provide an early warning system on the infestation of the pest at early stages in paddy | Malaysia | Not mentioned | Nasir et al. [35] |
| Not mentioned | To identify the extend of cold-induced injuries in zucchini in real acquisition condition | Spain | Not mentioned | Novas et al. [36] |
| Leaf Analysis | To identify disease in different types of crop | Spain | Picon et al. [37] | |
| TobaccoApp | To detect any damage on tobacco leaf | Mexico | Damage caused by fungi: 97% | Valdez-Morones et al. [38] |
| Not mentioned | To control irrigation system and identify the images of plant leaf disease | India | Not mentioned | Ranjith et al. [39] |
| AuToDiDAC | To detect, separate, and assess the disease in cacao black pod rot | Philippines | Disease detection | Tan et al. [40] |
| cFertiGUAL | by calculating the amounts of fertiliser and monitoring irrigation systems, and select the best amongst the many crop growth systems and fertigation technologies | Spain | Disease detection: 97% | Pérez-Castro et al. [41] |
| FarmAR | To provide information about plants to farmers such as common name, scientific name of the plant, and plant diseases | Greece | Not mentioned | Katsaros and Keramopoulos [42] |
| Jaguza Livestock App | To improve the production and productivity of livestock by detecting livestock diseases and dealing with dangerous disease outbreaks. | Uganda | Not mentioned | Katamba and Mutebi [43] |
| BioLeaf | To quantify the foliar damage induced by insect herbivores on leaves | Brazil | Regular artificial damage: 25% and 50% of damaged area | Machado et al. [44] |
| Online at Sawah (OAS) | To detect diseases or pests that affect corn based on symptoms provided by users | Indonesia | Effectiveness: 82.5%, efficiency: 93.12%; learnability: 77.33%, and satisfaction: 73% | Simorangkir et al. [45] |
| Not mentioned | To identify the disease on wheat crop based on the detection of early symptom | Spain | Colour constancy algorithm of disease image: 0.81 | Johannes et al. [25] |
| Plant Disease | To diagnose plant disease with extensible set of diseases | Greece | Disease recognition: Between 80% and 98% | Petrellis [46] |
However, not all mobile applications in Table 1 used spectral signatures to detect pests and diseases. Weed is one of the components of pests and diseases. The specific characteristics of weeds can be visualized based on different wavelengths through spectral signature graphs. Hence, Roslin et al. [30] developed a new feature of the spectral signature library in mobile applications to differentiate and identify the location of weeds in the paddy field. The NIR reflectance values based on the spectral signature graph in order of highest to lowest are as follows: Jungle rice (Echinochloa spp.) > flower of jungle rice (Echinochloa spp.) > weedy rice (Oryza sativa L.) > red sparangletop (Leptochloa chinensis spp.) > saromacca grass (Ischaemum rugosum) > lesser fimbristylis (Fimbristylis miliacea) (Figure 1).
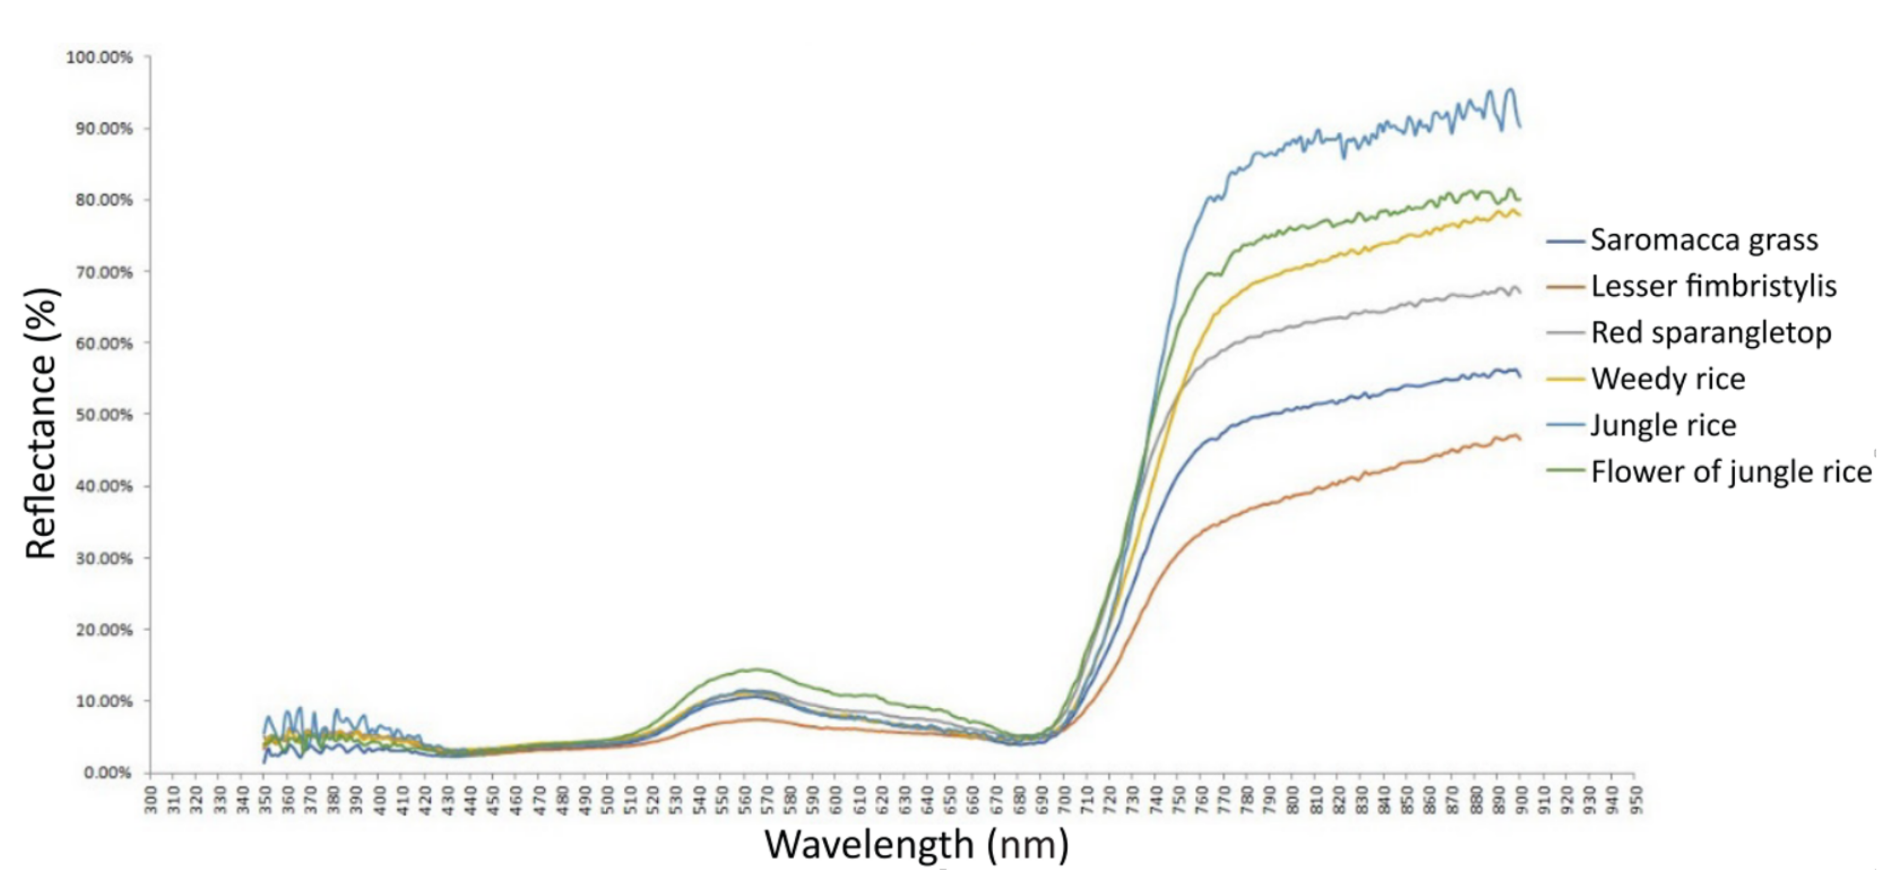
Figure 1. Spectral reflectance graph of different types of weeds in the paddy field.
One of the functionalities of mobile applications for pest and disease management is detecting early infection by taking photos and/or collecting information. For instance, PlantifyAI is a novel convolutional neural network-based mobile application that provides common symptoms, treatment methods, and proposed cure products for 26 crop diseases across 14 species [28]. On the other hand, Chen et al. [29] combined the current mature AIoT technology and deep learning YOLOv3 to develop pest identification systems in mobile applications. This application was combined with an unmanned aerial vehicle (UAV) to collect the image of Tessaratoma papillosa, which appeared on the back of leaves, to locate this pest in orchards.
Additionally, Padi2U is another mobile application developed by integrating multispectral imagery. This application provides a list of pests, photos of the disease and symptoms, and suggestions on how to control pests and diseases in paddy [30]. The information is explained in Malay language and is a simple way for farmers to understand the messages (Figure 2; Table 2). The photos of symptoms could be used as a reference to diagnose pests and diseases in the field. In another web application, Mentha Mitra, intended for menthol mint growers, provides information on many diseases and pests (insect). Using the feedback tool, any disease that has not yet been digitised in the app and any insect pest that is unable to be identified by the farmers can be reported together with a photo and remarks for scientific advisories [31].
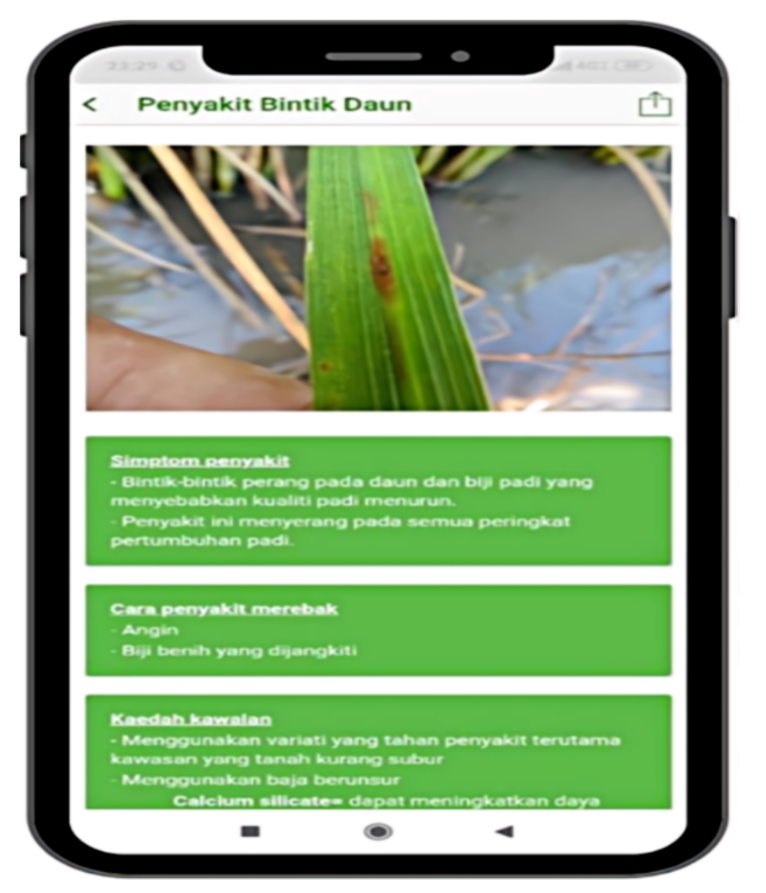
Figure 2. Example of the mobile application that displayed symptoms of disease infection on the crop.
Table 2. English translation of sentences in the mobile applications.
| Malay Language | English Language |
|---|---|
| Penyakit Bintik Daun | Lead spot disease |
| Simptom penyakit Bintik-bintik perang pada daun dan biji padi yang menyebabkan kualiti padi menurun. Penyakit ini menyerang pada semua peringkat pertumbuhan padi |
Symptoms of the disease Brown spots on the leaves and seeds of rice that cause the decline of rice quality. The disease attacks at all stages of rice growth. |
| Cara penyakit merebak Angin Biji benih yang dijangkiti |
Methods on the spread of disease Wind Infected seeds |
| Kaedah kawalan Menggunakan variati yang tahan penyakit terutama kawasan yang kurang subur. Menggunakan baja berunsur cancium sillicates |
Control methods Using disease-resistant varieties in less fertile areas Using calcium silicates fertilizers |
Sistem Pakar Identifikasi Hama dan Penyakit Padi (Paddy Pest and Disease Specialist Identification System) is another mobile application that identifies pests and diseases in paddy. The information was displayed in tabular form, including the causal agent, common and scientific names of the pest, a picture of the pest, symptoms, and the control method [32]. Firstly, the user needs to enter the consultation menu from the app and select which types of consultation the user needs, i.e., disease or pest. Secondly, the user needs to insert their name and answer all the questions generated in the system according to the symptoms that appear on the rice. Finally, the result of the consultation will appear, and the user can print or visualise the output through the application. e-RICE is another mobile application that provides information to farmers about pests and diseases in paddy. It uses a rule-based algorithm to classify rule generation based on the knowledge and information provided by experts in paddy to classify the symptoms given by a farmer for an actual diagnosis. Each evaluation of the disease diagnosis will be reviewed again by the developers, other farmers and agricultural officers [33].
In Malaysia, researchers from Universiti Kebangsaan Malaysia developed a mobile application named Dr Lada [34]. This application was used to detect pests and diseases in pepper. Users could diagnose the pest or disease infection from this application by answering questions, which minimised farmers’ dependency on an agricultural officer because they were able to diagnose diseases themselves. Furthermore, a research team from the International Rice Research Institute at the University of Queensland, Australia, the Philippine Rice Research Institute in the Philippines, and the Research Institute for Rice in Indonesia developed a mobile application to diagnose pest and disease infestation in crops by answering questions based on the symptoms that appeared. This application was called Rice Doctor and was used to identify the possible ways for the disease to spread and provide suggestions on how to diagnose/treat and overcome the infection. Furthermore, researchers from the National Rice Research Institute in India also developed a mobile application called riceXpert to provide information on the disease, pest, weed, and other possible causal agents that cause an infestation in paddy fields [47]. Using those mentioned applications, farmers could transfer the data from the field in a user-friendly way in a shorter timeframe to conduct decision making for pest and disease prevention.
2.2. Image Processing for Pest and Disease Monitoring Using the Mobile Application
Mobile applications require the user to capture an image of the infected part of the plant. Image preprocessing analyses the image with an algorithm built into the system [48]. The preprocessing step ensures that the image captured analyses the infected part only and excludes the background and healthy part, which is referred to as the separation technique. The colour of the image will be corrected based on colour constancy and uniformity [49]. The infected part will then be extracted and checked with the pest and disease image model to confirm the infection. The user will receive the results with the name of the pest and disease, the causal agent, a method to control the infection, and prevention guidelines to overcome the infection [50].
Additionally, the mobile application guides farmers to diagnose the infection and further process the application [51]. For cassava crops, AdSurv collected the infected crop images and labelled them on the images as evidence [52]. The disease diagnosis is also used to detect major diseases based on the symptoms that appear on the leaf, such as Cassava Mosaic Disease, Cassava Brown Streak Disease, Cassava bacteria blight, and Cassava green mite. The collection of images is divided into five categories of healthy plants. Another four types are based on each disease because each disease has distinct symptoms on leaves [53]. Therefore, farmers can use this application to diagnose the infected plant and assess the severity of the infection. Hence, image processing is one of the most common methods to visualize the infected plant using mobile applications.
2.3. Systems for Extraction of Disease Using the Mobile Application
A mobile application was developed to identify disease in crops, for example, paddy, using fuzzy entropy [54]. Fuzzy entropy is a system capable of modelling non-statistical imprecision and works well for disease extraction. The result showed that fuzzy entropy has more than 90% accuracy in detecting disease in paddy, except for tungro disease, with an accuracy of only approximately 70%. There are four diseases in paddy identified in the study, namely bacterial leaf blight, tungro disease, brown spot, and leaf blast. The camera captures the infected plant for image preprocessing that involves cropping, converting, and enhancement. For image extraction, fuzzy entropy is used to extract the disease. After that, image classification used a Probabilistic Neural Network to classify the disease. The results are shown in the mobile application. As a consequence, various systems in image processing could be used to extract pests and diseases on plants.
3. Spectral Signature Analysis for Pest and Disease Management
3.1. Spectral Reflectance in Monitoring Plant Health
Reflectance is a measure of electromagnetic energy that bounces back from the surface of a material. It is a wavelength-dependent ratio of reflected incident energy. Leaf reflectance in the visible (400 to 700 nm), near-infrared (NIR, 700 to 1100 nm), and shortwave infrared (SWIR, 1100 to 2500 nm) ranges are influenced by a variety of interactions. These interactions involve radiant energy absorption stimulated by leaf chemistry, light scattering due to the leaf surface and internal cellular structures, and radiant energy absorption caused by leaf water content, proteins, or carbon content [55].
Numerical knowledge of the canopy size is important for efficient farm management. Precision agriculture applications that seek to estimate this commonly use canopy health maps, i.e., as expressed by leaf area per unit (such as plant or meter of cordon), the leaf area index, or other canopy parameters (vegetation fraction and biomass) as a proxy. To correctly map the spatial variability of such farm features, remote sensing data from satellite, aircraft, or drone platforms is needed [56]. In the case of vertical shoot-positioned canopies, a substantial proportion of soil (bare or with cover crops) is exposed to nadir-viewing remote sensing from the inter-row area. Surface reflectance is subject to fluctuations caused by the canopy structure and its illumination at suggested spatial resolutions, equivalent to plant or row spacings [57].
Green vegetation of spectral signature feature basins in the visible range of the spectrum has shown pigmentation in plant tissues. Chlorophyll is the major photosynthetic pigment in green vegetation, and it is significantly absorbed in the chlorophyll absorption spectral bands at red (670 nm) and blue (450 nm). When a plant is pressured to the extent that chlorophyll growth is decreased, the amount of reflectance in red (670 nm) regions increases [58]. Water’s spectral response has different substances characteristic of light absorption NIR and beyond. The suspended sediments and increase in chlorophyll levels are two common elements influencing the spectral response of water. In each situation, the spectral response will change to indicate the presence of suspended sediments or algae in the water [59].
Detection anomalies in the photosynthetic parameters are crucial in remote sensing approaches. Changes in pigment, nutrients, cell structure, water intake, chemical concentrations, and gas exchange are subsequently displayed in the reflectance characteristics of the leaf or canopy [60]. The anomalous behaviour is then attributed to abiotic or abiotic stress. Indirectly, the observed and measured changes in spectral reflectance are related to plant stressors [61]. The data collected by the sensors are often compared using one of the various vegetation indices and subjected to extensive data analysis to be categorised as healthy or unhealthy and between different types of pests and diseases. Every extra step introduces uncertainty into the technique.
As most of the previous studies are specific to the combination of the crop and a pest or disease and relate to external factors, the findings in the literature are non-uniform and it is challenging to compare them quantitatively. As an example, extrinsic factors such as the leaf internal structure, surface features, and water content could influence the pigment absorption of plants. Hence, no single wavelength is associated with a single pigment concentration [62]. Due to the failures of this method, researchers have turned to correlation analyses to establish unique pathogen-specific spectrum signatures, such as a spectral index and ratio with discriminant analyses [63][64], but they do not provide conclusive optimal spectral signatures. However, the same findings indicate that the sensitivity of particular spectral areas with significant absorption corresponds to abiotic and biotic factors such as pigmentation [65]. Figure 3 depicts a framework of plant health monitoring employing spectral signature analysis.
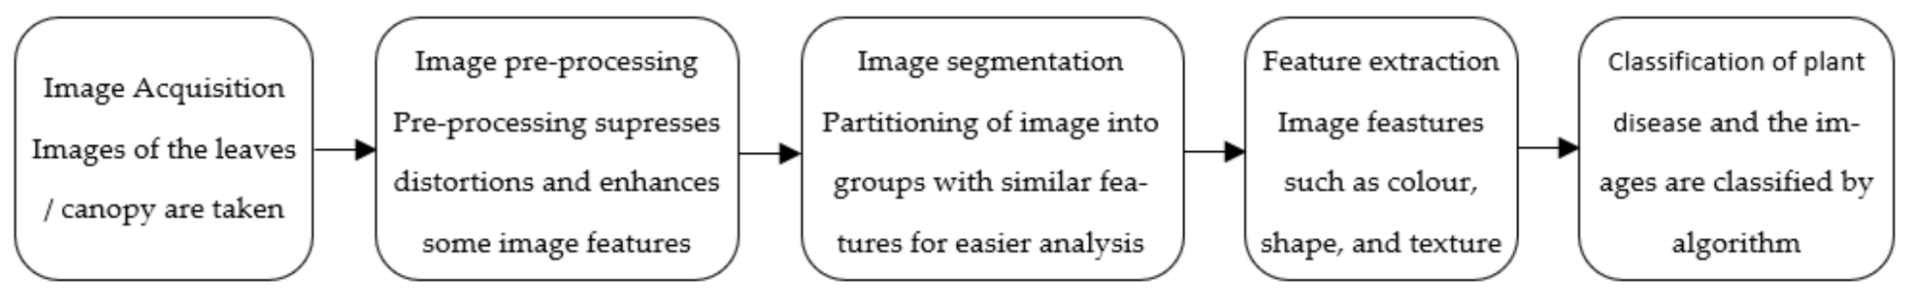
Figure 3. Steps in spectral signature analysis for plant health monitoring.
The use of spectral signatures for pest and plant diseases in the parametric analysis is limited. Non-parametric techniques such as Principal Component Analysis, Cluster Analysis, Support Vector Machines, Partial Least-Squares, and Artificial Neural Networks (ANNs) have been widely adopted by researchers [66][67][68]. For example, in general terms, PCA is one kind of feature extraction method that helps to find the highest contribution of points, and the highest contribution of points can be identified through the highest eigenvalues with principal component during PCA analysis. Therefore, the lowest contributions amongst those points can be omitted and only the points with the highest contribution are selected for further processing/analysis. Generally, a comparison between thermal, fluorescence, and hyperspectral imaging supports a multi-sensor data fusion method to measure plant health [69]. A comprehensive study [70] on head blight on wheat highlighted each system’s main benefits and drawbacks and subsequently studied the individual sensor combinations. Using IR in the 7.5–12 m wavelength region, thermography-based sensors showed temperature differences between crops influenced by biotic and abiotic stresses. While chlorophyll fluorescence-based approaches in the visible spectrum are widely utilised, they are inhibited by the need for dark adaptation to minimise the effect of sunlight on the measurement. Hence, spectral reflectance could be used in monitoring plant health.
3.2. Spectral Signature of Pest and Diseases in the Crop Field
Both hyperspectral imaging and non-imaging sensors are effective techniques for detecting changes in plant health [71]. Changes in reflectance are caused by plant tissue’s biophysical and biochemical properties. Plant diseases can alter tissue colour and leaf shape, transpiration rate, crop canopy morphology and density, and the interaction of solar radiation with plants [72]. They cause changes in the optical characteristics of leaf tissue. As there are changes in pigmentation, the hypersensitive response, and cell wall deterioration, leaf reflectance is thus susceptible to plant stress [73]. Pest and disease-specific symptoms, such as the succession of chlorotic and necrotic tissue with different optical properties and composition, as well as typical fungal structures such as powdery mildews, rusts, and downy mildews, may be identifiable.
When plants are subjected to infections that cause chlorotic and necrotic symptoms, the composition and content of leaf pigments change. The type of host–pathogen interaction influences the pattern of responses and the degree of up- and down-regulation of physiological systems. Necrotrophs rapidly kill plant cells and then feed on the nutrients generated by the dead tissue, whereas biotroph pathogens create haustoria to take nutrients from living cells [74]. Because the characteristics of the symptoms vary, different wavebands may be appropriate for detecting various diseases. Using sensing techniques, identifying a disease, its discrimination from other diseases, and abiotic stressors is still a challenge in vegetation monitoring. The interpretation of spectral reflectance data without knowledge of the spectral characteristics of leaves and typical symptoms is impossible at present. The highest findings of disease detection were found in the visible and NIR ranges of the spectrum. For example, reflectance spectroscopy was employed to identify the wilt induced by the vascular fungus Fusarium oxysporum from that caused by drought in tomatoes [75].
Differences in spectra, ratios, or derivations can be used to distinguish changes in spectral reflection and differences in spectral signatures [76]. This method can compare the spectra of healthy and unhealthy plants. Meng et al. [77] discovered various important regions of different spectra between healthy plants and plants infected with Cercospora leaf spot, powdery mildew, and sugar beet rust. Based on an understanding of reflectance properties, spectral algorithms for remote sensing of vegetation have been created, which use specific wavelengths of spectral signatures. They are linked to various biochemical and biophysical plant factors that indicate plant health. Spectral vegetation indices are frequently used to monitor, analyse, and map temporal and spatial variation in vegetation.
Disease symptoms can be seen at specific wavelengths and might include any number of changes in the plant’s colour, shape, or functioning as it responds to disease. The disease symptoms vary depending on the pathogen and include leaf spots, chlorosis, necrosis, wilting, or overgrowth. Plant stress other than diseases can activate protective mechanisms that result in suboptimal development, chlorophyll loss, or changes in surface temperatures [78]. These changes cause noticeable modifications in the spectral signature compared to a healthy plant and may be detected using several approaches [79].
Based on Figure 4, visible light can be applied to evaluate variations in the colour and morphology of infected plant tissue. Changes in water content, leaf thickness, and photosynthetic efficiency could be detected using infrared and short-wave infrared, whereby long-wave infrared can be used to monitor plant surface temperatures. Multiple images are captured using hyperspectral sensors over its wavelength range of 300–2500 nm. Furthermore, imaging devices measure the absorption, transmission, and reflectance of input electromagnetic radiation interacting with the plant surface. Compared to healthy tissue, infected plant tissue generally has a lower reflectivity. Image analysis algorithms determine the contrast between diseased and non-diseased leaf areas [31].
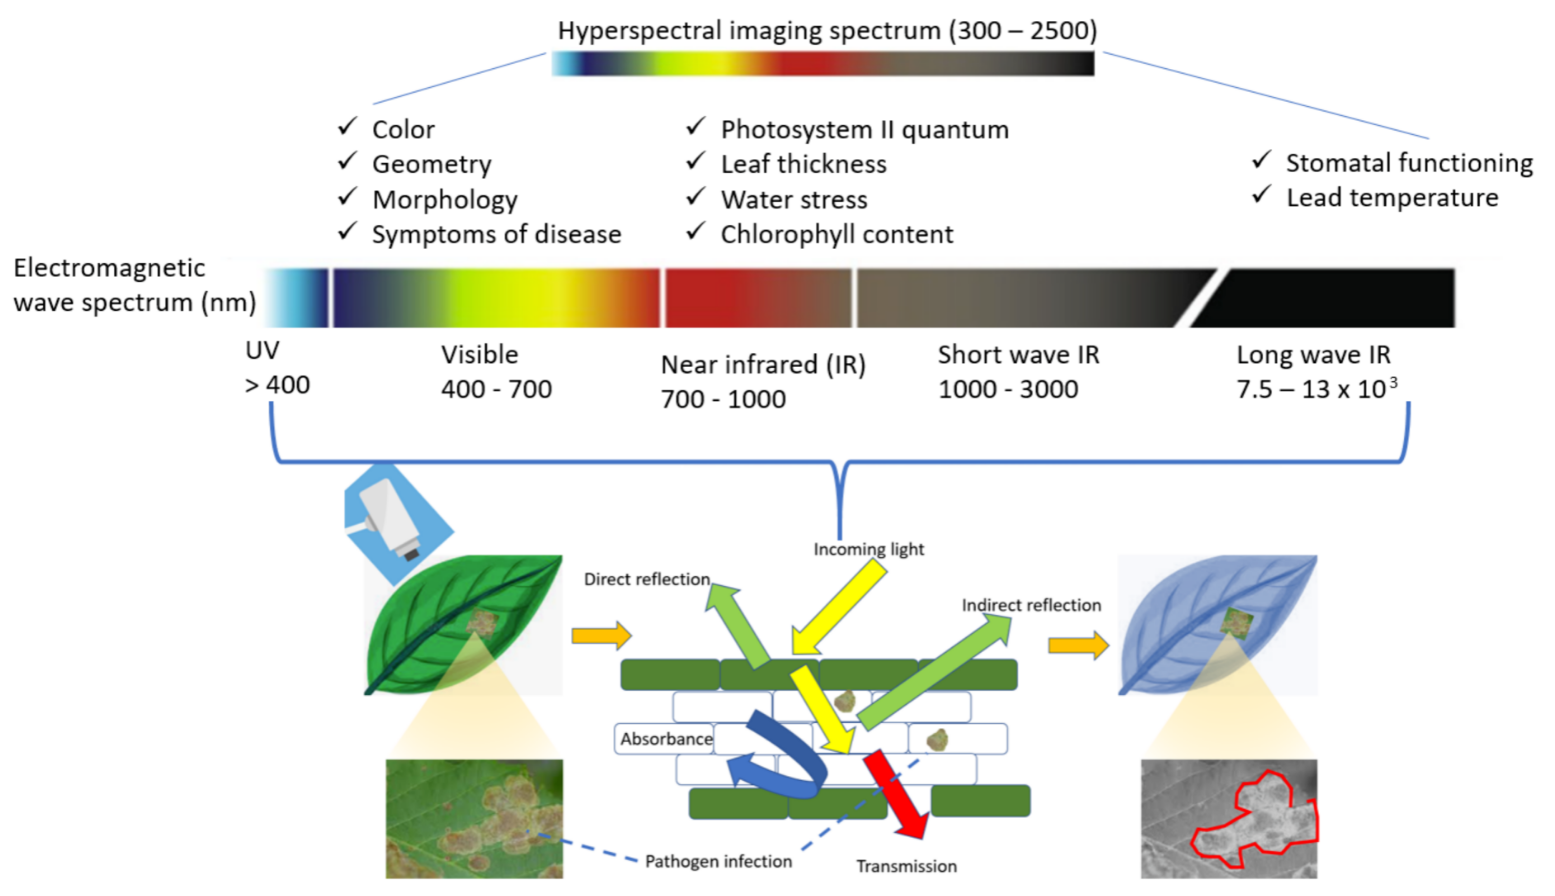
Figure 4. Techniques for high-throughput phenotyping of plants and diseases.
A great deal of research has shown that textural and phrenological differences can also be considered as a viable technique using hyperspectral data for the remote identification of invasive plants such as the Nile rose or water hyacinth (Eichhornia crassipes). In contrast to previous broadband multispectral sensors, new-generation sensors such as Sentinel 2 and Landsat 8 sensors of invasive plants such as the Nile rose or water hyacinth (Eichhornia crassipes) with superior sensing properties have presented untapped prospective options [80]. The spectral reflectance of the Landsat 8 operational land imager OLI was used to distinguish the water hyacinth’s spectral signature from other plants. These indices revealed the highest reflection of the water hyacinth plant compared to other plants.
As each vegetation species has similar spectral signatures, spectral classification of vegetation types in complex environments is difficult [81]. However, other researchers discovered that water hyacinth has a specific spectral or textural signal that allows it to be distinguished from surrounding native flora [82]. Textural and phonological variations were efficient approaches for identifying water hyacinth. Another contribution showed that hyperspectral data constitute an appropriate strategy for detecting invasive plants based on differences in spectral signatures [83]. Water hyacinth displayed higher NIR reflectance values than related plant species and water, owing to the high reflectance of the internal spongy leaf structure (700–1000 nm) [84]. The spectral signatures of hyacinth detected typical characteristics with low reflectance in the visible part of the spectrum due to high concentrations of chlorophyll-a, which is an indicator of healthy aquatic vegetation conditions [85].
References
- Costopoulos, C.; Ntaliani, M.; Karetsos, S. Studying Mobile Apps for Agriculture. IOSR J. Mob. Comput. Appl. 2016, 3, 44–49.
- Bayrak, T. Identifying Technical Requirements for a Mobile Business Analytics Application. Int. J. Bus. Anal IJBAN 2021, 8, 91–103.
- Tudpor, K.; Wongkongdech, A.; Wongkongdech, R.; Chaiyakarm, T.; Jitsukka, W.; Sombateyotha, K.; Leethongdeesakul, S.; Kuboonya-Aragsa, N.; Chantarsombat, C.; Kimchai, K. Geographic Information System-Based Mobile Application Design for Health Care in Older Persons in Rural Community by Village Health Volunteers. Stud. Health Technol. Inform. 2022, 289, 426–429.
- Mei, A.W.S.; Hong, P.L.; Keikhosrokiani, P.; Xin, C.H.; Ying, T.X.; Samat, N. A GIS-based Mobile Application to Improve Tourism Experience: A Case Study of Terengganu, Malaysia. In Proceedings of the 2021 International Congress of Advanced Technology and Engineering (ICOTEN), Taiz, Yemen, 4–5 July 2021; pp. 1–10.
- Aletdinova, A.A. Popular Mobile Applications for Crop Production. In IOP Conference Series: Earth and Environmental Science; IOP Publishing: Bristol, UK, 2021; Volume 666, p. 032036.
- Monzon, J.P.; Calviño, P.A.; Sadras, V.O.; Zubiaurre, J.B.; Andrade, F.H. Precision agriculture based on crop physiological principles improves whole-farm yield and profit: A case study. Eur. J. Agron. 2018, 99, 62–71.
- Neupane, A.; Bulbul, I.; Wang, Z.; Lehman, R.M.; Nafziger, E.; Marzano, S.Y.L. Long term crop rotation effect on subsequent soybean yield explained by soil and root-associated microbiomes and soil health indicators. Sci. Rep. 2021, 11, 9200.
- Nesarajan, D.; Kunalan, L.; Logeswaran, M.; Kasthuriarachchi, S.; Lungalage, D. Coconut disease prediction system using image processing and deep learning techniques. In Proceedings of the 2020 IEEE 4th International Conference on Image Processing, Applications and Systems (IPAS), Genova, Italy, 9–11 December 2020; pp. 212–217.
- Thar, S.P.; Ramilan, T.; Farquharson, R.J.; Pang, A.; Chen, D. An empirical analysis of the use of agricultural mobile applications among smallholder farmers in Myanmar. Electron. J. Inf. 2021, 87, e12159.
- Sivagnanasundaram, J.; Ginige, A.; Goonetillake, J. Farmers as sensors: A crowdsensing platform to generate agricultural pest incidence reports. In Proceedings of the 2019 International Conference on Internet of Things Research and Practice (iCIOTRP), Sydney, Australia, 24–26 November 2019; pp. 13–18.
- Su, W.H. Advanced machine learning in point spectroscopy, RGB-and hyperspectral-imaging for automatic discriminations of crops and weeds: A review. Smart Cities 2020, 3, 767–792.
- Yang, X.F.; Kong, C.H. Interference of allelopathic rice with paddy weeds at the root level. Plant Biol. 2017, 19, 584–591.
- Nelson, S.C.; Corcoja, I.; Pethybridge, S.J. Cluster: A New Application for Spatial Analysis of Pixelated Data for Epiphytotics. Phytopathology 2017, 107, 1556–1566.
- Rossel, R.V.; Behrens, T.; Ben-Dor, E.; Brown, D.J.; Demattê, J.A.M.; Shepherd, K.D.; Shi, Z.; Stenberg, B.; Stevens, A.; Adamchuk, V.; et al. A global spectral library to characterize the world’s soil. Earth-Sci. Rev. 2016, 155, 198–230.
- Chen, S.S.; Fang, L.G.; Liu, Q.H.; Chen, L.F.; Tong, Q.X. The design and development of spectral library of featured crops of South China. In Proceedings of the 2005 IEEE International Geoscience and Remote Sensing Symposium, IGARSS’05, Seoul, Korea, 29 July 2005; Volume 2, p. 4.
- Lau, A.M.S.; Hashim, M. The design and building of spectral library of tropical rain forest in Malaysia. In Proceedings of the 28th Asian Conference on Remote Sensing, Kuala Lumpur, Malaysia, 12–16 November 2007; Asian Association on Remote Sensing: Tokyo, Japan; Volume 2, pp. 1150–1157.
- Jusoff, K.; Yusoff, M.M.; Ali, N.H.M. Spectral signatures of leaf fall diseases in Hevea brasiliensis using a handheld spectroradiometer. Mod. Appl. Sci. 2010, 4, 78–84.
- Ponnamperuma Arachchi, J.; Bandara, D.M.B.N.; Perera, S.P.M.G.N.H.; Nilakshi, S.V.; Nugaliyadde, L.; Sisira Kumara, W.A.G. An e-pest surveillance and advisory system to empower farmers in managing rice pests and diseases in Sri Lanka. In Proceedings of the International Research Conference on Smart Computing and Systems Engineering-SCSE, Department of Industrial Management, Faculty of Science, University of Kelaniya, Colombo, Sri Lanka, 29 March 2018.
- Mohapatra, S.D.; Tripathi, R.; Acharya, P.; Shahid, M.; Raghu, S.; Guru, P.K.; Dash, S.K. NRRI’riceXpert’APP: Taking rice technologies in the doorstep of farmers. In Proceedings of the Souvenir: 3rd ARRW International Symposium, Cuttack, India, 6–9 February 2018.
- Mostafa, S.A.; Hazeem, A.A.; Khaleefahand, S.H.; Mustapha, A.; Darman, R. A Collaborative Multi-agent System for Oil Palm Pests and Diseases Global Situation Awareness. In Proceedings of the Future Technologies Conference, Vancouver, BC, Canada, 13–14 November 2018; Springer: Cham, Switzerland, 2018; pp. 763–775.
- Rahim, S.E.; Supli, A.A.; Damiri, N. Developing a land suitability evaluation tool in mobile android application for rubber, cocoa and oil palm. J. Int. Soc. Southeast Asian Agric. Sci. 2016, 22, 80–90.
- De, A.; Singh, S.P. Analysis of fuzzy applications in the agri-supply chain: A literature review. J. Clean. Prod. 2021, 283, 124577.
- Yusof, M.M.; Rosli, N.F.; Othman, M.; Mohamed, R.; Abdullah, M.H.A. M-DCocoa: M-Agriculture Expert System for Diagnosing Cocoa Plant Diseases. In Proceedings of the International Conference on Soft Computing and Data Mining, Johor, Malaysia, 6–7 February 2018; Springer: Cham, Switzerland, 2018; pp. 363–371.
- Rachman, T.; Napitupulu, D. User acceptance analysis of potato expert system application based on TAM approach. Int. J. Adv. Sci. Eng. Inf. Technol. 2018, 8, 185–191.
- Johannes, A.; Picon, A.; Alvarez-Gila, A.; Echazarra, J.; Rodriguez-Vaamonde, S.; Navajas, A.D.; Ortiz-Barredo, A. Automatic plant disease diagnosis using mobile capture devices, applied on a wheat use case. Comput. Electron. Agric. 2017, 138, 200–209.
- Ramcharan, A.; Baranowski, K.; McCloskey, P.; Ahmed, B.; Legg, J.; Hughes, D.P. Deep learning for image-based cassava disease detection. Front. Plant Sci. 2017, 8, 1852.
- Walls, J.T., III; Caciagli, P.; Tooker, J.F.; Russo, J.M.; Rajotte, E.G.; Rosa, C. Modeling the decision process for barley yellow dwarf management. Comput. Electron. Agric. 2016, 127, 775–786.
- Shrimali, S. PlantifyAI: A Novel Convolutional Neural Network Based Mobile Application for Efficient Crop Disease Detection and Treatment. Procedia Comput. Sci. 2021, 191, 469–474.
- Chen, C.J.; Huang, Y.Y.; Li, Y.S.; Chang, C.Y.; Huang, Y.M. An AIoT based smart agricultural system for pests detection. IEEE Access 2020, 8, 180750–180761.
- Roslin, N.A.; Che’Ya, N.N.; Sulaiman, N.; Nor Alahyadi, L.A.; Ismail, M.R. Mobile Application Development for Spectral Signature of Weed Species in Rice Farming. Pertanika J. Sci. Technol. 2021, 29, 2241–2259.
- Singh, N.K.; Dutta, A.; Puccetti, G.; Croll, D. Tackling microbial threats in agriculture with integrative imaging and computational approaches. Comput. Struct. Biotechnol. J. 2021, 19, 372–383.
- Triono, J.; Tristono, T. Expert System Identification of Pest and Diseases of Rice using Html5. Int. J. Adv. Res. Comput. Sci. Softw. Eng. 2016, 7, 60–63.
- Morco, R.C.; Calanda, F.B.; Bonilla, J.A.; Corpuz, M.J.S.; Avestro, J.E.; Angeles, J.M. E-Rice: An Expert System using Rule-Based Algorithm to Detect, Diagnose, and Prescribe Control Options for Rice Plant Diseases in the Philippines. In Proceedings of the 2017 International Conference on Computer Science and Artificial Intelligence, Jakarta, Indonesia, 5–7 December 2017; pp. 49–54.
- Adama, A.; Ee, K.P.; Sahari, N.; Tida, A.; Shang, C.Y.; Tawie, K.M.; Mohamad, H. Dr. LADA: Diagnosing black pepper pest and diseases with decision tree. Int. J. Adv. Sci. Eng. Inf. Technol. 2018, 8, 1584–1590.
- Nasir, H.; Aris, A.N.; Lajis, A.; Kadir, K.; Safie, S.I. Development of Android Application for Pest Infestation Early Warning System. In Proceedings of the 2018 IEEE 5th International Conference on Smart Instrumentation, Measurement and Application (ICSIMA), Songkhla, Thailand, 28–30 November 2018; pp. 1–5.
- Novas, N.; Alvarez-Bermejo, J.A.; Valenzuela, J.L.; Gázquez, J.A.; Manzano-Agugliaro, F. Development of a smartphone application for assessment of chilling injuries in zucchini. Biosyst. Eng. 2019, 181, 114–127.
- Picon, A.; Alvarez-Gila, A.; Seitz, M.; Ortiz-Barredo, A.; Echazarra, J.; Johannes, A. Deep convolutional neural networks for mobile capture device-based crop disease classification in the wild. Comput. Electron. Agric. 2019, 161, 280–290.
- Valdez-Morones, T.; Pérez-Espinosa, H.; Avila-George, H.; Oblitas, J.; Castro, W. An Android App for detecting damage on tobacco (Nicotiana tabacum L.) leaves caused by blue mold (Penospora tabacina Adam). In Proceedings of the 2018 7th International Conference on Software Process Improvement (CIMPS), Guadalajara, México, 17–19 October 2018; pp. 125–129.
- Ranjith; Anas, S.; Badhusha, I.; Zaheema, O.T.; Faseela, K.; Shelly, M. Cloud based automated irrigation and plant leaf disease detection system using an android application. In Proceedings of the 2017 International conference of Electronics, Communication and Aerospace Technology (ICECA), Coimbatore, India, 20–22 April 2017; Volume 2, pp. 211–214.
- Tan, D.S.; Leong, R.N.; Laguna, A.F.; Ngo, C.A.; Lao, A.; Amalin, D.M.; Alvindia, D.G. AuToDiDAC: Automated tool for disease detection and assessment for cacao black pod rot. Crop Prot. 2018, 103, 98–102.
- Pérez-Castro, A.; Sánchez-Molina, J.A.; Castilla, M.; Sánchez-Moreno, J.; Moreno-Úbeda, J.C.; Magán, J.J. cFertigUAL: A fertigation management app for greenhouse vegetable crops. Agric. Water Manag. 2017, 183, 186–193.
- Katsaros, A.; Keramopoulos, E. FarmAR, a farmer’s augmented reality application based on semantic web. In Proceedings of the 2017 South Eastern European Design Automation, Computer Engineering, Computer Networks and Social Media Conference (SEEDA-CECNSM), Kastoria, Greece, 23–25 September 2017; pp. 1–6.
- Katamba, R.; Mutebi, B. Jaguza livestock app, the app transforming livestock production and strengthening food security. In Proceedings of the 2017 IST-Africa Week Conference (IST-Africa), Windhoek, Namibia, 31 May–2 June 2017; pp. 1–12.
- Machado, B.B.; Orue, J.P.; Arruda, M.S.; Santos, C.V.; Sarath, D.S.; Goncalves, W.N.; Rodrigues, J.F., Jr. BioLeaf: A professional mobile application to measure foliar damage caused by insect herbivory. Comput. Electron. Agric. 2016, 129, 44–55.
- Simorangkir, G.D.; Sarwoko, E.A.; Sasongko, P.S.; Endah, S.N. Usability Testing of Corn Diseases and Pests Detection on a Mobile Application. In Proceedings of the 2018 2nd International Conference on Informatics and Computational Sciences (ICICoS), Semarang, Indonesia, 30–31 October 2018; pp. 1–6.
- Petrellis, N. Plant disease diagnosis for smart phone applications with extensible set of diseases. Appl. Sci. 2019, 9, 1952.
- Rice Doctor—Apps on Google Play. May 2019. Available online: https://play.google.com/store/apps/details?id=com.lucidcentral.mobile.ricedoctor&hl=en (accessed on 9 January 2021).
- Miao, Z.; Yu, X.; Li, N.; He, C.; Sun, T. Weed Detection Based on the Fusion of Multiple Image Processing Algorithms. In Proceedings of the 2021 40th Chinese Control Conference (CCC), Shanghai, China, 26–28 July 2021; pp. 4217–4222.
- Mendes, J.; Pinho, T.M.; dos Santos, F.N.; Sousa, J.J.; Peres, E.; Boaventura-Cunha, J.; Cunha, M.; Morais, R. Smartphone applications targeting precision agriculture practices—A systematic review. Agronomy 2020, 10, 855.
- Ouhami, M.; Hafiane, A.; Es-Saady, Y.; El Hajji, M.; Canals, R. Computer vision, IoT and data fusion for crop disease detection using machine learning: A survey and ongoing research. Remote Sens. 2021, 13, 2486.
- Mrisho, L.M.; Mbilinyi, N.A.; Ndalahwa, M.; Ramcharan, A.M.; Kehs, A.K.; McCloskey, P.C.; Murithi, H.; Hughes, D.P.; Legg, J.P. Accuracy of a smartphone-based object detection model, PlantVillage Nuru, in identifying the foliar symptoms of the viral diseases of cassava–CMD and CBSD. Front. Plant Sci. 2020, 1964.
- Mutembesa, D.; Omongo, C.; Mwebaze, E. Crowdsourcing real-time viral disease and pest information: A case of nation-wide cassava disease surveillance in a developing country. In Proceedings of the Sixth AAAI Conference on Human Computation and Crowdsourcing, Zürich, Switzerland, 5–8 July 2018.
- Vasavi, P.; Punitha, A.; Narayana Rao, T.V. Crop leaf disease detection and classification using machine learning and deep learning algorithms by visual symptoms: A review. Int. J. Electr. Comput. Eng. 2022, 12, 2079–2086.
- Majid, K.; Herdiyeni, Y.; Rauf, A. I-PEDIA: Mobile application for paddy disease identification using fuzzy entropy and probabilistic neural network. In Proceedings of the 2013 International Conference on Advanced Computer Science and Information Systems (ICACSIS), Bali, Indonesia, 28–29 September 2013; pp. 403–406.
- Akbar, S. Handbook of 200 Medicinal Plants: A Comprehensive Review of Their Traditional Medical Uses and Scientific Justifications; Springer: Cham, Switzerland, 2020.
- Towers, P.C.; Poblete-Echeverría, C. Effect of the Illumination Angle on NDVI Data Composed of Mixed Surface Values Obtained over Vertical-Shoot-Positioned Vineyards. Remote Sens. 2021, 13, 855.
- Hall, A.; Lamb, D.W.; Holzapfel, B.; Louis, J. Optical remote sensing applications in viticulture—A Review. Aust. J. Grape Wine Res. 2002, 8, 36–47.
- Zhu, J.Y.; He, W.J.; Wang, H.Q.; Yao, J.M.; Qin, G.M.; Xu, C.Y.; Huang, T. The Response of Spectral Characteristics and Leaf Functional Traits of Euonymus Japonicas to Leaf Dustfall. Spectrosc. Spectr. Anal. 2020, 40, 1620–1625.
- Al Shehhi, M.R.; Gherboudj, I.; Ghedira, H. Detection of algal blooms over optically complex waters of the Arabian Gulf and Sea of Oman using MODIS fluorescence data. Int. J. Remote Sens. 2019, 40, 3751–3771.
- Soares, J.C.; Santos, C.S.; Carvalho, S.M.; Pintado, M.M.; Vasconcelos, M.W. Preserving the nutritional quality of crop plants under a changing climate: Importance and strategies. Plant Soil 2019, 443, 1–26.
- Veettil, B.K.; Ward, R.D.; Lima, M.D.A.C.; Stankovic, M.; Hoai, P.N.; Quang, N.X. Opportunities for seagrass research derived from remote sensing: A review of current methods. Ecol. Indic. 2020, 117, 106560.
- Landi, M.; Agati, G.; Fini, A.; Guidi, L.; Sebastiani, F.; Tattini, M. Unveiling the shade nature of cyanic leaves: A view from the “blue absorbing side” of anthocyanins. Plant Cell Environ. 2021, 44, 1119–1129.
- Eberlein, J.; Davenport, B.; Nguyen, T.T.; Victorino, F.; Jhun, K.; van der Heide, V.; Kuleshov, M.; Ma’ayan, A.; Kedl, R.; Homann, D. Chemokine signatures of pathogen-specific T cells I: Effector T cells. J. Immunol. 2020, 205, 2169–2187.
- Furlanetto, R.H.; Nanni, M.R.; Mizuno, M.S.; Crusiol, L.G.T.; da Silva, C.R. Identification and classification of Asian soybean rust using leaf-based hyperspectral reflectance. Int. J. Remote Sens. 2021, 42, 4177–4198.
- Golob, A.; Kavčič, J.; Stibilj, V.; Gaberščik, A.; Vogel-Mikuš, K.; Germ, M. The effect of selenium and UV radiation on leaf traits and biomass production in Triticum aestivum L. Ecotoxicol. Environ. Saf. 2017, 136, 142–149.
- Zheng, Y.; Fan, C.; Liu, M.; Chen, Y.; Lu, Z.; Xu, N.; Huang, H.; Zeng, H.; Liu, S.; Cao, H.; et al. Overall quality control of the chemical and bioactive consistency of ShengMai Formula. J. Pharm. Biomed. Anal. 2020, 189, 113411.
- Teofilović, B.; Grujić-Letić, N.; Gligorić, E.; Rašković, A.; Igić, R.; Vastag, G.; Gadžurić, S. Experimental and Computational Evaluation of Extraction Procedure and Scavenging Capacity of Sweet Basil Extracts (Ocimum basilicum L.). Plant Foods Hum. Nutr. 2021, 76, 240–247.
- Arias, F.; Zambrano, M.; Broce, K.; Medina, C.; Pacheco, H.; Nunez, Y. Hyperspectral imaging for rice cultivation: Applications, methods and challenges. AIMS Agric. Food 2021, 6, 273–307.
- Hernández-Clemente, R.; Hornero, A.; Mottus, M.; Peñuelas, J.; González-Dugo, V.; Jiménez, J.C.; Suárez, L.; Alonso, L.; Zarco-Tejada, P.J. Early diagnosis of vegetation health from high-resolution hyperspectral and thermal imagery: Lessons learned from empirical relationships and radiative transfer modelling. Curr. For. Rep. 2019, 5, 169–183.
- Mahlein, A.-K.; Alisaac, E.; Al Masri, A.; Behmann, J.; Dehne, H.-W.; Oerke, E.-C. Comparison and combination of thermal, fluorescence, and hyperspectral imaging for monitoring fusarium head blight of wheat on spikelet scale. Sensors 2019, 19, 2281.
- Guo, Y.; Chen, S.; Wu, Z.; Wang, S.; Robin Bryant, C.; Senthilnath, J.; Cunha, M.; Fu, Y.H. Integrating Spectral and Textural Information for Monitoring the Growth of Pear Trees Using Optical Images from the UAV Platform. Remote Sens. 2021, 13, 1795.
- Keller, M. The Science of Grapevines; Academic Press: Cambridge, MA, USA, 2020.
- Mandi, S.S. Natural UV Radiation in Enhancing Survival Value and Quality of Plants; Springer: New Delhi, India, 2016.
- Doehlemann, G.; Ökmen, B.; Zhu, W.; Sharon, A. Plant pathogenic fungi. Microbiol. Spectr. 2017, 5, 5.1.14.
- Marın-Ortiz, J.C.; Gutierrez-Toro, N.; Botero-Ferna´ndez, V.; Hoyos- Carvajal, L.M. Linking physiological parameters with visible/ near-infrared leaf reflectance in the incubation period of vascular wilt disease. Saudi J. Biol. Sci. 2020, 27, 88–99.
- Soja-Woźniak, M.; Craig, S.E.; Kratzer, S.; Wojtasiewicz, B.; Darecki, M.; Jones, C.T. A novel statistical approach for ocean colour estimation of inherent optical properties and cyanobacteria abundance in optically complex waters. Remote Sens. 2017, 9, 343.
- Meng, R.; Lv, Z.; Yan, J.; Chen, G.; Zhao, F.; Zeng, L.; Xu, B. Development of Spectral Disease Indices for Southern Corn Rust Detection and Severity Classification. Remote Sens. 2020, 12, 3233.
- Moore, C.E.; Meacham-Hensold, K.; Lemonnier, P.; Slattery, R.A.; Benjamin, C.; Bernacchi, C.J.; Lawson, T.; Cavanagh, A.P. The effect of increasing temperature on crop photosynthesis: From enzymes to ecosystems. J. Exp. Bot. 2021, 72, 2822–2844.
- Martinelli, F.; Scalenghe, R.; Davino, S.; Panno, S.; Scuderi, G.; Ruisi, P.; Villa, P.; Stroppiana, D.; Boschetti, M.; Goulart, L.R.; et al. Advanced methods of plant disease detection. A review. Agron. Sustain. Dev. 2015, 35, 1–25.
- Al-lami, A.K.; Abbood, R.A.; Al Maliki, A.A.; Al-Ansari, N. Using vegetation indices for monitoring the spread of Nile Rose plant in the Tigris River within Wasit province, Iraq. Remote Sens. Appl. Soc. Environ. 2021, 22, 100471.
- Thamaga, K.H.; Dube, T. Testing two methods for mapping water hyacinth (Eichhornia crassipes) in the Greater Letaba river system, South Africa: Discrimination and mapping potential of the polar-orbiting Sentinel-2 MSI and Landsat 8 OLI sensors. Int. J. Remote Sens. 2018, 39, 8041–8059.
- Bradly, B. Remote detection of invasive plants: A review of spectral, textural and phenological approaches. Biol. Invaions 2014, 16, 1411–1425.
- Paz-Kagan, T.; Silver, M.; Panov, N.; Karnieli, A. Multispectral approach for identifying invasive plant species based on flowering phenology characteristics. Remote Sens. 2019, 11, 953.
- Dube, T.; Mutanga, O.; Sibanda, M.; Bangamwabo, V.; Shoko, C. Evaluation the performance of the newly-launched Landsat 8 sensor in detecting and mapping the spatial confguration of water hyacinth (Eichhornia crassipes) in inland lakes, Zimbabwe. Phys. Chem. Earth Parts A/B/C 2017, 100, 101–111.
- Chander, S.; Pompapathi, V.; Gujrati, A.; Singh, R.P.; Chaplot, N.; Patel, U.D. Growth of invasive aquatic macrophytes over Tapi river. In Proceedings of the International Archives of the Photogrammetry, Remote Sensing and Spatial Information Sciences, Volume XLII- 5, 2018 ISPRS TC V Mid-term Symposium “Geospatial Technology—Pixel to People”, Dehradun, India, 20–23 November 2018.
More
Information
Subjects:
Agronomy
Contributors
MDPI registered users' name will be linked to their SciProfiles pages. To register with us, please refer to https://encyclopedia.pub/register
:
View Times:
2.0K
Entry Collection:
Remote Sensing Data Fusion
Revisions:
2 times
(View History)
Update Date:
28 Apr 2022
Table of Contents


Notice
You are not a member of the advisory board for this topic. If you want to update advisory board member profile, please contact office@encyclopedia.pub.
OK
Confirm
Only members of the Encyclopedia advisory board for this topic are allowed to note entries. Would you like to become an advisory board member of the Encyclopedia?
Yes
No
${ textCharacter }/${ maxCharacter }
Submit
Cancel
Back
Comments
${ item }
|
${ item.createdUser.fullName }
${ item.createdAt }
${ item.vote }
${ item.reply }
Delete
${ reply.createdUser.fullName }
${ reply.createdAt }
${ reply.vote }
Delete
There is no reply to this comment~
${ item.replyTextCharacter }/${ item.replyMaxCharacter }
Submit
Cancel
More
No more~
There is no comment~
${ textCharacter }/${ maxCharacter }
Submit
Cancel
${ selectedItem.replyTextCharacter }/${ selectedItem.replyMaxCharacter }
Submit
Cancel
Confirm
Are you sure to Delete?
Yes
No