Your browser does not fully support modern features. Please upgrade for a smoother experience.
Submitted Successfully!
 +1 credit
Thank you for your contribution! You can also upload a video entry or images related to this topic.
For video creation, please contact our Academic Video Service.
| Version | Summary | Created by | Modification | Content Size | Created at | Operation |
|---|---|---|---|---|---|---|
| 1 | Mohammed Abdul Rahman | -- | 1851 | 2022-04-01 02:08:53 | | | |
| 2 | Conner Chen | -46 word(s) | 1805 | 2022-04-01 02:41:14 | | |
Video Upload Options
We provide professional Academic Video Service to translate complex research into visually appealing presentations. Would you like to try it?
Cite
If you have any further questions, please contact Encyclopedia Editorial Office.
Abdul Rahman, M.; , .; Zayed, T.; Bagchi, A. The Evaluation Role of the Ground-Penetrating Radar. Encyclopedia. Available online: https://encyclopedia.pub/entry/21254 (accessed on 22 July 2026).
Abdul Rahman M, , Zayed T, Bagchi A. The Evaluation Role of the Ground-Penetrating Radar. Encyclopedia. Available at: https://encyclopedia.pub/entry/21254. Accessed July 22, 2026.
Abdul Rahman, Mohammed, , Tarek Zayed, Ashutosh Bagchi. "The Evaluation Role of the Ground-Penetrating Radar" Encyclopedia, https://encyclopedia.pub/entry/21254 (accessed July 22, 2026).
Abdul Rahman, M., , ., Zayed, T., & Bagchi, A. (2022, April 01). The Evaluation Role of the Ground-Penetrating Radar. In Encyclopedia. https://encyclopedia.pub/entry/21254
Abdul Rahman, Mohammed, et al. "The Evaluation Role of the Ground-Penetrating Radar." Encyclopedia. Web. 01 April, 2022.
Copy Citation
Ground-Penetrating Radar (GPR) is a popular non-destructive technique for evaluating RC bridge elements as it can identify major subsurface defects within a short span of time.
Ground-Penetrating Radar (GPR)
bridge inspection
1. Introduction
Reliable condition assessment of reinforced concrete elements of a bridge or any structure is crucial for its regular repair, rehabilitation, and overall sustainability. The oldest yet most widely popular approach for inspecting bridge elements involves an experienced analyst visually identifying and rating the surface defects based on their condition [1]. However, such a visual inspection method does not detect subsurface defects such as corrosion, voids, and delamination. Therefore, the use of non-destructive techniques (NDTs) is being increasingly adopted by transportation authorities for rigorous health evaluation of a bridge element. Although there are various NDTs such as impact echo, infrared thermography (IR), Ground-Penetrating Radar (GPR), Ultrasonic Surface Waves (USW) among others, GPR is the most recommended and highest-rated NDT among all as it can identify major subsurface defects (delamination, corrosion, vertical cracks, and concrete degradation) within a short span of time [2].
In essence, the GPR technique involves emitting electromagnetic radar signals through scanning a bridge element and analyzing the recorded signals [3]. The data interpretation of these recorded signals or GPR profiles is typically based on analyzing amplitude values at various medium interfaces such as asphalt–concrete or concrete–rebars to determine rebar corrosion, cover depth, and other factors. ASTM D6087 has a standardized procedure to evaluate asphalt-covered bridge decks based on such amplitude values [4].
2. Research Background
The first step in assessment using GPR involves scanning the structure such as a bridge element or a pavement with a mobile or manually driven antenna that emits electromagnetic (EM) waves. A manual-driven cart is preferred for a detailed survey while a mobile or airborne survey is opted for reconnaissance. Typically, the scanning is conducted either along the longitudinal section of the element or in a grid pattern with uniform traverse spacing to cover the whole element. The traverse spacing between each scan depends upon the aim of the investigation such as the level of details needed. For example, to map detailed features of a bridge deck, spacing of 1 to 2 feet is utilized while 3 to 6 feet is generally used for a reconnaissance or quality-assurance survey [5]. The antenna frequency for GPR scanning typically varies from 1 to 5 GHz and is decided based on the resolution needed for the survey and the penetration depth. Generally, a higher antenna frequency provides higher resolution power but lower penetration depth and vice versa [6]. Several other parameters for the GPR survey such as the number of samples per scan, transmit rate, number of scans per unit of distance, and dielectric constant are pre-set based on the investigation needed [5].
The EM signals emitted from the GPR frequency antenna are reflected at various material interfaces and are recorded by the GPR equipment. The output signal at a particular point, called the A-scan, is proportional to its amplitude. When these A-scans are stacked together along the length of the survey scan, it represents a greyscale image called a B-Scan [7]. Figure 1 shows a typical B-Scan of a concrete bridge deck with asphalt overlay with distinct reflections at various interfaces: air/asphalt, asphalt/concrete, and concrete–rebar. The reflections at the concrete–rebar interface form a characteristic hyperbolic shape and its peak represents the embedded rebar location in concrete.
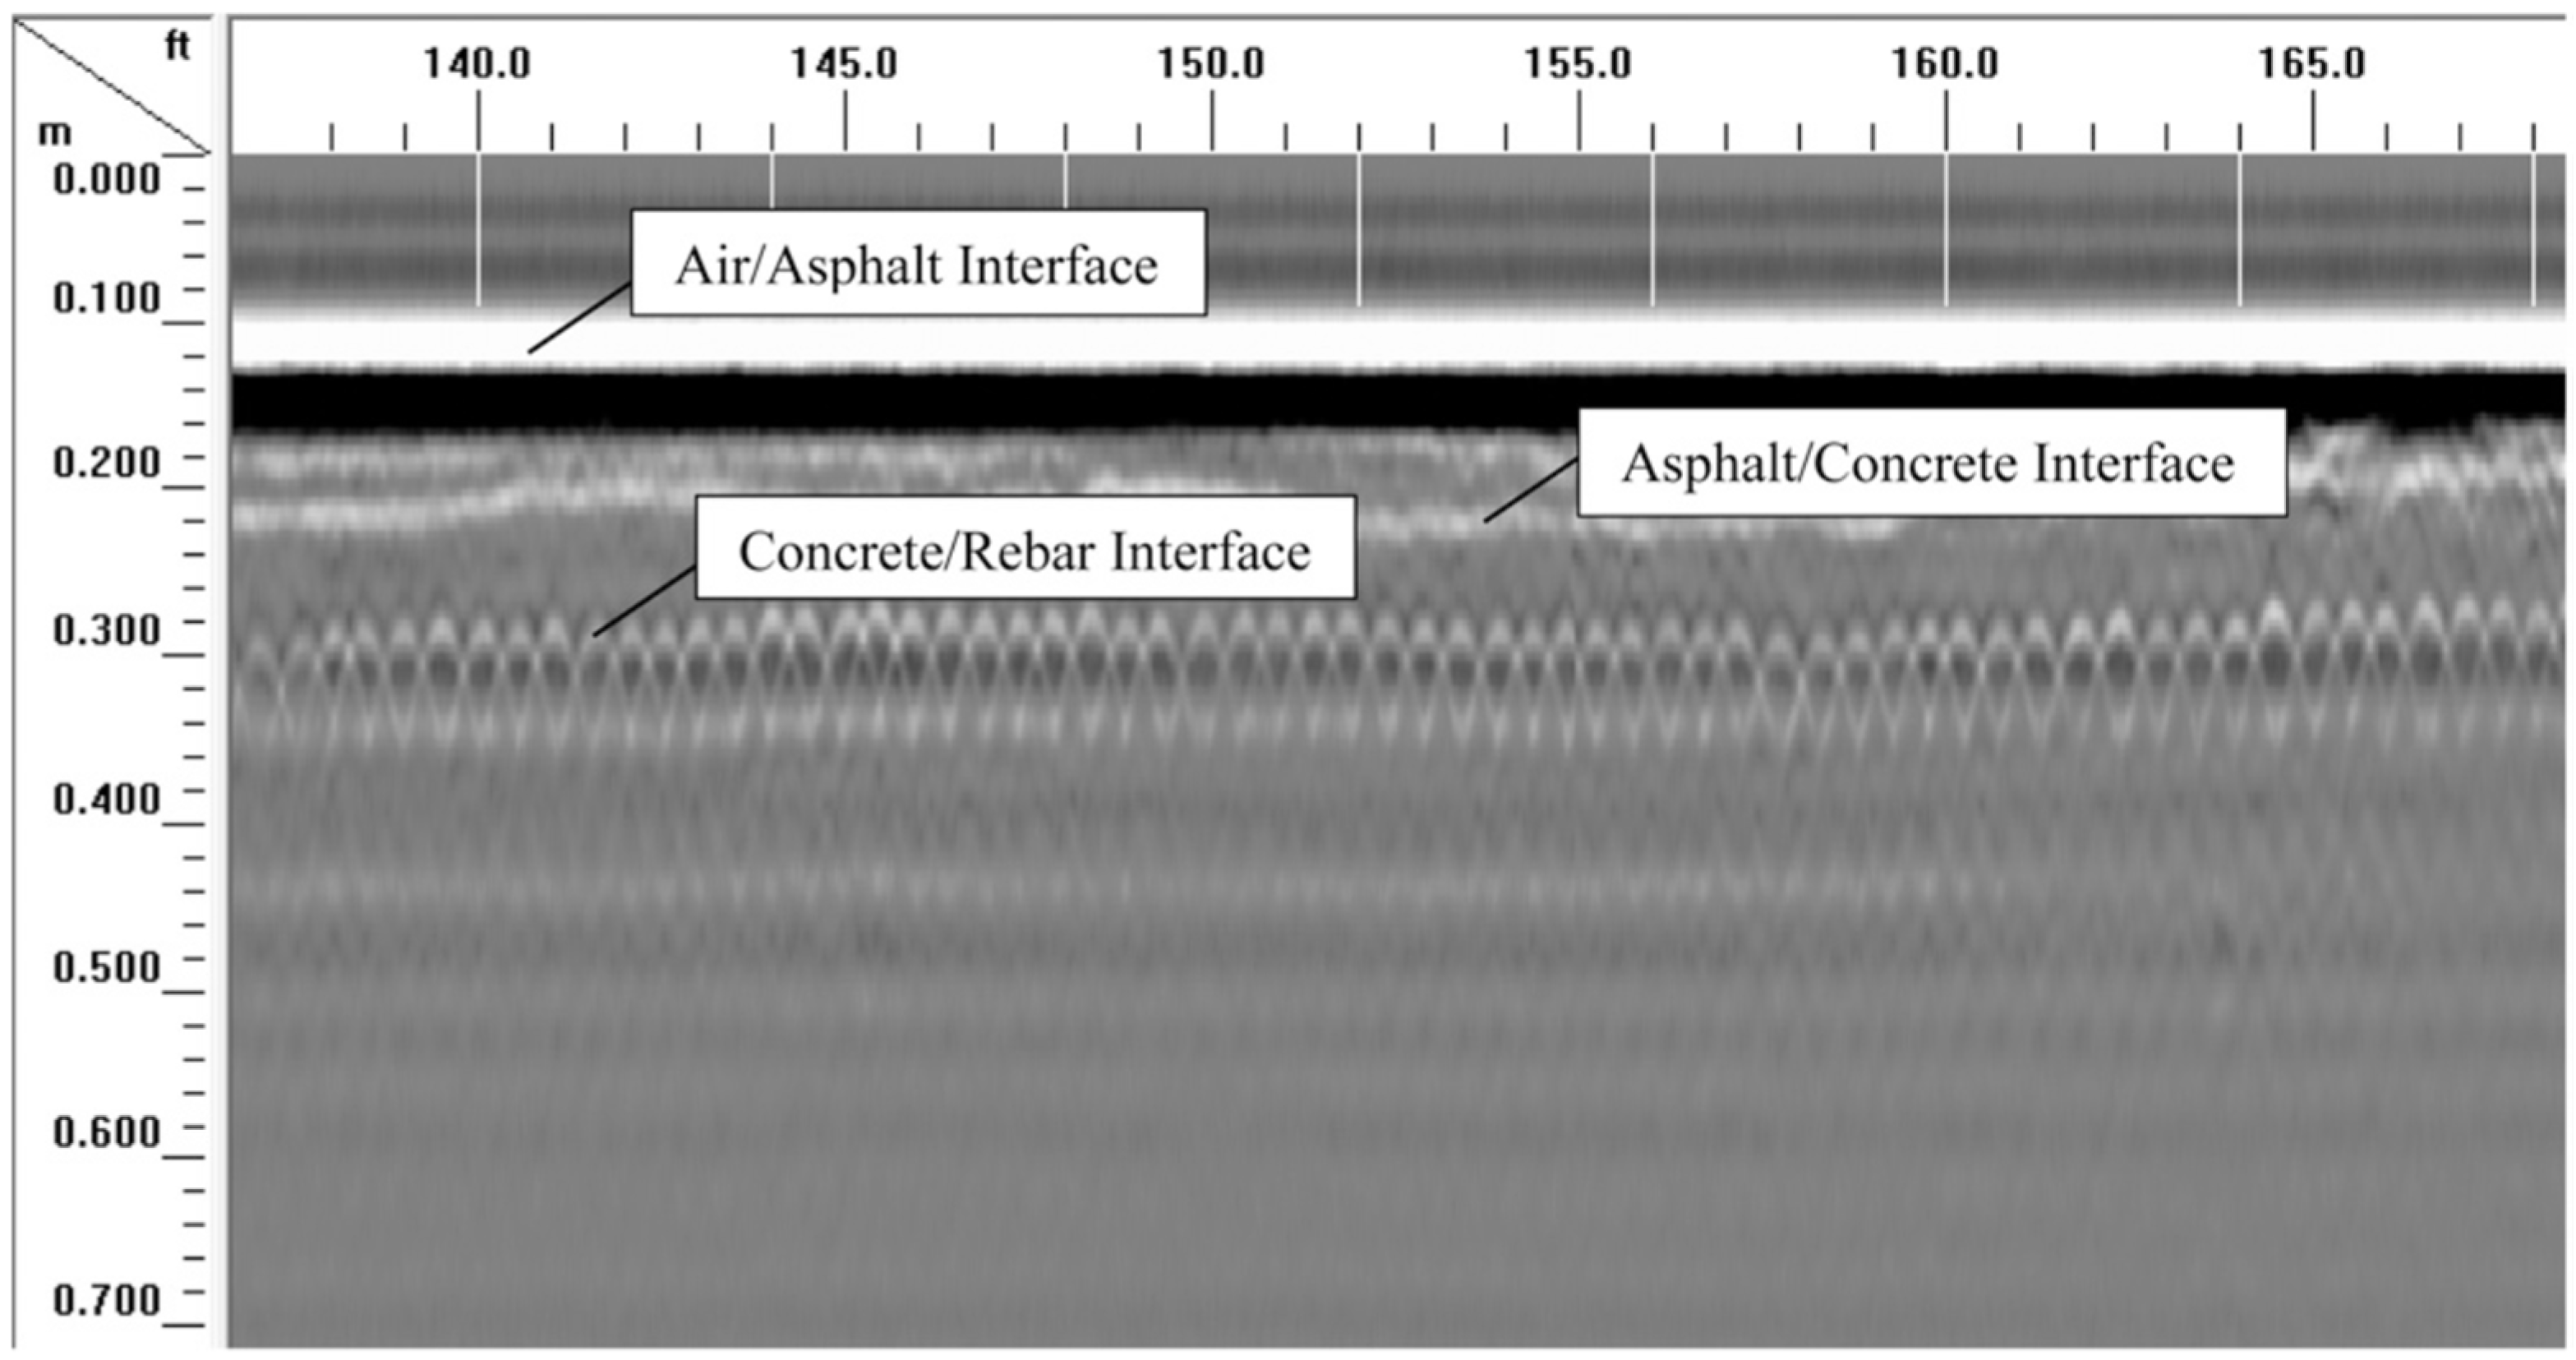
Figure 1. A GPR B-Scan of a bridge deck with asphalt overlay showing various interfaces and hyperbolic reflections from rebars.
3. GPR Data Analysis
Several methods have been proposed in the literature to interpret data obtained from GPR scans. The earliest approach identified irregular signatures in profiles as concrete deterioration typically present in a depressed shape [8]. Subsequently, individual waveforms at the concrete/asphalt level were analyzed in several bridge decks and a rating system was developed to classify the deck condition [9][10]. Numerous researchers analyzed attenuation signals based on amplitude values and compared their effectiveness in measuring concrete deterioration [11][12][13][14][15]. To improve results of amplitude-based analysis, the following advances were proposed: (a) analyzed signal depth–amplitude effects [16], (b) measured change in amplitude values over time [7], and (c) correlated original waveforms with semi-simulated waveforms at deterioration state [17]. An experimental study was conducted to assess the reliability of GPR in detecting delamination [18]. Some recent methods for complete data assessment can be summarized as follows: (a) analyzed amplitude values with synthetic aperture focusing technique (SAFT) and 3D interpolation [19], (b) compared A-scans at different locations [20], (c) utilized step-frequency GPR antenna arrays [21], (d) applied frequency–wavenumber (F–K) migration and several other algorithms to detect major defects (delamination, air voids and moisture) [22], (e) statistically analyzed concrete relative permittivity over multiple years [23], (f) evaluated three parameters (direct-coupling, amplitude, wave velocity, and signal attenuation) at different depths [24], and (g) used dual-polarization antenna for scanning and developed SAFT-based algorithms for 3D imaging of concrete structures to detect objects, defects, steel bar debonding, and concrete delamination [25].
The commonly adopted approach by transportation authorities to analyze GPR data is based on ASTM D6087 [4]. After obtaining GPR profiles from scanning a bridge element required to be inspected, this method involves picking reflection amplitude values in regular intervals across B-scans at either of the two locations: (a) concrete–rebar interface, i.e., the peak of hyperbolas or (b) relative amplitudes from the bridge deck bottom relative to the bridge deck surface. Subsequently, a condition map is generated for the complete bridge element by mapping these amplitude values. Higher values of amplitudes in this map indicate locations of good conditions of concrete while lower values indicate locations of moderate-to-bad conditions of the concrete. Bridge inspectors can use such a map to identify deteriorated areas for further inspection and repairs.
4. Visual Image-Based Analysis
The methods based on numerical amplitude values have many limitations. Firstly, by considering only amplitude values in a B-scan, they ignore the majority of the information contained in a radar profile. Secondly, they can yield erroneous results due to factors affecting amplitudes such as depth, surface anomalies, reinforcing bar spacing/configuration, and others. Thirdly, the condition map generated is noisy and not completely reliable when compared with the actual condition of concrete with destructive measures such as core sampling [26]. To overcome these shortcomings, an alternative approach proposed by Tarussov et al., 2013 [26] considers GPR B-scans as an imaging tool rather than a numeral measuring tool. In this visual-IBA, an experienced analyst marks attenuated areas in a B-scan manually while considering several factors such as reflection amplitudes at the concrete/rebar and bottom of slab levels, surface and structural anomalies, variations in slab thickness, reinforcement bar spacing, etc. For example, Figure 2 shows a typical GPR profile wherein moderate zones of deterioration are marked in yellow color by the analyst on top of the profile while severe zones are marked in red. The deterioration maps generated based on this approach have the following benefits: (a) it maps exact limits for zones of corrosion; (b) it reduces noise in results through visual filtering; (c) it accounts for depth-correction; (d) it considers various surface and structural anomalies as stated before; and (e) it shows good correspondence when compared with ground-truth results.
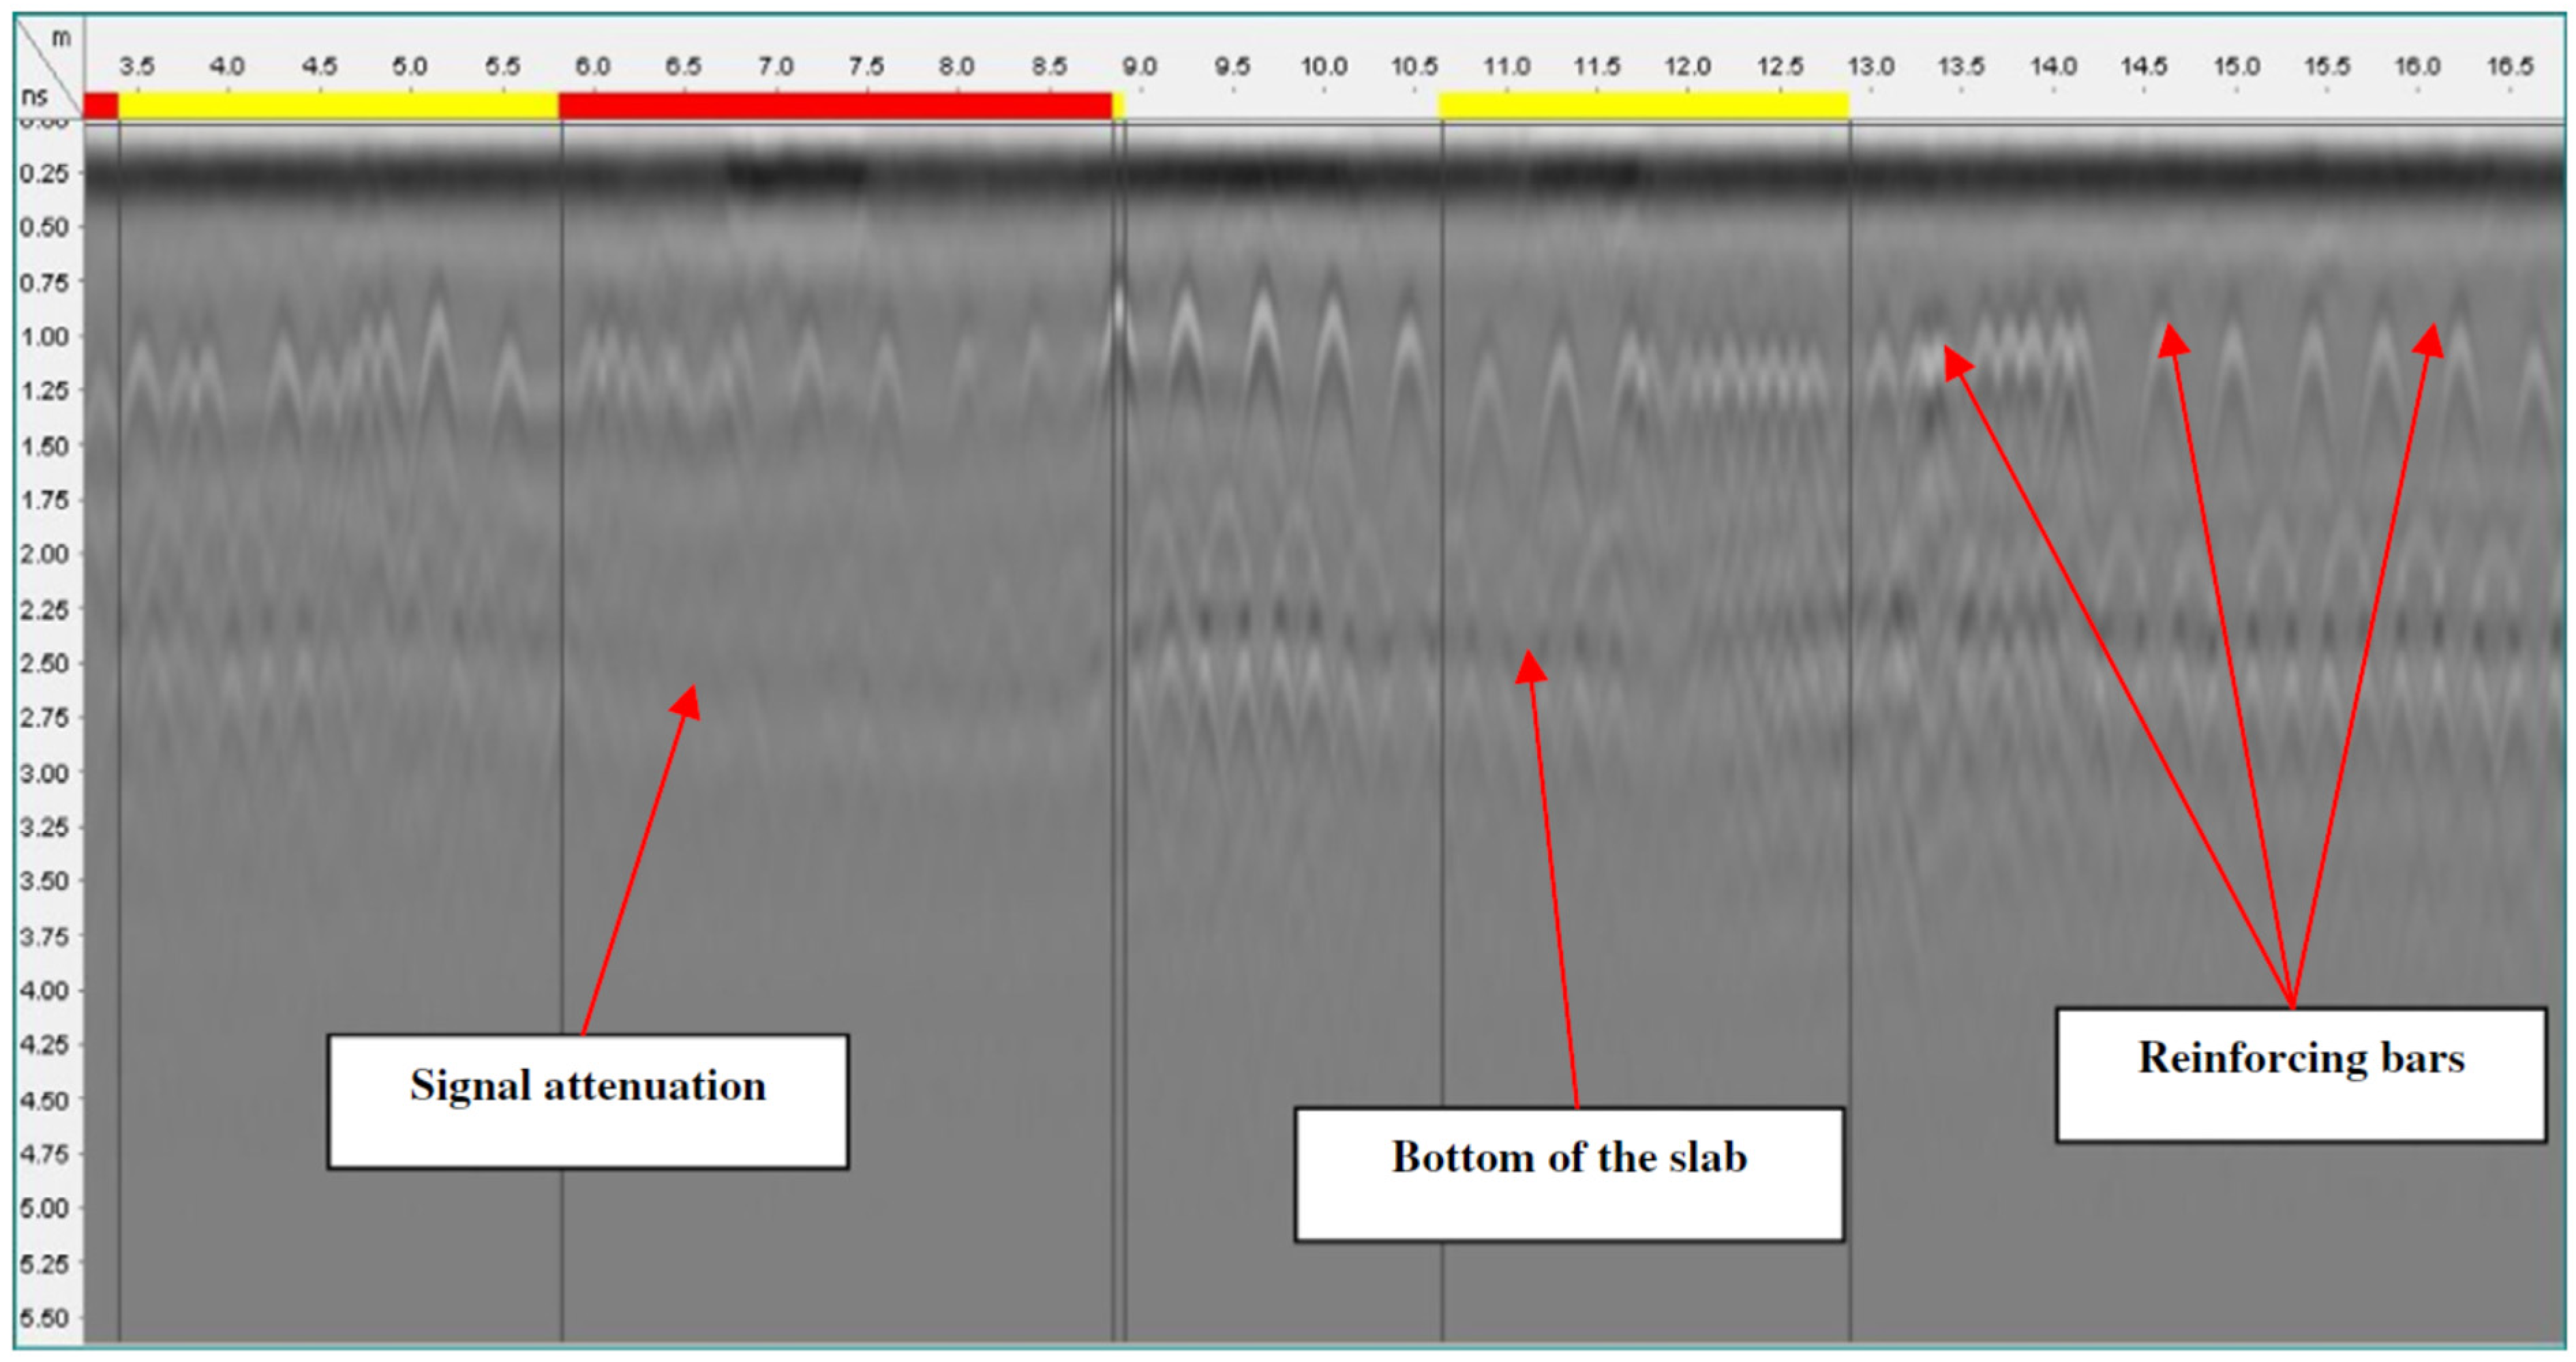
Figure 2. Attenuated areas marked in a GPR profile based on Image-Based Analysis [26].
The IBA method was correlated with extracted cores (destructive technique), chain-drag and chloride profiles on sets of concrete bridge decks scanned using GPR along a section of the I-290 and I-294 Tollways in Chicago, IL, USA. The corrosion maps generated during this investigation showed better correspondence with the actual concrete condition [26]. Abouhamad et al., 2017 [27] proposed a systematic framework to develop corrosion maps based on visual-IBA method by Tarussov et al., 2013 [26]. The developed IBA framework was validated by scanning two bridge decks in Quebec and comparing the resultant maps with amplitude-based maps, visual inspection, ground-truth cores and Half-Cell Potential (HCP). Dawood et al., 2020 [28] proposed an integrated approach to develop deterioration maps which delineates air/water voids in subway tunnels based on the GPR-IBA framework [27]. A part of Montreal, Quebec subway tunnel was inspected, and the map generated by the developed model [28] showed high correlation when compared with laser-based thermal map, visual inspection (camera images), and extracted cores. Therefore, the visual-IBA method philosophy was adopted in the proposed model instead of amplitude-based approaches due to better correspondence with the ground truth condition. However, this method has a few limitations of its own [29]. Primarily, since an analyst marks the attenuated areas manually, it is prone to human errors. For example, an analyst could mark a particular area in a B-scan differently each time as moderate or severe based on his/her optic judgment. Secondly, different analysts could have varied visual perspectives of what constitute areas in GPR profiles as good, moderate, or bad; and therefore, it is subjective. Lastly, the method could be time-consuming and tiresome especially in cases of bridge decks with large spans.
The premier step, detection of hyperbolas in GPR profiles, has been the focus of various researchers in analyzing GPR data. These methods utilize a variety and combination of image processing techniques such as edge detection, thresholding, and template matching. There are several limitations in employing such techniques; for example, edge detection or thresholding involves a pre-defined automatic or manual “threshold” which could lead to noise and non-uniform results across a variety of GPR profiles. Template matching causes missing or false detections of hyperbolas and requires a large database to incorporate the diversity of the shape of hyperbolas. Initial techniques of detecting hyperbola involved direct curve fitting such as Hough transform [30][31], wavelets [32][33], radon transforms [34], and hyperbolic echo characteristics [35]. A smart algorithm identified ill-shaped hyperbolas as it accounted for misshapenness by considering a buffer zone [36]. Some methods have used neural networks [37][38][39][40], while a few have adopted pattern-recognition algorithms [41][42][43]. Peak detection was also achieved by fuzzy clustering [44] and a multi-objective genetic algorithm [45]. Two holistic methods generated deterioration maps through automated rebar picking of amplitude values [46][47]. Some of the latest approaches to distinguishing hyperbolic regions from the background have been developed based on following algorithms: (a) a novel column-connection clustering (C3) algorithm [48], (b) a new drop-flow algorithm which mimics movement of a raindrop [49], (c) a trained convolutional neural network (CNN) [50], (d) a novel Open-Scan Clustering Algorithm (OSCA) which identifies downward-opening signatures [51], and (e) a double cluster-seeking estimate (DCSE) algorithm which improved the OSCA along with faster R-CNN [52]. The majority of the recent methods utilize machine learning (ML) and deep-learning algorithms such as Convolutional Support Vector Machine (CSVM) [53], Multi-Layer Perceptron [54], and enhanced mask R-CNN [55]. However, these approaches have their own limitations especially related to precision and large data set reliance, as discussed earlier. For efficient detections, the proposed model adopted a two-step approach in detecting hyperbolic regions for speed and accuracy. Firstly, a popular ML algorithm called Viola–Jones speedily detected all possible hyperbolic regions in GPR profiles. Secondly, the top layer was identified based on regional comparison, and subsequently eliminated false detections and filled missing gaps based on statistical analysis for automated accurate detections [56].
References
- Heymsfield, E.; Kuss, M.L. Supplementing Current Visual Highway Bridge Inspections with Gigapixel Technology. J. Perform. Constr. Facil. 2016, 30, 04015015.
- Gucunski, N. ; National Research Council. Nondestructive Testing to Identify Concrete Bridge Deck Deterioration; Transportation Research Board: Washington, DC, USA, 2013.
- Yehia, S.; Abudayyeh, O.; Nabulsi, S.; Abdelqader, I. Detection of Common Defects in Concrete Bridge Decks Using Nondestructive Evaluation Techniques. J. Bridg. Eng. 2007, 12, 215–225.
- ASTM D6087; Standard Test Method for Evaluating Asphalt-Covered Concrete Bridge Decks Using Ground Penetrating Radar. American Society for Testing and Materials: West Conshohocken, PA, USA, 2015; D6087-08.
- Varnavina, A.V.; Khamzin, A.K.; Torgashov, E.V.; Sneed, L.H.; Goodwin, B.T.; Anderson, N.L. Data acquisition and processing parameters for concrete bridge deck condition assessment using ground-coupled ground penetrating radar: Some considerations. J. Appl. Geophys. 2015, 114, 123–133.
- Gehrig, M.D.; Morris, D.V.; Bryant, J.T. Ground penetrating radar for concrete evaluation studies. Tech. Present. Pap. Perform. Found. Assoc. 2004, 197–200.
- Dinh, K.; Zayed, T.; Romero, F.; Tarussov, A. Method for Analyzing Time-Series GPR Data of Concrete Bridge Decks. J. Bridg. Eng. 2015, 20, 04014086.
- Clemena, G.G. Nondestructive Inspection of Overlaid Bridge Decks with Ground-Penetrating Radar; Transportation Research Board: Washington, DC, USA, 1983; pp. 21–32, No. 899.
- Carter, C.R.; Chung, T.; Holt, F.B.; Manning, D.G. An automated signal processing system for the signature analysis of radar waveforms from bridge decks. Can. Electr. Eng. J. 1986, 11, 128–137.
- Chung, T.; Carter, C.R.; Reel, R.; Tharmabala, T.; Wood, D. Impulse radar signatures of selected bridge deck structures. In Proceedings of the Canadian Conference on Electrical and Computer Engineering, Vancouver, BC, Canada, 14–17 September 1993; pp. 59–62.
- Maser, K.R. New Technology for Bridge Deck Assessment, Phase II Report; Report No FHWA-NETC-90-01; Centre for Transportation Studies, Massachusetts Institute of Technology: Cambridge, MA USA, 1990.
- Maser, K.; Bernhardt, M. Statewide Bridge Deck Survey using Ground Penetrating Radar. In Proceedings of the Structural Materials Technology IV—An NDT Conference, Atlantic City, NJ, USA, 28 February–3 March 2000.
- Romero, F.A.; Roberts, G.E.; Roberts, R.L. Evaluation of GPR Bridge Deck Survey Results used for Delineation of Removal/Maintenance Quantity Boundaries on Asphalt-Overlaid, Reinforced Concrete Deck. In Proceedings of the Structural Materials Technology IV—An NDT Conference, Atlantic City, NJ, USA, 28 February–3 March 2000.
- Barnes, C.L.; Trottier, J.-F. Effectiveness of Ground Penetrating Radar in Predicting Deck Repair Quantities. J. Infrastruct. Syst. 2004, 10, 69–76.
- Parrillo, R.; Roberts, R.; Haggan, A. Bridge deck condition assessment using ground penetrating radar. Proc. ECNDT Berlin 2006, 2526, 112.
- Barnes, C.L.; Trottier, J.-F.; Forgeron, D. Improved concrete bridge deck evaluation using GPR by accounting for signal depth–amplitude effects. NDT E Int. 2008, 41, 427–433.
- Dinh, K.; Gucunski, N.; Kim, J.; Duong, T. Method for attenuation assessment of GPR data from concrete bridge decks. NDT E Int. 2017, 92, 50–58.
- Sultan, A.A.; Washer, G.A. Reliability Analysis of Ground-Penetrating Radar for the Detection of Subsurface Delamination. J. Bridg. Eng. 2018, 23, 04017131.
- Dinh, K.; Gucunski, N.; Zayed, T. Automated visualization of concrete bridge deck condition from GPR data. NDT E Int. 2019, 102, 120–128.
- Goulias, D.G.; Cafiso, S.; Di Graziano, A.; Saremi, S.G.; Currao, V. Condition Assessment of Bridge Decks through Ground-Penetrating Radar in Bridge Management Systems. J. Perform. Constr. Facil. 2020, 34, 04020100.
- Gagarin, N.; Goulias, D.; Mekemson, J.; Cutts, R.; Andrews, J. Development of Novel Methodology for Assessing Bridge Deck Conditions Using Step Frequency Antenna Array Ground Penetrating Radar. J. Perform. Constr. Facil. 2020, 34, 04019113.
- Jiao, L.; Ye, Q.; Cao, X.; Huston, D.; Xia, T. Identifying concrete structure defects in GPR image. Measurement 2020, 160, 107839.
- Rhee, J.-Y.; Park, K.-E.; Lee, K.-H.; Kee, S.-H. A Practical Approach to Condition Assessment of Asphalt-Covered Concrete Bridge Decks on Korean Expressways by Dielectric Constant Measurements Using Air-Coupled GPR. Sensors 2020, 20, 2497.
- Pashoutani, S.; Zhu, J. Ground Penetrating Radar Data Processing for Concrete Bridge Deck Evaluation. J. Bridg. Eng. 2020, 25, 04020030.
- Dinh, K.; Gucunski, N.; Tran, K.; Novo, A.; Nguyen, T. Full-resolution 3D imaging for concrete structures with dual-polarization GPR. Autom. Constr. 2021, 125, 103652.
- Tarussov, A.; Vandry, M.; De La Haza, A. Condition assessment of concrete structures using a new analysis method: Ground-penetrating radar computer-assisted visual interpretation. Constr. Build. Mater. 2013, 38, 1246–1254.
- Abouhamad, M.; Dawood, T.; Jabri, A.; Alsharqawi, M.; Zayed, T. Corrosiveness mapping of bridge decks using image-based analysis of GPR data. Autom. Constr. 2017, 80, 104–117.
- Dawood, T.; Zhu, Z.; Zayed, T. Deterioration mapping in subway infrastructure using sensory data of GPR. Tunn. Undergr. Space Technol. 2020, 103, 103487.
- Rahman, M.A.; Zayed, T. Developing Corrosion Maps of RC bridge elements based on automated visual image analysis. In Proceedings of the Session of the 2016 Conference of the Transportation Association of Canada, Toronto, ON, Canada, 22–28 September 2016.
- Illingworth, J.; Kittler, J. A survey of the hough transform. Comput. Vision, Graph. Image Process. 1988, 44, 87–116.
- Falorni, P.; Capineri, L.; Masotti, L. 3-D radar imaging of buried utilities by features estimation of hyperbolic diffraction patterns in radar scans. Penetrating Radar 2004, 1, 403–406.
- Windsor, C.; Capineri, L.; Falorni, P.; Matucci, S.; Borgioli, G. The estimation of buried pipe diameters using ground penetrating radar. Insight-Non-Destructive Test. Cond. Monit. 2005, 47, 394–399.
- Hui-Lin, Z.; Mao, T.; Xiao-Li, C. Feature extraction and classification of echo signal of ground penetrating radar. Wuhan Univ. J. Nat. Sci. 2005, 10, 1009–1012.
- Dell’Acqua, A.; Sarti, A.; Tubaro, S.; Zanzi, L. Detection of linear objects in GPR data. Signal Process. 2004, 84, 785–799.
- Liu, Y.; Wang, M.; Cai, Q. The target detection for GPR images based on curve fitting. In Proceedings of the 2010 3rd International Congress on Image and Signal Processing, Yantai, China, 16–18 October 2010; Volume 6, pp. 2876–2879.
- Mertens, L.; Persico, R.; Matera, L.; Lambot, S. Automated Detection of Reflection Hyperbolas in Complex GPR Images with No A Priori Knowledge on the Medium. IEEE Trans. Geosci. Remote Sens. 2016, 54, 580–596.
- Al-Nuaimy, W.; Huang, Y.; Nakhkash, M.; Fang, M.; Nguyen, V.; Eriksen, A. Automatic detection of buried utilities and solid objects with GPR using neural networks and pattern recognition. J. Appl. Geophys. 2000, 43, 157–165.
- Gamba, P.; Lossani, S. Neural detection of pipe signatures in ground penetrating radar images. IEEE Trans. Geosci. Remote Sens. 2000, 38, 790–797.
- Singh, N.P.; Nene, M.J. Buried object detection and analysis of GPR images: Using neural network and curve fitting. In Proceedings of the 2013 Annual International Conference on Emerging Research Areas and 2013 International Conference on Microelectronics, Communications and Renewable Energy, Kanjirapally, India, 4–6 June 2013; Institute of Electrical and Electronics Engineers (IEEE): New York, NY, USA, 2013; pp. 1–6.
- Pham, M.-T.; Lefèvre, S. Buried Object Detection from B-Scan Ground Penetrating Radar Data Using Faster-RCNN. In Proceedings of the IGARSS 2018—2018 IEEE International Geoscience and Remote Sensing Symposium, Valencia, Spain, 22–27 July 2018; pp. 6804–6807.
- Kaneko, T. Radar image processing for locating underground linear objects. IEICE Trans. Inf. Syst. 1991, 74, 3451–3458.
- Shihab, S.; Al-Nuaimy, W. Radius Estimation for Cylindrical Objects Detected by Ground Penetrating Radar. Subsurf. Sens. Technol. Appl. 2005, 6, 151–166.
- Pasolli, E.; Melgani, F.; Donelli, M. Automatic Analysis of GPR Images: A Pattern-Recognition Approach. IEEE Trans. Geosci. Remote Sens. 2009, 47, 2206–2217.
- Delbo, S.; Gamba, P.; Roccato, D. A fuzzy shell clustering approach to recognize hyperbolic signatures in subsurface radar images. IEEE Trans. Geosci. Remote Sens. 2000, 38, 1447–1451.
- Harkat, H.; Ruano, A.; Ruano, M.; Bennani, S. Classifier Design by a Multi-Objective Genetic Algorithm Approach for GPR Automatic Target Detection. IFAC-PapersOnLine 2018, 51, 187–192.
- Wang, Z.W.; Zhou, M.; Slabaugh, G.; Zhai, J.; Fang, T. Automatic Detection of Bridge Deck Condition From Ground Penetrating Radar Images. IEEE Trans. Autom. Sci. Eng. 2010, 8, 633–640.
- Kaur, P.; Dana, K.J.; Romero, F.A.; Gucunski, N. Automated GPR Rebar Analysis for Robotic Bridge Deck Evaluation. IEEE Trans. Cybern. 2016, 46, 2265–2276.
- Dou, Q.; Wei, L.; Magee, D.R.; Cohn, A.G. Real-Time Hyperbola Recognition and Fitting in GPR Data. IEEE Trans. Geosci. Remote Sens. 2017, 55, 51–62.
- Yuan, C.; Li, S.; Cai, H.; Kamat, V.R. GPR Signature Detection and Decomposition for Mapping Buried Utilities with Complex Spatial Configuration. J. Comput. Civ. Eng. 2018, 32, 04018026.
- Dinh, K.; Gucunski, N.; Duong, T.H. An algorithm for automatic localization and detection of rebars from GPR data of concrete bridge decks. Autom. Constr. 2018, 89, 292–298.
- Zhou, X.; Chen, H.; Li, J. An Automatic GPR B-Scan Image Interpreting Model. IEEE Trans. Geosci. Remote Sens. 2018, 56, 3398–3412.
- Lei, W.; Hou, F.; Xi, J.; Tan, Q.; Xu, M.; Jiang, X.; Liu, G.; Gu, Q. Automatic hyperbola detection and fitting in GPR B-scan image. Autom. Constr. 2019, 106, 102839.
- Ozkaya, U.; Melgani, F.; Bejiga, M.B.; Seyfi, L.; Donelli, M. GPR B scan image analysis with deep learning methods. Measurement 2020, 165, 107770.
- Asadi, P.; Gindy, M.; Alvarez, M.; Asadi, A. A computer vision based rebar detection chain for automatic processing of concrete bridge deck GPR data. Autom. Constr. 2020, 112, 103106.
- Hou, F.; Lei, W.; Li, S.; Xi, J.; Xu, M.; Luo, J. Improved Mask R-CNN with distance guided intersection over union for GPR signature detection and segmentation. Autom. Constr. 2021, 121, 103414.
- Rahman, M.A.; Zayed, T. Viola-Jones Algorithm for Automatic Detection of Hyperbolic Regions in GPR Profiles of Bridge Decks. In Proceedings of the 2018 IEEE Southwest Symposium on Image Analysis and Interpretation (SSIAI), Las Vegas, NV, USA, 8–10 April 2018; pp. 1–4.
More
Information
Subjects:
Engineering, Civil
Contributors
MDPI registered users' name will be linked to their SciProfiles pages. To register with us, please refer to https://encyclopedia.pub/register
:
View Times:
2.0K
Entry Collection:
Remote Sensing Data Fusion
Revisions:
2 times
(View History)
Update Date:
01 Apr 2022
Table of Contents


Notice
You are not a member of the advisory board for this topic. If you want to update advisory board member profile, please contact office@encyclopedia.pub.
OK
Confirm
Only members of the Encyclopedia advisory board for this topic are allowed to note entries. Would you like to become an advisory board member of the Encyclopedia?
Yes
No
${ textCharacter }/${ maxCharacter }
Submit
Cancel
Back
Comments
${ item }
|
${ item.createdUser.fullName }
${ item.createdAt }
${ item.vote }
${ item.reply }
Delete
${ reply.createdUser.fullName }
${ reply.createdAt }
${ reply.vote }
Delete
There is no reply to this comment~
${ item.replyTextCharacter }/${ item.replyMaxCharacter }
Submit
Cancel
More
No more~
There is no comment~
${ textCharacter }/${ maxCharacter }
Submit
Cancel
${ selectedItem.replyTextCharacter }/${ selectedItem.replyMaxCharacter }
Submit
Cancel
Confirm
Are you sure to Delete?
Yes
No