Your browser does not fully support modern features. Please upgrade for a smoother experience.
Please note this is an old version of this entry, which may differ significantly from the current revision.
Subjects:
Engineering, Civil
Ground-Penetrating Radar (GPR) is a popular non-destructive technique for evaluating RC bridge elements as it can identify major subsurface defects within a short span of time.
- Ground-Penetrating Radar (GPR)
- bridge inspection
1. Introduction
Reliable condition assessment of reinforced concrete elements of a bridge or any structure is crucial for its regular repair, rehabilitation, and overall sustainability. The oldest yet most widely popular approach for inspecting bridge elements involves an experienced analyst visually identifying and rating the surface defects based on their condition [1]. However, such a visual inspection method does not detect subsurface defects such as corrosion, voids, and delamination. Therefore, the use of non-destructive techniques (NDTs) is being increasingly adopted by transportation authorities for rigorous health evaluation of a bridge element. Although there are various NDTs such as impact echo, infrared thermography (IR), Ground-Penetrating Radar (GPR), Ultrasonic Surface Waves (USW) among others, GPR is the most recommended and highest-rated NDT among all as it can identify major subsurface defects (delamination, corrosion, vertical cracks, and concrete degradation) within a short span of time [2].
In essence, the GPR technique involves emitting electromagnetic radar signals through scanning a bridge element and analyzing the recorded signals [3]. The data interpretation of these recorded signals or GPR profiles is typically based on analyzing amplitude values at various medium interfaces such as asphalt–concrete or concrete–rebars to determine rebar corrosion, cover depth, and other factors. ASTM D6087 has a standardized procedure to evaluate asphalt-covered bridge decks based on such amplitude values [4].
2. Research Background
The first step in assessment using GPR involves scanning the structure such as a bridge element or a pavement with a mobile or manually driven antenna that emits electromagnetic (EM) waves. A manual-driven cart is preferred for a detailed survey while a mobile or airborne survey is opted for reconnaissance. Typically, the scanning is conducted either along the longitudinal section of the element or in a grid pattern with uniform traverse spacing to cover the whole element. The traverse spacing between each scan depends upon the aim of the investigation such as the level of details needed. For example, to map detailed features of a bridge deck, spacing of 1 to 2 feet is utilized while 3 to 6 feet is generally used for a reconnaissance or quality-assurance survey [8]. The antenna frequency for GPR scanning typically varies from 1 to 5 GHz and is decided based on the resolution needed for the survey and the penetration depth. Generally, a higher antenna frequency provides higher resolution power but lower penetration depth and vice versa [9]. Several other parameters for the GPR survey such as the number of samples per scan, transmit rate, number of scans per unit of distance, and dielectric constant are pre-set based on the investigation needed [8].
The EM signals emitted from the GPR frequency antenna are reflected at various material interfaces and are recorded by the GPR equipment. The output signal at a particular point, called the A-scan, is proportional to its amplitude. When these A-scans are stacked together along the length of the survey scan, it represents a greyscale image called a B-Scan [10]. Figure 1 shows a typical B-Scan of a concrete bridge deck with asphalt overlay with distinct reflections at various interfaces: air/asphalt, asphalt/concrete, and concrete–rebar. The reflections at the concrete–rebar interface form a characteristic hyperbolic shape and its peak represents the embedded rebar location in concrete.
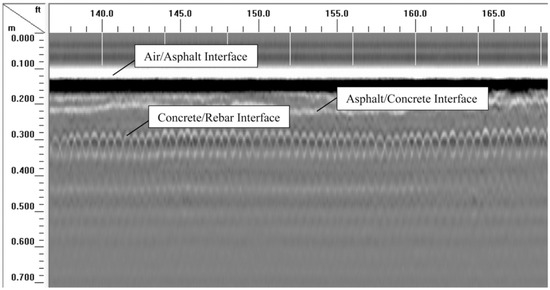
Figure 1. A GPR B-Scan of a bridge deck with asphalt overlay showing various interfaces and hyperbolic reflections from rebars [10].
3. GPR Data Analysis
Several methods have been proposed in the literature to interpret data obtained from GPR scans. The earliest approach identified irregular signatures in profiles as concrete deterioration typically present in a depressed shape [11]. Subsequently, individual waveforms at the concrete/asphalt level were analyzed in several bridge decks and a rating system was developed to classify the deck condition [12,13]. Numerous researchers analyzed attenuation signals based on amplitude values and compared their effectiveness in measuring concrete deterioration [14,15,16,17,18]. To improve results of amplitude-based analysis, the following advances were proposed: (a) analyzed signal depth–amplitude effects [19], (b) measured change in amplitude values over time [10], and (c) correlated original waveforms with semi-simulated waveforms at deterioration state [20]. An experimental study was conducted to assess the reliability of GPR in detecting delamination [21]. Some recent methods for complete data assessment can be summarized as follows: (a) analyzed amplitude values with synthetic aperture focusing technique (SAFT) and 3D interpolation [22], (b) compared A-scans at different locations [23], (c) utilized step-frequency GPR antenna arrays [24], (d) applied frequency–wavenumber (F–K) migration and several other algorithms to detect major defects (delamination, air voids and moisture) [25], (e) statistically analyzed concrete relative permittivity over multiple years [26], (f) evaluated three parameters (direct-coupling, amplitude, wave velocity, and signal attenuation) at different depths [27], and (g) used dual-polarization antenna for scanning and developed SAFT-based algorithms for 3D imaging of concrete structures to detect objects, defects, steel bar debonding, and concrete delamination [28].
The commonly adopted approach by transportation authorities to analyze GPR data is based on ASTM D6087 [4]. After obtaining GPR profiles from scanning a bridge element required to be inspected, this method involves picking reflection amplitude values in regular intervals across B-scans at either of the two locations: (a) concrete–rebar interface, i.e., the peak of hyperbolas or (b) relative amplitudes from the bridge deck bottom relative to the bridge deck surface. Subsequently, a condition map is generated for the complete bridge element by mapping these amplitude values. Higher values of amplitudes in this map indicate locations of good conditions of concrete while lower values indicate locations of moderate-to-bad conditions of the concrete. Bridge inspectors can use such a map to identify deteriorated areas for further inspection and repairs.
4. Visual Image-Based Analysis
The methods based on numerical amplitude values have many limitations. Firstly, by considering only amplitude values in a B-scan, they ignore the majority of the information contained in a radar profile. Secondly, they can yield erroneous results due to factors affecting amplitudes such as depth, surface anomalies, reinforcing bar spacing/configuration, and others. Thirdly, the condition map generated is noisy and not completely reliable when compared with the actual condition of concrete with destructive measures such as core sampling [5]. To overcome these shortcomings, an alternative approach proposed by Tarussov et al., 2013 [5] considers GPR B-scans as an imaging tool rather than a numeral measuring tool. In this visual-IBA, an experienced analyst marks attenuated areas in a B-scan manually while considering several factors such as reflection amplitudes at the concrete/rebar and bottom of slab levels, surface and structural anomalies, variations in slab thickness, reinforcement bar spacing, etc. For example, Figure 2 shows a typical GPR profile wherein moderate zones of deterioration are marked in yellow color by the analyst on top of the profile while severe zones are marked in red. The deterioration maps generated based on this approach have the following benefits: (a) it maps exact limits for zones of corrosion; (b) it reduces noise in results through visual filtering; (c) it accounts for depth-correction; (d) it considers various surface and structural anomalies as stated before; and (e) it shows good correspondence when compared with ground-truth results.
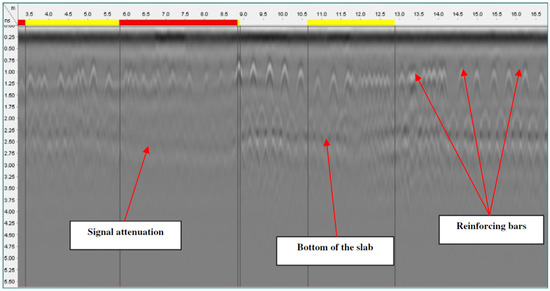
Figure 2. Attenuated areas marked in a GPR profile based on Image-Based Analysis [5].
The IBA method was correlated with extracted cores (destructive technique), chain-drag and chloride profiles on sets of concrete bridge decks scanned using GPR along a section of the I-290 and I-294 Tollways in Chicago, IL, USA. The corrosion maps generated during this investigation showed better correspondence with the actual concrete condition [5]. Abouhamad et al., 2017 [29] proposed a systematic framework to develop corrosion maps based on visual-IBA method by Tarussov et al., 2013 [5]. The developed IBA framework was validated by scanning two bridge decks in Quebec and comparing the resultant maps with amplitude-based maps, visual inspection, ground-truth cores and Half-Cell Potential (HCP). Dawood et al., 2020 [30] proposed an integrated approach to develop deterioration maps which delineates air/water voids in subway tunnels based on the GPR-IBA framework [29]. A part of Montreal, Quebec subway tunnel was inspected, and the map generated by the developed model [30] showed high correlation when compared with laser-based thermal map, visual inspection (camera images), and extracted cores. Therefore, the visual-IBA method philosophy was adopted in the proposed model instead of amplitude-based approaches due to better correspondence with the ground truth condition. However, this method has a few limitations of its own [6]. Primarily, since an analyst marks the attenuated areas manually, it is prone to human errors. For example, an analyst could mark a particular area in a B-scan differently each time as moderate or severe based on his/her optic judgment. Secondly, different analysts could have varied visual perspectives of what constitute areas in GPR profiles as good, moderate, or bad; and therefore, it is subjective. Lastly, the method could be time-consuming and tiresome especially in cases of bridge decks with large spans. This paper overcomes the limitations of the visual-IBA method through automated detections of hyperbolas and classification based on mathematical modeling. A condition map generated using the developed model would yield a consistent (same) result for a given set of GPR data devoid of any human errors.
The premier step, detection of hyperbolas in GPR profiles, has been the focus of various researchers in analyzing GPR data. These methods utilize a variety and combination of image processing techniques such as edge detection, thresholding, and template matching. There are several limitations in employing such techniques; for example, edge detection or thresholding involves a pre-defined automatic or manual “threshold” which could lead to noise and non-uniform results across a variety of GPR profiles. Template matching causes missing or false detections of hyperbolas and requires a large database to incorporate the diversity of the shape of hyperbolas. Initial techniques of detecting hyperbola involved direct curve fitting such as Hough transform [31,32], wavelets [33,34], radon transforms [35], and hyperbolic echo characteristics [36]. A smart algorithm identified ill-shaped hyperbolas as it accounted for misshapenness by considering a buffer zone [37]. Some methods have used neural networks [38,39,40,41], while a few have adopted pattern-recognition algorithms [42,43,44]. Peak detection was also achieved by fuzzy clustering [45] and a multi-objective genetic algorithm [46]. Two holistic methods generated deterioration maps through automated rebar picking of amplitude values [47,48]. Some of the latest approaches to distinguishing hyperbolic regions from the background have been developed based on following algorithms: (a) a novel column-connection clustering (C3) algorithm [49], (b) a new drop-flow algorithm which mimics movement of a raindrop [50], (c) a trained convolutional neural network (CNN) [51], (d) a novel Open-Scan Clustering Algorithm (OSCA) which identifies downward-opening signatures [52], and (e) a double cluster-seeking estimate (DCSE) algorithm which improved the OSCA along with faster R-CNN [53]. The majority of the recent methods utilize machine learning (ML) and deep-learning algorithms such as Convolutional Support Vector Machine (CSVM) [54], Multi-Layer Perceptron [55], and enhanced mask R-CNN [56]. However, these approaches have their own limitations especially related to precision and large data set reliance, as discussed earlier. For efficient detections, the proposed model adopted a two-step approach in detecting hyperbolic regions for speed and accuracy. Firstly, a popular ML algorithm called Viola–Jones speedily detected all possible hyperbolic regions in GPR profiles. Secondly, the top layer was identified based on regional comparison, and subsequently eliminated false detections and filled missing gaps based on statistical analysis for automated accurate detections [7].
This entry is adapted from the peer-reviewed paper 10.3390/rs14051131
This entry is offline, you can click here to edit this entry!