
| Version | Summary | Created by | Modification | Content Size | Created at | Operation |
|---|---|---|---|---|---|---|
| 1 | Ngo Le Huy Hien | + 2486 word(s) | 2486 | 2022-01-14 13:46:12 | | | |
| 2 | Ngo Le Huy Hien | + 2242 word(s) | 2242 | 2022-01-14 13:51:36 | | | | |
| 3 | Catherine Yang | -7 word(s) | 2235 | 2022-01-17 04:42:43 | | | | |
| 4 | Ngo Le Huy Hien | -2 word(s) | 2233 | 2022-01-20 01:17:37 | | | | |
| 5 | Ngo Le Huy Hien | -2 word(s) | 2233 | 2022-01-20 01:20:10 | | |
Video Upload Options
Due to the alarming rate of climate change, fuel consumption and emission estimates are critical in determining the effects of materials and stringent emission control strategies. In this research, an analytical and predictive study has been conducted using the Government of Canada dataset, containing 4973 light-duty vehicles observed from 2017 to 2021, delivering a comparative view of different brands and vehicle models by their fuel consumption and carbon dioxide emissions. Based on the findings of the statistical data analysis, this study makes evidence-based recommendations to both vehicle users and producers to reduce their environmental impacts. Additionally, Convolutional Neural Networks (CNN) and various regression models have been built to estimate fuel consumption and carbon dioxide emissions for future vehicle designs. This study reveals that the Univariate Polynomial Regression model is the best model for predictions from one vehicle feature input, with up to 98.6% accuracy. Multiple Linear Regression and Multivariate Polynomial Regression are good models for predictions from multiple vehicle feature inputs, with approximately 75% accuracy. Convolutional Neural Network is also a promising method for prediction because of its stable and high accuracy of around 70%. The results contribute to the quantifying process of energy cost and air pollution caused by transportation, followed by proposing relevant recommendations for both vehicle users and producers. Future research should aim towards developing higher performance models and larger datasets for building APIs and applications.
1. Introduction
-
RO1: To carry out a thorough systematic literature review of fuel consumption and carbon dioxide emissions for new light-duty vehicles for retail sale (use case: in Canada);
-
RO2: To identify suitable datasets for analysis and implement the data preparation process;
-
RO3: To utilize appropriate indicators to measure and analyze the sustainable impact of vehicles;
-
RO4: To implement the following data analytics methodologies on the final dataset by addressing corresponding research questions (RQ).
-
Level 1: Descriptive Statistical Analysis
-
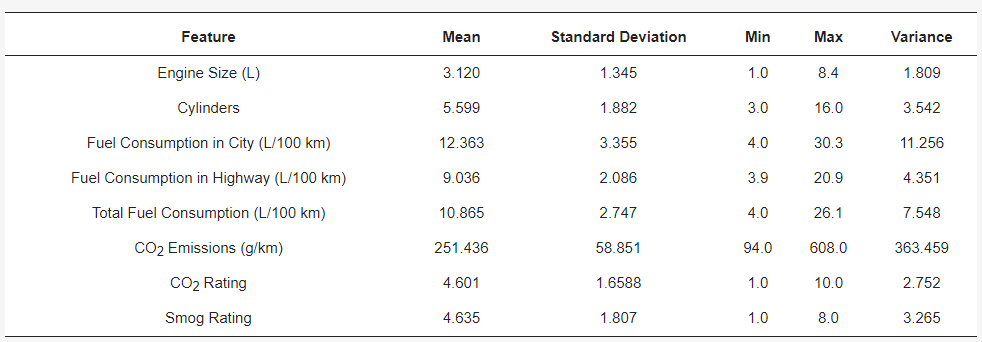
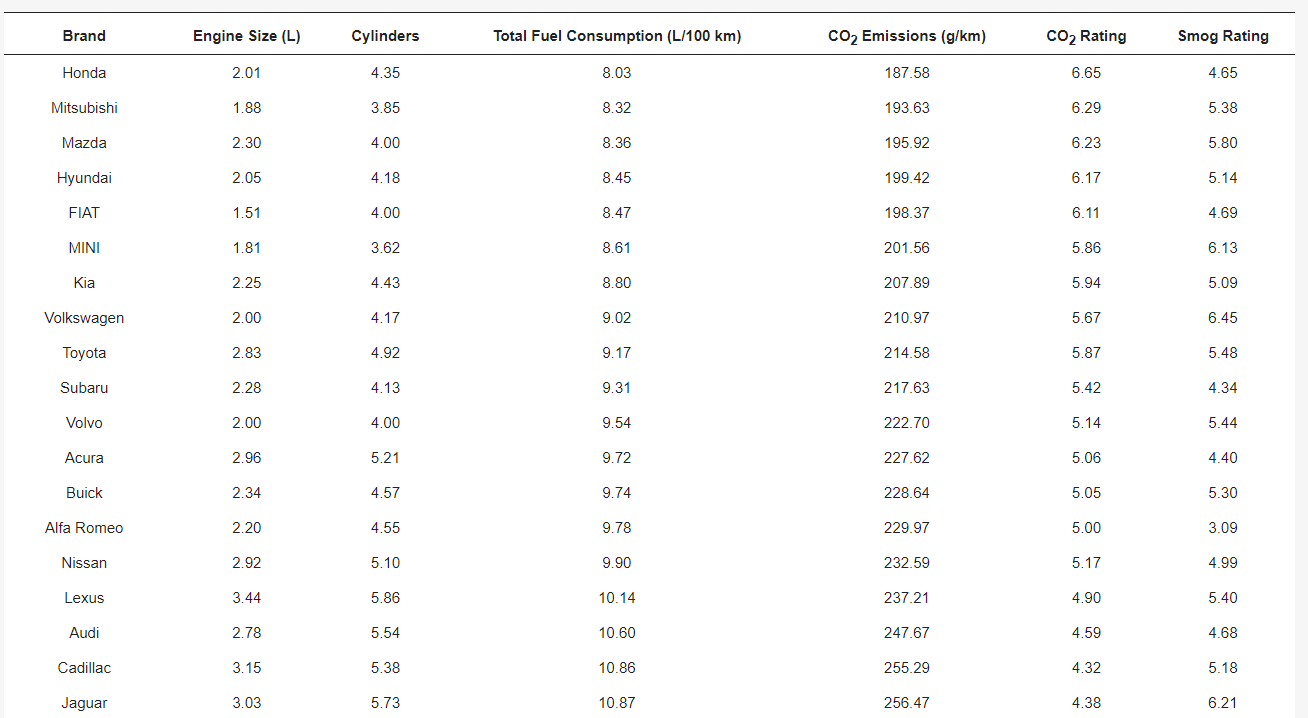
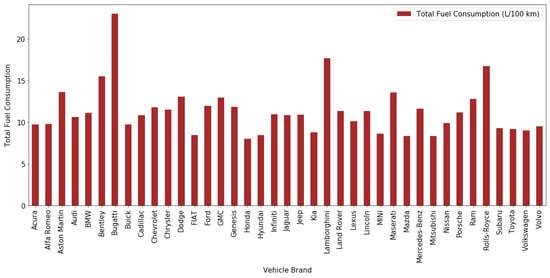
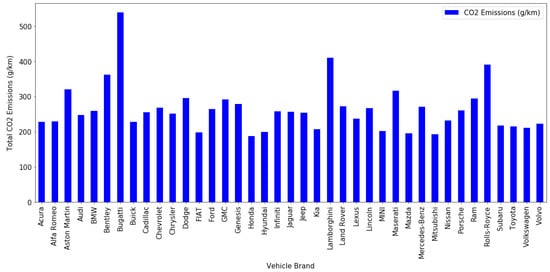
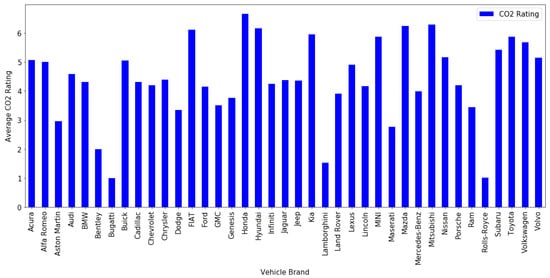
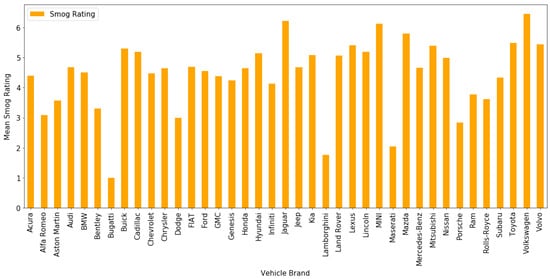
RQ1.1 How do light-duty vehicles compare in terms of fuel consumption and CO2 emission?
-
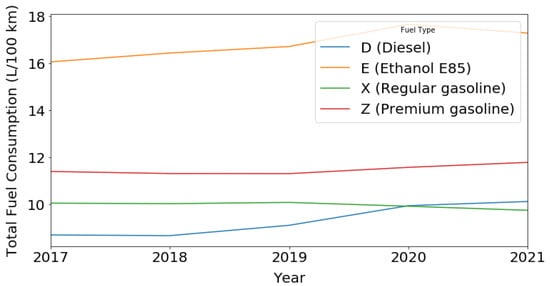
RQ1.2 How have patterns of fuel consumption and emission of each vehicle type changed throughout the selected period?
-
-
Level 2: Inferential Statistical Analysis
-
RQ2.1 Is there any particular distribution for fuel consumption in the city and the highway of vehicles in Canada?
-
RQ2.2 Is there a notable difference in the performance of one specific vehicle (or fuel) type in comparison to the rest of the vehicle types in Canada?
-
RQ2.3 How does the brand, model, vehicle class, engine size, cylinder, transmission type, and fuel type correlate with consumption and emissions of various vehicles?
-
RQ2.4 What are the relationships between all features to each other of the entire dataset?
-
-
Level 3: Machine Learning
-
RQ3.1 Can fuel consumption and carbon dioxide emission data, and other input metrics be utilized to predict outputs in upcoming years in Canada?
-
RQ3.2 Is it possible to build Machine Learning models that use vehicle specifications data to predict their fuel consumption and carbon dioxide emission?
-
-
Level 4: Deep Learning
-
RQ4.1 Is it possible to construct Deep Learning models that use vehicle specifications data to predict their fuel consumption and carbon dioxide emission?
-
-
-
RO5 To make recommendations and possible regulations and define areas of future research.
2. Literature Review
3. Results and Discussion
3.1. Level 1: Descriptive Statistics


References
- De Vos, J.; Cheng, L.; Kamruzzaman, M.; Witlox, F. The indirect effect of the built environment on travel mode choice: A focus on recent movers. J. Transp. Geogr. 2021, 91, 102983.
- Straka, W.; Kondragunta, S.; Wei, Z.; Zhang, H.; Miller, S.D.; Watts, A. Examining the economic and environmental impacts of covid-19 using earth observation data. Remote Sens. 2021, 13, 5.
- Intergovernmental Panel on Climate Change. The Fifth Assessment Report of IPCC; IPCC: Geneva, Switzerland, 2019.
- European Environment Agency. Final Energy Consumption by Sector and Fuel; European Environment Agency: Brussels, Belgium, 2015.
- Yang, Z.; Bandivadekar, A. Light-Duty Vehicle Greenhouse Gas and Fuel Economy Standards; International Council on Clean Transportation: Washington, DC, USA, 2017; p. 16.
- Guensler, R. Data Needs for Evolving Motor Vehicle Emission Modeling Approaches; The University of California Transportation Center: Berkeley, CA, USA, 1993; pp. 167–228.
- Qi, Y.G.; Teng, H.H.; Yu, L. Microscale emission models incorporating acceleration and deceleration. J. Transp. Eng. 2004, 130, 348–359.
- Kan, Z.; Tang, L.; Kwan, M.P.; Zhang, X. Estimating vehicle fuel consumption and emissions using GPS big data. Int. J. Environ. Res. 2018, 15, 566.
- Zhao, Q.; Chen, Q.; Wang, L. Real-Time Prediction of Fuel Consumption Based on Digital Map API. Appl. Sci. 2019, 9, 1369.
- Yao, Y.; Zhao, X.; Liu, C.; Rong, J.; Zhang, Y.; Dong, Z.; Su, Y. Vehicle fuel consumption prediction method based on driving behavior data collected from smartphones. J. Adv. Transp. 2020, 2020, 9263605.
- Schoen, A.; Byerly, A.; Hendrix, B.; Bagwe, R.M.; dos Santos, E.C.; Miled, Z.B. A machine learning model for average fuel consumption in heavy vehicles. IEEE Veh. Technol. Mag. 2019, 68, 6343–6351.
- Ntziachristos, L.; Mellios, G.; Tsokolis, D.; Keller, M.; Hausberger, S.; Ligterink, N.; Dilara, P. In-use vs. type-approval fuel consumption of current passenger cars in Europe. Energy Policy 2014, 67, 403–411.
- UN Environment, Electric Light Duty Vehicles. UNEP. 2021. Available online: https://www.unep.org/explore-topics/transport/what-we-do/electric-mobility/electric-light-duty-vehicles (accessed on 30 November 2021).
- European Commission. 2030 Climate and Energy Framework. Climate Action. 2022. Available online: https://ec.europa.eu/clima/eu-action/climate-strategies-targets/2030-climate-energy-frameworken (accessed on 30 November 2021).
- European Commission. 2050 Long-Term Strategy. Climate Action. 2022. Available online: https://ec.europa.eu/clima/eu-action/climate-strategies-targets/2050-long-term-strategy_en (accessed on 30 November 2021).
- Government of Canada. Net-Zero Emissions by 2050. 2021. Available online: https://www.canada.ca/en/services/environment/weather/climatechange/climate-plan/net-zero-emissions-2050.html (accessed on 30 November 2021).
- Pounis, G. Analysis in Nutrition Research: Principles of Statistical Methodology and Interpretation of the Results; Academic Press: Cambridge, MA, USA, 2018.
- Quality of Urban Air Review Group. Diesel Vehicle Emissions and Urban Air Quality; University of Birmingham, Institute of Public and Environmental Health, School of Biological Sciences: Birmingham, UK, 1993.


