Fuel Consumption and CO2 of Light-Duty Vehicles: History
Please note this is an old version of this entry, which may differ significantly from the current revision.
Contributor:

Due to the alarming rate of climate change, fuel consumption and emission estimates are critical in determining the effects of materials and stringent emission control strategies. In this research, an analytical and predictive study has been conducted using the Government of Canada dataset, containing 4973 light-duty vehicles observed from 2017 to 2021, delivering a comparative view of different brands and vehicle models by their fuel consumption and carbon dioxide emissions. Based on the findings of the statistical data analysis, this study makes evidence-based recommendations to both vehicle users and producers to reduce their environmental impacts. Additionally, Convolutional Neural Networks (CNN) and various regression models have been built to estimate fuel consumption and carbon dioxide emissions for future vehicle designs. This study reveals that the Univariate Polynomial Regression model is the best model for predictions from one vehicle feature input, with up to 98.6% accuracy. Multiple Linear Regression and Multivariate Polynomial Regression are good models for predictions from multiple vehicle feature inputs, with approximately 75% accuracy. Convolutional Neural Network is also a promising method for prediction because of its stable and high accuracy of around 70%. The results contribute to the quantifying process of energy cost and air pollution caused by transportation, followed by proposing relevant recommendations for both vehicle users and producers. Future research should aim towards developing higher performance models and larger datasets for building APIs and applications.

  • carbon dioxide emissions
  • light-duty vehicles
  • fuel consumption
  • regression models
  • machine learning
  • convolutional neural network
  • prediction model
  • estimation model
  • climate change

1. Introduction

With the accelerated growth of urbanization, environmental issues caused by transportation have been challenging due to the significant negative impact on climate change [1]. Although the COVID-19 pandemic (commencing in 2020) has temporarily lessened the amount of greenhouse gas emitted into the atmosphere, the temperature of the planet is increasing due to ever-increasing air pollutants [2]. Moreover, 20 to 30% of global greenhouse gases (GHG) are emitted from passenger and freight transportation [3], and 75% of total carbon dioxide emissions originate from passenger cars [4]. Despite stringent fuel and greenhouse gas emission standards regulations, the number of used vehicles has significantly increased, corresponding with the rise in vehicle miles traveled (VMT), leading to their large percentage in air pollutant emissions and natural resource consumption [5].
Estimating and visualizing fuel consumption and exhaust emissions are critical for quantifying the energy cost and air pollution caused by transportation [6], as well as detailing emission control strategies [7]. As, in the past decade, there has been a pressing concern about climate change, estimation models of CO2 emissions and fuel consumption from vehicles are of increasing significance. Therefore, this has invoked a global interest in applied research (in the areas of data analytics and machine learning) for sustainability among global researchers and engineers [8][9].
Although many studies have introduced various machine learning models and techniques for the estimation of carbon dioxide emissions and fuel consumption, the trend focuses more on optimizing models rather than using vehicle metrics to analyze different vehicle types and brands [8][10][11]. Therefore, a comparative study of different types of vehicles and their effect on the environment has significance for the vehicle market. Such research provides deep insights into understanding its environmental impacts. This identified gap is addressed by this research, that is, to provide an insight into vehicle fuel consumption and carbon dioxide emission through a series of rigorous data analytics and machine learning. It is worthwhile to note that the data analysis and machine techniques applied in this research are transferable to similar datasets.
The following research objectives (RO) support the aim of this research.
  • RO1: To carry out a thorough systematic literature review of fuel consumption and carbon dioxide emissions for new light-duty vehicles for retail sale (use case: in Canada);
  • RO2: To identify suitable datasets for analysis and implement the data preparation process;
  • RO3: To utilize appropriate indicators to measure and analyze the sustainable impact of vehicles;
  • RO4: To implement the following data analytics methodologies on the final dataset by addressing corresponding research questions (RQ).
    • Level 1: Descriptive Statistical Analysis
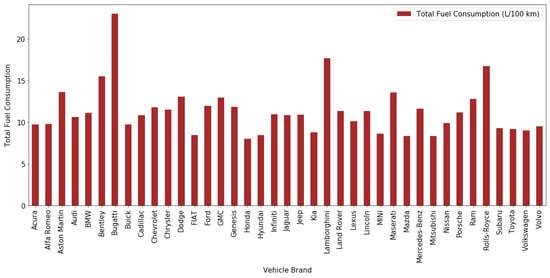
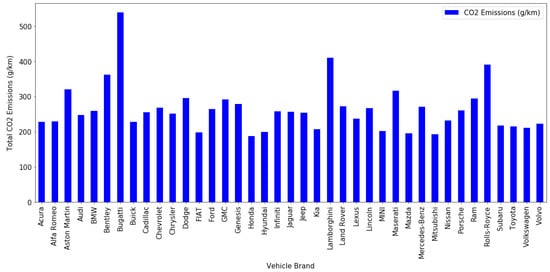
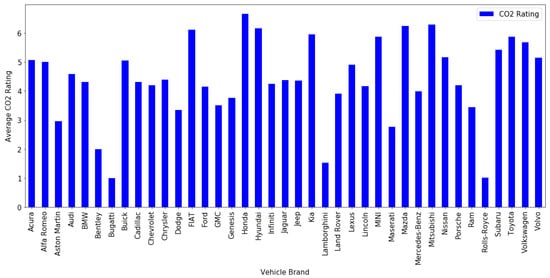
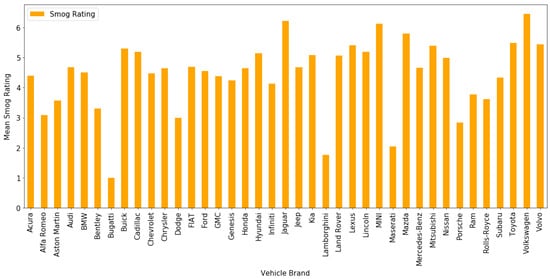
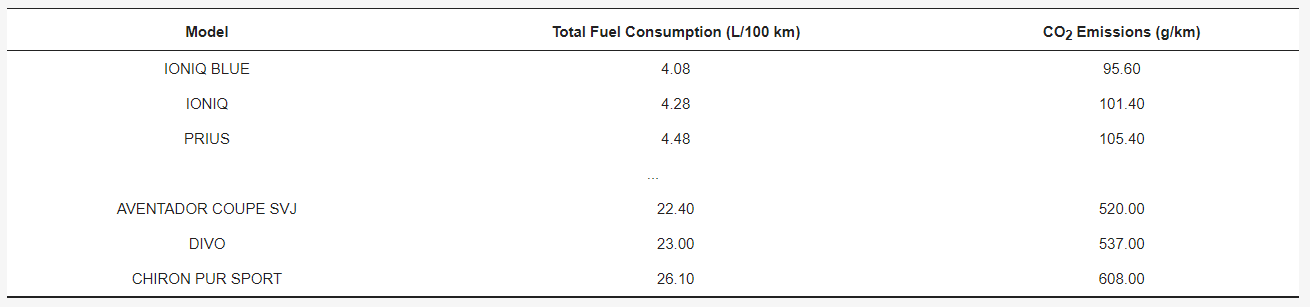
      RQ1.1 How do light-duty vehicles compare in terms of fuel consumption and CO2 emission?
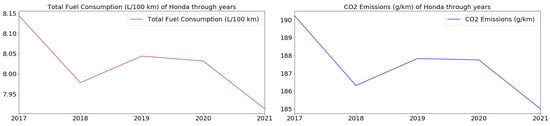
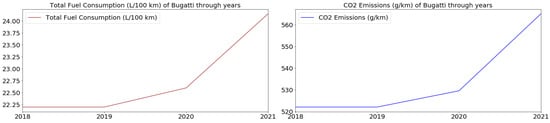
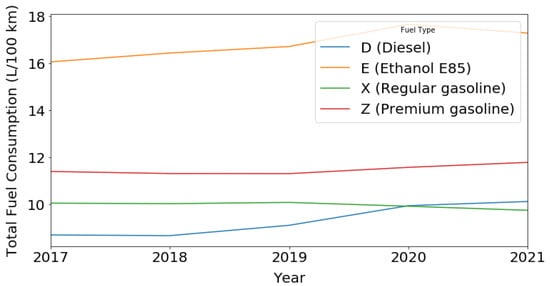
      RQ1.2 How have patterns of fuel consumption and emission of each vehicle type changed throughout the selected period?
    • Level 2: Inferential Statistical Analysis
      RQ2.1 Is there any particular distribution for fuel consumption in the city and the highway of vehicles in Canada?
      RQ2.2 Is there a notable difference in the performance of one specific vehicle (or fuel) type in comparison to the rest of the vehicle types in Canada?
      RQ2.3 How does the brand, model, vehicle class, engine size, cylinder, transmission type, and fuel type correlate with consumption and emissions of various vehicles?
      RQ2.4 What are the relationships between all features to each other of the entire dataset?
    • Level 3: Machine Learning
      RQ3.1 Can fuel consumption and carbon dioxide emission data, and other input metrics be utilized to predict outputs in upcoming years in Canada?
      RQ3.2 Is it possible to build Machine Learning models that use vehicle specifications data to predict their fuel consumption and carbon dioxide emission?
    • Level 4: Deep Learning
      RQ4.1 Is it possible to construct Deep Learning models that use vehicle specifications data to predict their fuel consumption and carbon dioxide emission?
  • RO5 To make recommendations and possible regulations and define areas of future research.
To implement and address the listed research objectives, an analytical and predictive study has been conducted on the Government of Canada dataset, containing 4973 light-duty vehicles observed from 2017 to 2021. Using the above-mentioned four levels of data analytics methodology (i.e., Descriptive Statistical Analysis, Inferential Statistical Analysis, Machine Learning, and Deep Learning), the study unravels current trend and comparative analysis of fuel consumption and carbon dioxide emissions from different brands, vehicle models, vehicle class, cylinders, engine size, transmission, fuel type, smog rating, and fuel consumption within a city and on a highway. The research also predicts these features in the upcoming year and builds up a predictive model for fuel consumption and carbon dioxide emission based on relevant car specifications. The results contribute to the quantifying process of energy cost and air pollution caused by transportation, followed by proposing relevant recommendations for both vehicle users and producers. The prediction results from this study discard abrupt factors, such as legislative requirements, unpredictable economic crises, or similar unforeseen interruptions.

2. Literature Review

With the current alarming rate of climate change, due attention ought to be given to the environmental impact of fuel consumption and emissions from light-duty vehicles, particularly passenger cars. Vehicle emissions can be classified into two principal categories: dangerous exhaust emissions for air quality and human health; and emissions that contribute towards climate change. The emission that has the most significant effect on climate change is carbon dioxide (CO2), which represents the largest proportion of the Green House Gas (GHG) emissions. Notably, road transportation emits about one-fifth of the total emissions of carbon dioxide in the European Union, 75% of which arises from passenger cars [4]. Moreover, the relation between fuel consumption and CO2 is direct and strong [12]. In the European Union (EU), average fleet emission limits are stated in terms of CO2 emissions, in grams per kilometer unit. In North America (i.e., the United States (US), and Canada), similar measures have been used, but with limits imposed in terms of fuel economy. Electric vehicles are a critical step in the transportation sector’s decarbonization. However, the International Energy Agency estimates that, by 2030, it is needed to have at least 20% of all road transport vehicles to be powered by electricity in order to keep global warming below 2 °C (approximately 300 million vehicles) [13]. Consequently, light-duty vehicles with low carbon intensity will continue to play a significant role during the transition. Moreover, legislative requirements have been discussed globally; for example, the European Union (EU) has adopted a climate change agenda to reduce GHG emissions by over 55% by 2030 compared to 1990 [14] and become a net-zero GHG emission economy by 2050 [15]. In addition, the Government of Canada has also set the target of reducing its emissions by 40–45% by 2030 and committed to achieving net-zero emissions by 2050 to avert the worst effects of climate change [16]. Therefore, to satisfy those limits in CO2 and achieve such high targets from legislative requirements, many worldwide researchers have proposed different vehicle emissions and consumption models. The systematic process for this literature review is to specify current approaches that have been used by various researchers, identify which models and methodologies have been used in each approach, before identifying the research gap.

3. Results and Discussion

This section is structured based on the Micro Methodology mentioned in Section 3.2, and divided by four levels of data analytics.

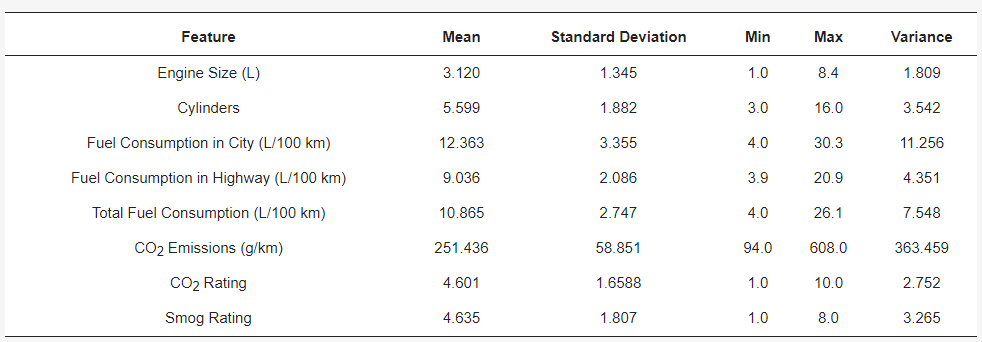
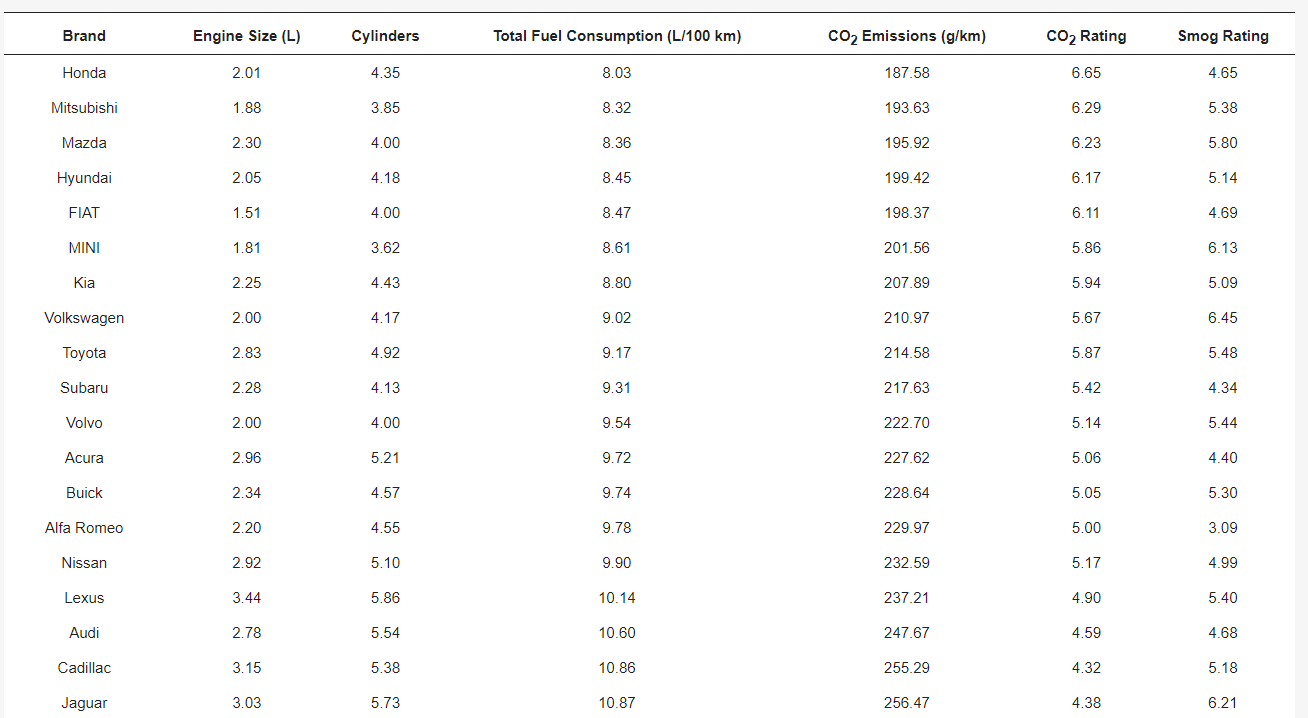
3.1. Level 1: Descriptive Statistics

The general purpose of this Level 1 is to observe 4973 light-duty vehicles from 2017 to 2021 by their fuel consumption and carbon dioxide emissions from different brands, vehicle models, vehicle class, cylinders, engine size, transmission, fuel type, smog rating, and fuel consumption in a city and on a highway. Recall that the CO2 and smog ratings in the dataset were calculated using manufacturer ratings rather than vehicle testing, and were ranked from worst (1) to best (10) with no unit.
Firstly, in order to address RQ1.1 (How do light-duty vehicles compare in terms of fuel consumption and carbon dioxide emission?), descriptive statistics for all numerical columns in the dataset have been conducted to provide an evaluation of the data distribution. The purpose of descriptive statistics is to provide a statistical understanding of the dataset quality [17]. It can be seen from Table 1 that the average total fuel consumption is 10.86 L/100 km, of which 57.77% (12.36 L/100 km) from the city and 42.22% from the highway (9.04 L/100 km). Additionally, it is clear from the statistics that the average CO2 emissions of all vehicles are 251.44 g/km, with a standard deviation of 58.85 g/km. Ranking from worst (1) to best (10), the average CO2 rating is 4.60, and the average smog rating is 4.63. Moreover, dispersion statistics of standard deviation and variance also indicate that the size of the distribution of values expected is reliable enough for prediction. Regarding the fuel consumption and carbon dioxide emission of different brands, their average data are indicated in Table 2.
Table 1. Descriptive statistics of numerical columns of the dataset.
Table 2. Average data of different vehicle brands.
In this dataset, the number of vehicles from Ford accounts for the highest with 436 vehicles, and the lowest amount is from Bugatti with 6 vehicles. After the descriptive statistical analysis, a bar chart is created, as presented in Figure 1, to demonstrate the average fuel consumption of different brands. It reveals that Honda consumes fuel the least (8.03 L/100 km), while Bugatti has the highest fuel consumption (22.98 L/100 km). Moreover, from Figure 2 and Figure 3, Honda seems to be the greenest brand as it emits the least CO2 (187.58 g/km) and attains the highest CO2 rating (6.65), whereas Bugatti continues to perform poorly in its environmental-friendliness with the highest CO2 emissions (538.83 g/km) and the worst CO2 rating (1.00).
Figure 1. Total fuel consumption (L/100 km) of each brand.
Figure 2. CO2 emissions (g/km) of each brand.
Figure 3. CO2 rating of each brand.
Considering smog, Figure 4 proves that Volkswagen emits smog the least (6.45), and Bugatti seems to be the worst brand in terms of smog (1.00), fuel consumption, and CO2 emissions.
Figure 4. Smog rating of each brand.
Regarding fuel consumption and CO2 emissions of different models, Table 3 explains that the IONIQ BLUE model consumes and emits the least, and in contrast, the CHIRON PUR SPORT model consumes and emits the most.
Table 3. CO2 emissions (g/km) and total fuel consumption (L/100 km) of each model.
Similarly, when considering fuel consumption and CO2 emissions, Station wagon (Small) class, Engine Size 1.2L, 3 Cylinders, Transmission Type AV1, and Fuel Type D (Diesel) consume fuel and emit CO2 the least. Conversely, Van (Passenger) class, Engine Size 8.0, 16 Cylinders, Transmission Type A6, and Fuel Type E (Ethanol E85) seem to be the most consumers and emitters. However, since the Volkswagen emissions scandal emerged, the negative image of diesel has intensified. The actual NO and PM emissions of diesel vehicles, according to recent researchers, are significantly greater than those reported. Because of carcinogenic compounds, diesel particle emissions are also a possible health danger [18]. Therefore, the conclusion that Ethanol E85 emits the most among other fuel types remains the scope of the data in this research.
In this research, it is evident that Honda is the greenest brand, and it is essential to analyze its pattern of consumption and emission through the years. From Figure 5, in 2018, Honda seems to have optimized fuel consumption and carbon dioxide emissions of their products. Although the data in 2019 and 2020 show a slight increase, it dramatically drops again in 2021.
Figure 5. CO2 emissions (g/km) and total fuel consumption (L/100 km) of Honda over time.
Given the same analysis on the brand that has demonstrated to possess the least environmental awareness, Bugatti has never considered optimizing their products’ consumption and emission, proven by the significant growth in total fuel consumption and CO2 emission shown in Figure 6.
Figure 6. CO2 emissions (g/km) and total fuel consumption (L/100 km) of Bugatti over time.
Considering the fuel consumption of each fuel type during the years, it can be seen from Figure 7 that Fuel Type E (Ethanol E85) and Z (Premium gasoline) always consume more than Fuel Type X (Regular gasoline) and D (Diesel). Over the period, Fuel Type D (Diesel), E (Ethanol E85), and Z (Premium gasoline) all have increased their consumption, whereas Fuel Type X (Regular gasoline) has a slight decrease, thus having the least fuel usage in 2021.
Figure 7. Total fuel consumption (L/100 km) of each fuel type over time.
This entry is adapted from https://www.mdpi.com/2076-3417/12/2/803

References

  1. De Vos, J.; Cheng, L.; Kamruzzaman, M.; Witlox, F. The indirect effect of the built environment on travel mode choice: A focus on recent movers. J. Transp. Geogr. 2021, 91, 102983.
  2. Straka, W.; Kondragunta, S.; Wei, Z.; Zhang, H.; Miller, S.D.; Watts, A. Examining the economic and environmental impacts of covid-19 using earth observation data. Remote Sens. 2021, 13, 5.
  3. Intergovernmental Panel on Climate Change. The Fifth Assessment Report of IPCC; IPCC: Geneva, Switzerland, 2019.
  4. European Environment Agency. Final Energy Consumption by Sector and Fuel; European Environment Agency: Brussels, Belgium, 2015.
  5. Yang, Z.; Bandivadekar, A. Light-Duty Vehicle Greenhouse Gas and Fuel Economy Standards; International Council on Clean Transportation: Washington, DC, USA, 2017; p. 16.
  6. Guensler, R. Data Needs for Evolving Motor Vehicle Emission Modeling Approaches; The University of California Transportation Center: Berkeley, CA, USA, 1993; pp. 167–228.
  7. Qi, Y.G.; Teng, H.H.; Yu, L. Microscale emission models incorporating acceleration and deceleration. J. Transp. Eng. 2004, 130, 348–359.
  8. Kan, Z.; Tang, L.; Kwan, M.P.; Zhang, X. Estimating vehicle fuel consumption and emissions using GPS big data. Int. J. Environ. Res. 2018, 15, 566.
  9. Zhao, Q.; Chen, Q.; Wang, L. Real-Time Prediction of Fuel Consumption Based on Digital Map API. Appl. Sci. 2019, 9, 1369.
  10. Yao, Y.; Zhao, X.; Liu, C.; Rong, J.; Zhang, Y.; Dong, Z.; Su, Y. Vehicle fuel consumption prediction method based on driving behavior data collected from smartphones. J. Adv. Transp. 2020, 2020, 9263605.
  11. Schoen, A.; Byerly, A.; Hendrix, B.; Bagwe, R.M.; dos Santos, E.C.; Miled, Z.B. A machine learning model for average fuel consumption in heavy vehicles. IEEE Veh. Technol. Mag. 2019, 68, 6343–6351.
  12. Ntziachristos, L.; Mellios, G.; Tsokolis, D.; Keller, M.; Hausberger, S.; Ligterink, N.; Dilara, P. In-use vs. type-approval fuel consumption of current passenger cars in Europe. Energy Policy 2014, 67, 403–411.
  13. UN Environment, Electric Light Duty Vehicles. UNEP. 2021. Available online: https://www.unep.org/explore-topics/transport/what-we-do/electric-mobility/electric-light-duty-vehicles (accessed on 30 November 2021).
  14. European Commission. 2030 Climate and Energy Framework. Climate Action. 2022. Available online: https://ec.europa.eu/clima/eu-action/climate-strategies-targets/2030-climate-energy-frameworken (accessed on 30 November 2021).
  15. European Commission. 2050 Long-Term Strategy. Climate Action. 2022. Available online: https://ec.europa.eu/clima/eu-action/climate-strategies-targets/2050-long-term-strategy_en (accessed on 30 November 2021).
  16. Government of Canada. Net-Zero Emissions by 2050. 2021. Available online: https://www.canada.ca/en/services/environment/weather/climatechange/climate-plan/net-zero-emissions-2050.html (accessed on 30 November 2021).
  17. Pounis, G. Analysis in Nutrition Research: Principles of Statistical Methodology and Interpretation of the Results; Academic Press: Cambridge, MA, USA, 2018.
  18. Quality of Urban Air Review Group. Diesel Vehicle Emissions and Urban Air Quality; University of Birmingham, Institute of Public and Environmental Health, School of Biological Sciences: Birmingham, UK, 1993.
More
This entry is offline, you can click here to edit this entry!
Video Production Service