The Y Box binding protein 1 (YB1) is a multifunctional protein, found both in the cytoplasm and inside the nucleus, that belongs to the highly conserved Cold Shock Domain protein family. YB1 is highly expressed in TNBC tumors of AA origin when compared to CAs. Increased expression levels and activity of YB1 correlates with poor disease outcomes, resistance to chemotherapy, and the activation of the cancer stem cell (CSC) phenotype, with higher levels in AA than in CA TNBC tumors.
1. YB1 Expression Levels Are Increased in TNBC Cell Lines and Tumors and Are Associated with Poor Survival and Worst Patients’ Outcomes
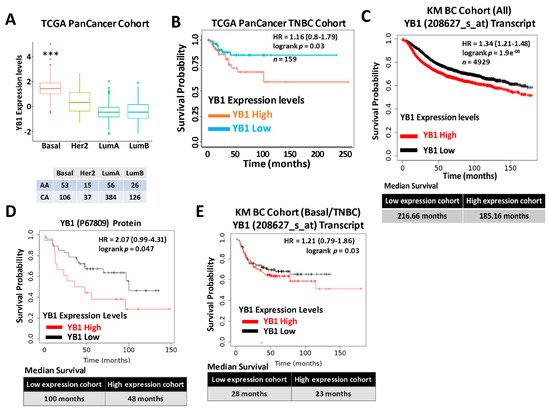
Expression levels of YB1 were significantly elevated in aggressive BC cancer cell lines when compared to their less aggressive counterparts [1]. More importantly, researchers showed that YB1 expression levels are significantly higher in TNBC cell lines when compared to all other BC subtypes [1], which indicated an association between YB1 expression and the aggressiveness of TNBC cell lines. Researchers also showed that YB1 expression correlated with the metastatic potential of three TNBC metastasis progression models, namely the human MCA10A series [2], the murine 4T1 series [3], and the NME series [4][5]. To validate these findings in human patients’ specimens, we interrogated the datasets of two large, independent BC cohorts. The first cohort, the TCGA PanCancer BC cohort, which contains clinical information on 1082 BC patients, including 181 TNBCs, showed a significant (p < 0.0001) positive association between YB1 expression levels and the basal (TNBC) BC subtype (Figure 1A). Elevated expression levels of YB1 in the TNBC subtype also correlated (p = 0.03) with poor disease outcome and reduced survival probability in this cohort (Figure 1B). Next, researchers interrogated the BC KM-Plotter (https://kmplot.com/analysis, accessed on 6 January 2021) cohort, which contains clinical information on ~5000 BC patients, including 405 TNBCs, and this showed a very significant (p = 1.9 × 10⁸), positive correlation between YB1 mRNA expression and reduced survival probability (Figure 1C, upper panel). In this cohort, BC patients with high levels of YB1 in their tumors had worst clinical outcomes when compared to patients with low levels of YB1, and patients with high tumor YB1 have an average reduced survival of 31 months when compared to patients with low tumor YB1 (Figure 1C, lower panel). This correlation between YB1 expression levels and poor prognosis was also confirmed at the protein expression level (Figure 1D). Finally, researchers found YB1 mRNA expression levels in the TNBC cohort to also correlate with reduced survival (Figure 1E). Thus, the data support the function of YB1 as a promoter of BC aggressiveness in patients with TNBC tumors.
Figure 1. (A) Quantification of Yb1 mRNA expression levels based on log2 RSEM values batch normalized from Illumina HiSeq RNASeq data by breast cancer subtype in the breast cancer BRCA patient data from TCGA PanCancer Atlas. Expression levels of YB1 are significantly higher (*** p < 0.0001, Wilcoxon) in the basal (TNBC) subtype when compared to other BC subtypes. (B) Survival analysis based on YB1 expression levels (median values) in the basal subtype of the TCGA BRCA PanCancer Atlas cohort. YB1 activation in TNBCs is associated with poorer overall survival (p = 0.049). (C) KM plot correlating survival of 4929 BC patients with YB1 mRNA expression levels. High YB1 expression levels correlate with poor survival probability in BC patients (p < 1.9 × e−8). (D) KM plot correlating the survival of BC patients with YB1 protein expression levels. High YB1 expression levels correlate with poor survival probability in BC patients (p = 0.047). (E) KM plot correlating the survival of TNBC patients with YB1 mRNA expression levels. High YB1 expression levels correlate with poor survival probability in TNBC patients (p = 0.03).
2. YB1 Is Disparately Highly Expressed in AA vs. CA TNBC Cell Lines and Tumors and Correlates with Poor Outcome in AA TNBC
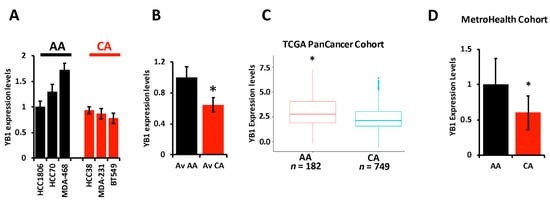
The literature provides overwhelming evidence that incidence of TNBC and TNBC-related death are disparately elevated in AA women when compared to their CA counterparts. The socioeconomic status and lack of access to health care by the AA population cannot alone explain these disparities, which suggests a difference in the biology of TNBC tumors between AA and CA might also contribute to the observed disparities. Researchers therefore set out to investigate whether the oncogenic activity of YB1 in TNBC tumors contributes to these disparities. First, researchers assessed the expression levels of YB1 by RT-PCR in six established TNBC cell lines; three from AA and three from CA patients, and found YB1 to be significantly (p < 0.001) higher in AA cell lines MDA-MB-468, HCC70, and HCC180 when, compared to CA TNBC cell lines MDA-MB-231, BT549, and HCC38 (Figure 2A,B). Researchers confirmed the results that were obtained in our cell lines in the human specimens from the TCGA PanCancer cohort, and found YB1 expression levels to be significantly (p < 0.0001) higher in AA patients (n = 182) when compared to CA patients (n = 749) (Figure 2C). Since mRNA levels may not always correlate with protein levels, researchers interrogated the relationship between YB1 mRNA and protein levels in the TCGA PanCancer cohort and found a significant positive correlation (p = 1.77 × e−15, Spearman) between mRNA and protein levels. Researchers also found YB1 protein expression levels to be significantly (p = 2.03 × e−3) higher in AA BC tumors when compared to Cas. Researchers further confirmed these findings in a separate TNBC cohort that researchers acquired from the MetroHealth tumor biobank which contains clinical and survival information on 45 TNBC patients (25 AA and 20 CA). RT-PCR analyses showed that YB1 expression levels were significantly (p = 0.002) higher in AA TNBC tumors when compared to their CA counterparts (Figure 2D). Thus, researchers show that YB1 expression levels are associated with the AA race.
Figure 2. (A) YB1 mRNA transcript quantification in AA and CA TNBC cell lines was determined by qt-RT-PCR and data was plotted as the fold change in HCC1806. (B) Average YB1 mRNA transcripts in AA and CA TNBC cell lines was plotted as the fold change in AA cell lines. YB1 transcript expression levels are significantly higher (* p < 0.001, Student ’t test) in AA TNBC cell lines when compared to their CA counterparts. (C) Comparison of YB1 expression levels, levels based on log2 RSEM values batch normalized from Illumina HiSeq RNASeq data, between AA and CA BC patients from the TCGA BRCA PanCancer Atlas cohort. YB1 expression levels are significantly higher (* p < 0.01, Wilcoxon) in AA when compared to CA BC tumors. (D) Comparison of YB1 expression levels between CA and AA TNBC from the MetroHealth TNBC cohort, as determined by qt-RT-PCR. Data was plotted as the fold change to AA tumors. YB1 expression levels are significantly higher (* p < 0.01, Student ’t test) in AA when compared to CA BC tumors.
3. Loss of YB1 Inhibits the Oncogenic Behavior of AA TNBC Cell Lines In Vitro
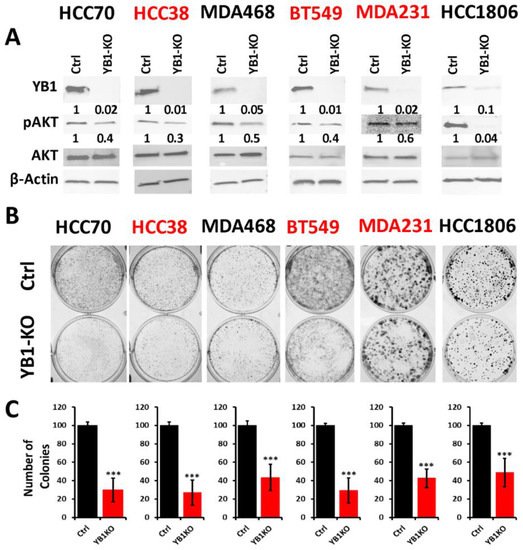
To better understand how the oncogenic activity of YB1 contributes to TNBC disparities, researchers sought to determine the effect of inhibition of YB1 expression on the behavior of TNBC cell lines of both AA and CA origins. Researchers applied the Synthego CRISPR-based knockout strategy that is based on a ribonucleoprotein (RNP) mix which contains both sgRNAs oligos and the translated Cas9 protein, and is used to deliver the sgRNAs to the nucleus of target cells via electroporation without the need for virus infection and drug selection. Researchers used a pool of three different sgRNAs to target YB1 in three AA and three CA TNBC cell lines. Western blot analyses showed a KO efficiency of more than 90% in all six cell lines (Figure 3A ). The KO efficiency was sustained after more than 15 passages in all six lines supporting the effectiveness the KO strategy. In some cases, after serial passaging of the KO cells, researcher observed progressive re-expression of YB1, and a simple second electroporation with the sgRNA RNP mix was sufficient to eliminate the residual YB1 expression.
Figure 3. (A) Western Blot analysis of protein lysates from parental (Ctrl) AA (black font) and CA (red font) TNBC cell lines and their YB1-KO derivatives, that were probed with the indicated antibodies. β-Actin was used a loading control. (B,C) Colony formation assay. The numbers under the bands represent the fold change of the Western Blot signal normalized to that of the parental cell line, as determined by densitometry analyses from one representative of 3 replicate blots. (B) Representative images of colony formation of parental and YB1-KO AA (black font) and CA (red font) TNBC cell lines. (C) Quantification of the number of colonies in each plate. Data is plotted as the percentage change from the control cells. Data shown are representative of 3 replicates (***, p < 0.0001, Student ’t test).
The AKT pathway is widely documented to be affected by the loss of YB1 expression
[6], which researchers confirmed in our YB1-KO cells where phosphorylation levels of AKT were decreased in all six cell lines as a result of the loss of expression of YB1 (
Figure 3A). Next, researchers used the colony formation assay as an in vitro indicator assay for the oncogenicity of cancer cells, and found the loss of YB1 expression to significantly inhibit the colony formation potential of all six cell lines (
Figure 3B,C). While colony formation was reduced in all six TNBC cell lines, the fold reduction in the AA cell lines ranged from 1.8 to 3 and averaged a 2.4-fold inhibition when compared to the CA cell lines, where the fold reduction ranged from 2.5 to 3.25 with and an average of 2.95-fold inhibition (
Figure 3C). These data indicate that the CA TNBC cells are more sensitive to the loss of YB1 activity when compared to their AA counterparts, which show more addiction to YB1.
4. Loss of YB1 Inhibits Tumor Growth and Metastasis of AA TNBC Cell Lines In Vivo
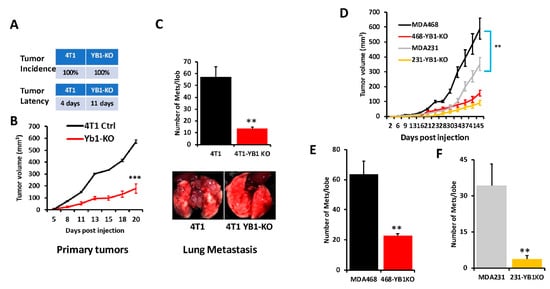
To further assess the effects of loss of YB1 expression on tumor growth and metastasis of TNBC cells in vivo, mammary fat pads of female Balb/C mice were inoculated with parental syngeneic 4T1 TNBC cells or their YB1-KO derivatives, and tumor growth was assessed over 5 weeks. Loss of YB1 significantly inhibited the growth of primary tumors (Figure 4A,B). While every mouse implanted with the parental 4T1 or the YB1-KO cells developed tumors (100% incidence), tumor latency was more than 1 week longer in the mice implanted with the YB1-KO 4T1 cells (Figure 4A). Tumor burden, as assessed by tumor volume (Figure 4B), was significantly lower (p < 0.0001) in mice implanted with the YB1-deficient cells compared to their parental counterparts. Therefore, researchers show that loss of YB1 expression inhibits tumor growth, in vivo. Proliferation assays in 2D cultures showed no significant difference in cell growth between parental and YB1-KO. Therefore, the differences in tumor growth were rather the result of inhibition of YB1 oncogenic activity. Researchers also used Western Blot analyses of tumor lysates to confirm the sustained loss of YB1 expression in the tumors derived from the YB1-KO cells as these tumors grew in a slower rate as compared to the tumors derived from the parental cells.
Figure 4. (A) Incidence (top) and latency (bottom) of tumor growth of prenatal 4T1 or its YB1-KO derivative cells that were inoculated in the mammary fat pads of female Balb/C mice (n = 5 mice per group). (B) Quantification of tumor volume of tumors generated from the inoculation of control 4T1 cells or their YB1-KO derivatives into the mammary fat pads of female Balb/C mice. (C, top panel) Quantification of lung metastasis nodules from the animal experiment described in (B). The bottom panel shows representative lungs from each mouse group. (D) Quantification of the tumor volume of tumors generated from the inoculation of control MDA-MB-231 (grey graph), MDA-MB-468 (black graph) cells or their respective YB1-KO derivatives (yellow and red graphs, respectively) into the mammary fat pads of female NSG mice (n = 5 mice per group). (E,F) Quantification of lung metastasis nodules from the MDA-MB-468 (E) and the MDA-MB-231 animal experiment described in (D) (**, p < 0.001, Student ’t-test).
Next, researchers sought to investigate whether inhibition of YB1 expression influences BC metastasis to the lungs. In the spontaneous metastasis assay, after the mice were sacrificed and the lungs were removed, and metastasis foci were counted. The number of lung metastasis foci was more than five-fold (p < 0.001) lower in mice injected with the YB1-deficient 4T1 cells when compared to their parental counterparts (Figure 4C). These results show that YB1 plays a critical role in the growth, invasion, and metastasis of TNBC tumors, as demonstrated here in the tumor growth and the spontaneous metastasis assays.
Next, researchers assessed whether loss of YB1 would differentially affect tumor growth and metastasis in human AA vs CA TNBC cell lines. Researchers used one CA TNBC cell line (MDA-MB-231) and one AA TNBC cell line (MDA-MB-468) and the immuno-compromised mouse BC model NOD-scid-IL2Rgamma knockout (NSG) mice. While mice implanted by either the parental MDA-MB-231 or MDA-MB-468 developed tumors (Figure 4D), tumor burden was significantly higher in the mice implanted with the AA MDA-MB-468 TNBC cells (Figure 4D, black graph) when compared to the AA MDA-MB-231 cells (Figure 4D, grey graph), which suggests the more aggressive nature of TNBC tumors of AA origin. Additionally, the loss of YB1 expression inhibited the tumor growth of both MDA-MB-231-YB1-KO cells (Figure 4D, yellow graph) and MDA-MB-468-YB1-KO cells (Figure 4D, red graph). Tumor growth inhibition was, however, more pronounced in the CA MDA-MB-231 cells that are more sensitive to loss of YB1 when compared to AA MDA-MB-468 cells that are more resistant to loss of YB1 (Figure 4D, compare red graph to yellow graph). Thus, our data suggest a difference in sensitivity to loss of YB1 in tumor growth between AA and CA TNBC cells in vivo. These findings were also confirmed with respect to spontaneous lung metastasis (Figure 4E,F), where lung metastasis burden was ~2-fold higher with the AA MDA-MB-468 cells when compared to the CA MDA-MB-231 cells (Compare black bar of Figure 4E to grey bar of Figure 4F). Finally, while loss of YB1 significantly inhibited the metastasis of both AA MDA-MB-468 cells (Figure 4E, red bar) and CA MDA-MB-231 cells (Figure 4F, yellow bar), lung metastasis was reduced by ~3-fold in the AA MDA-MB-468 cells (Figure 4E) when compared to more than 8-fold in the sensitive CA MDA-MB-231 cells (Figure 4F). Together, these data, strongly suggest a critical role of YB1 in the aggressiveness of AA TNBC in vitro and in vivo.
5. YB1 Is Associated with the Cancer Stem Cell Phenotype in AA TNBC
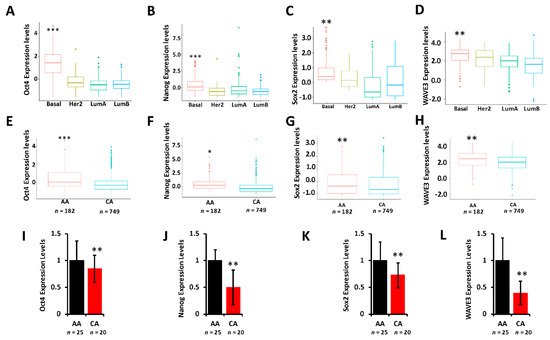
It is showed that YB1 is required for the regulation of cancer stem cell phenotypes by modulating the expression levels of cancer stem cell (CSC) transcription machinery, including Oct4, Sox2, and Nanog. To determine whether these CSC transcription factors are differentially expressed between AA and CA TNBC tumors and cell lines, researchers interrogated the TCGA PanCancer cohort and found Oct4 (
Figure 5A), Nanog (
Figure 5B), and Sox2 (
Figure 5C) to be significantly (
p < 0.001) highly expressed in tumors of the basal (TNBC) breast cancer subtype when compared to tumors of Her2, Luminal-A, or Luminal-B subtypes. Oct4 (
Figure 5D), Nanog (
Figure 5E), and Sox2 (
Figure 5F) were also significantly disparately highly expressed in AA tumors when compared to their CA counterparts. Researcher have also shown that the WAVE3-YB1 signaling axis is required for the activation of the CSC phenotype in TNBC
[7][8]. Here, WAVE3 is also significantly (
p < 0.001) highly expressed in the tumors of the basal subtype (
Figure 5G) and is significantly (
p < 0.001) highly expressed in AA than in CA tumors (
Figure 5H). Thus, researcher show that not only YB1 is highly expressed in AA versus CA TNBC tumors, but YB1-associated CSC genes are also disparately associated with TNBC tumors of AA origin, which may in part explain the aggressivity of these tumors in the AA population. Researcher confirmed these findings in our MetroHealth TNBC cohort, where YB1 (
Figure 2E), Oct4 (
Figure 5I), Nanog (
Figure 5J), Sox2 (
Figure 5K), and WAVE3 (
Figure 5L) are significantly highly expressed in AA tumors when compared to their CA counterparts.
Figure 5. (A–D) Comparison of the expression levels of Oct4 (A), Nanog (B), Sox2 (C), and WAVE3 (D) between the BC subtypes in the TCGA BRCA PanCancer Atlas cohort. (**, p < 0.001; ***, p < 0.0001, Wilcoxon). (E–F) Comparison of the expression levels of Oct4 (E), Nanog (F), Sox2 (G), and WAVE3 (H) between AA and CA BC patients in the TCGA BRCA PanCancer Atlas cohort. (*, p < 0.01; **, p < 0.001; ***, p < 0.0001, Wilcoxon). In all cases, mRNA expression levels were based on log2 RSEM values batch normalized from Illumina HiSeq RNASeq data. (I–L) Comparison of the expression levels of Oct4 (I), Nanog (J), Sox2 (K), and WAVE3 (L) between AA and CA BC patients in the MetroHealth cohort, as determined by qt-RT-PCR. Data were plotted as fold change to AA tumors. (* p < 0.01, **, p < 0.001; ***, p < 0.0001, Wilcoxon).
6. YB1 Is Associated with Chemoresistance in AA TNBC Both In Vitro and In Vivo
YB1 was shown to be associated with chemotherapy resistance in several types of cancer, including BC (reviewed in
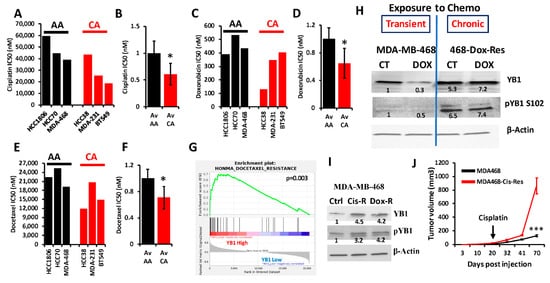
[9]). Researchers interrogated the Cancer Cell Line Encyclopedia (CCLE) for the IC50 of three of the most commonly used chemotherapeutic agents for the treatment of patients with TNBC (Cisplatin, Docetaxel and Doxorubicin) in cell lines of the TNBC subtype; these included three AA and three CA TNBC cell lines. Researchers found the IC50 values, which are indicative of level of resistance to a given drug, to be consistently higher in AA cell lines when compared to their CA counterparts for cisplatin (
Figure 6A,B), doxorubicin (
Figure 6C,D) and docetaxel (
Figure 6E,F). Since YB1 expression levels were also significantly elevated in AA cell lines when compared to their CA counterparts (
Figure 2E), these results show a clear positive correlation between YB1 expression and resistance to chemotherapies. Gene set enrichment analysis (GSEA) of the TCGA breast cancer cohort confirmed our findings, where researchers found a significant (
p = 0.003) enrichment of genes that are associated with docetaxel resistance in BC tumors that have increased levels of YB1 expression (
Figure 6G)
[10]. To investigate the role of YB1 in the chemoresistance in TNBC, researchers treated MDA-MB-468 with doxorubicin for 48 h. and found that this transient treatment resulted in the inhibition of YB1 expression and its phosphorylation levels (
Figure 6H). However, in MDA-MB-468 that were generated to be permanently resistant to doxorubicin (Dox-Res), researchers found this chronic exposure to doxorubicin to instead activate both the expression and phosphorylated levels of YB1 (
Figure 6H). These finding were confirmed in MDA-MB-468 that were generated to be resistant to cisplatin (Cis-Res) and found both the expression and phosphorylation of YB1 to be increased in the Cis-Res cells when compared to their control counterparts (
Figure 6I). Thus, researchers show that chronic exposure to chemotherapy induces YB1 expression and phosphorylation. Next, researchers injected either the parental or the cisplatin-resistant (Cis-Res) MDA-MB-468 cells into the mammary fat pads of female NSG mice. At 21 days post implantation, mice from both the groups received two doses of cisplatin (1 mg/kg, IP) per week for 3 weeks, and tumor growth was followed for several weeks (
Figure 6J). Researchers found that treatment with cisplatin resulted in inhibition of tumor growth in both groups for the first three weeks following the treatment; after this three-week period, the mice that were injected with the Cis-res cells showed a tumor growth that was much faster than the mice injected with the parental control cells. After 70 days of follow-up, the average volume of the tumors derived from the parental cells did not exceed 150 mm
3, while that of the tumors derived from the cisplatin-resistant cells rapidly reached the maximal tumor burden of more than 1000 mm
3 (
Figure 6J). Therefore, researchers speculate that the increased YB1 expression in the Cis-resistant cells, which is induced by chronic exposure to chemotherapy, confers these cells with an enhanced tumor growth potential and makes them refractory to chemotherapy treatment. Together, our data suggest a novel positive feedback loop between YB1 expression and chemoresistance, therefore creating a vicious oncogenic environment which activates a sustained tumor growth and metastasis, which is more active in AA TNBC tumors, and ultimately contributes to the disparities in health outcomes in AA women with TNBC disease.
Figure 6. (A–E) Comparisons of the IC50 values of cisplatin (A,B), doxorubicin (C,D) and docetaxel (E,F) between AA (black bars) and CA (red bars) TNBC cell lines. The IC50 values were derived from the CCLE database. Average IC50 in the AA and CA TNBC cell lines was plotted as fold change to AA cell lines for cisplatin (B), doxorubicin (D) and docetaxel (F), (*, p < 0.01, Fisher’s Exact). (G) Gene set enrichment analysis of the TCGA BRCA PanCancer Atlas dataset shows that the gene signature associated with docetaxel resistance is enriched in the BC tumors that express high levels of YB1. (H) Western Blots with the indicated antibodies of protein lysates from parental MDA-MB-MB-468 cells or those that were treated with doxorubicin for 48 h (transient treatment), or MDA-MB-468 cells that were generated to be permanently resistant (chronic) to doxorubicin (468-Dox-res). The numbers under the bands represent the fold change of the Western Blot signal normalized to that of the parental cell line. (I) Western Blots with the indicated antibodies of protein lysates from parental MDA-MB-468, their cisplatin resistant (Cis-R) or doxorubicin (Dox-R) derivatives. β-Actin was used as a loading control. The numbers under the bands represent the fold change of the Western Blot signal normalized to that of the parental cell line. (J) Quantification of the tumor volume of tumors generated from the inoculation of parental MDA-MB-468 cells (black graph), or their cisplatin resistant (Cis-R) derivatives into the mammary fat pads of female NSG mice (n = 5 mice per group). Treatment with cisplatin started 21 days post inoculation. (***, p < 0.0001, Student ’t test).
 +1 credit