Your browser does not fully support modern features. Please upgrade for a smoother experience.
Submitted Successfully!
 +1 credit
Thank you for your contribution! You can also upload a video entry or images related to this topic.
For video creation, please contact our Academic Video Service.
| Version | Summary | Created by | Modification | Content Size | Created at | Operation |
|---|---|---|---|---|---|---|
| 1 | Jianhui Bai | + 1146 word(s) | 1146 | 2021-06-17 11:15:49 | | | |
| 2 | Rita Xu | Meta information modification | 1146 | 2021-06-17 12:10:26 | | | | |
| 3 | Rita Xu | Meta information modification | 1146 | 2021-10-29 04:25:54 | | | | |
| 4 | Rita Xu | Meta information modification | 1146 | 2021-11-25 04:54:48 | | |
Video Upload Options
We provide professional Academic Video Service to translate complex research into visually appealing presentations. Would you like to try it?
Cite
If you have any further questions, please contact Encyclopedia Editorial Office.
Bai, J. Global Solar Radiation. Encyclopedia. Available online: https://encyclopedia.pub/entry/10968 (accessed on 15 July 2026).
Bai J. Global Solar Radiation. Encyclopedia. Available at: https://encyclopedia.pub/entry/10968. Accessed July 15, 2026.
Bai, Jianhui. "Global Solar Radiation" Encyclopedia, https://encyclopedia.pub/entry/10968 (accessed July 15, 2026).
Bai, J. (2021, June 17). Global Solar Radiation. In Encyclopedia. https://encyclopedia.pub/entry/10968
Bai, Jianhui. "Global Solar Radiation." Encyclopedia. Web. 17 June, 2021.
Copy Citation
An empirical model of global solar irradiance (EMGSI) under all sky conditions was developed by using solar radiation and meteorological parameters at Sodankylä. The calculated hourly global solar irradiance is in agreement with that observed at the ground during 2008–2011 and at the top of the atmosphere (TOA). Using this empirical model, the albedos at the TOA and the surface were calculated, and they are in agreement with the satellite-retrieved values.
absorbing and scattering factors
energy
aerosol optical depth
1. Introduction
The surface temperatures in the Arctic increase much faster than the global average, a phenomenon known as Arctic Amplification. The most significant increase occurs in the winter [1][2][3]. The Arctic warming is related to the imbalance of energy budget at the ground and the top of the atmosphere (TOA), sea-ice–albedo feedback, lapse-rate feedback, temperature inversion, enhanced greenhouse effect [1] and the reasons for the climate change in the Arctic region are still unclear.
The Sun provides important energy to the atmospheric gases, liquids and particles (GLPs) and initiates their changes in the three phases through chemical and photochemical reactions (CPRs). Therefore, solar radiation transfers in and interacts with the atmospheric GLPs. The attenuation in the atmosphere and reflections at the ground and the TOA are necessary to be investigated; these physical and chemical processes control/interact with the atmospheric movement through short- and long-wave radiation in different ways [4][5][6][7][8][9][10][11][12], and should be studied for further understanding the regional climate and climate change in the Arctic.
The popular radiative transfer models and empirical models are used to estimate global, direct and diffuse solar radiation at the ground and briefly described in References [12][13][14][15][16][17][18][19][20]. To thoroughly investigate the Sun–atmosphere–Earth system, variations of solar radiation at the surface and the TOA, the loss of solar radiation in the atmosphere, the albedos at the surface and the TOA, and the interactions between solar radiation and meteorological variables are required.
2. Global Solar Irradiance during 2000–2018
During 2000–2018, annual averages of observed global and diffuse solar irradiance (n= 92,941) were 0.59 and 0.29 MJ m−2, thus, the direct horizontal irradiance was a little larger than the diffuse irradiance at the surface, average of S/G was 0.64, and averages of surface air temperature and relative humidity were 0.76 °C (ranged from −39.90 to 31.50 °C) and 80.31%, respectively.
Applying the empirical model of global solar irradiance, hourly global irradiance was calculated for Sodankylä during 1 January 2000 to 31 December, 2018. The input data were observed hourly global and diffuse solar irradiance for S/G and water vapor pressure at the ground. Global solar irradiance in December was too low and not considered in the later analysis, and n decreased to 69,171. The calculated and observed hourly global solar irradiance varied similarly, and calculated values were larger than the observed by 18.11% for the average in 2000–2018. It is reasonable that the empirical model represents the global irradiance and its relationships with absorbing and scattering processes at relative clean atmospheric conditions (i.e., relative low S/G at 0.50 in 2008–2011 in the model development). The calculated and observed monthly global irradiance, diffuse irradiance and S/G are shown in Figure 1. Global solar irradiance in June or July was higher over clean atmospheric conditions, e.g., 2001 to 2003, 2007 and 2011 at low S/G (<0.60), but lower over high GLP loading, e.g., 2008, 2009 and 2017 at high S/G (>0.60). Scattering factor S/G was lower during April to September and higher in October to March.
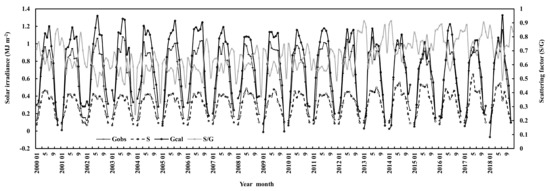
Figure 1. Monthly global solar irradiance calculated and observed (G), observed diffuse irradiance (S) and scattering factor (S/G) at Sodankylä.
During 19 years, the monthly averages of the calculated global irradiance decreased by 0.01% and diffuse irradiance increased by 0.11% per year, respectively. They were associated with the increases of S/G by 0.14% and water vapor by 0.06%. Air temperature and relative humidity increased by 0.83% (corresponding to 0.01 °C) and 0.23% for monthly average, respectively. On the average, the annual air temperature increased about 2.09 °C during 2000–2018, also indicating the Arctic warming [21].
Long term interannual variations were also investigated during 2000–2018 (Figure 2 and Figure 3). The calculated annual global solar irradiance decreased by 0.92% and diffuse irradiance increased by 1.28% per year, respectively. Both were associated with the increases of S/G by 1.73% and water vapor by 0.43% per year. Annual air temperature increased by 4.64% (corresponding to 0.07 °C), and relative humidity increased by 0.23% per year, respectively. The annual air temperature showed a higher correlation with water vapor (R = 0.79) than with relative humidity (R = 0.20). A good correlation was determined in annual water vapor pressure (E) and air temperature (T) and relative humidity (RH) as E = 0.293 × T + 0.024 × RH + 3.994 (R = 0.828, n = 19, α = 0.001).
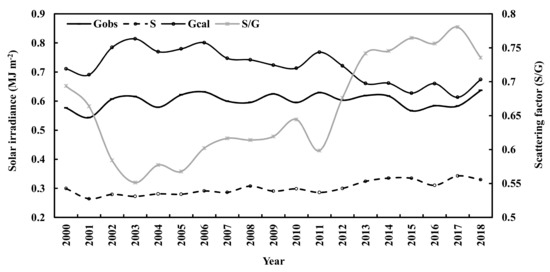
Figure 2. Annual global solar irradiance calculated and observed (G), observed diffuse irradiance (S) and scattering factor (S/G) at Sodankylä.
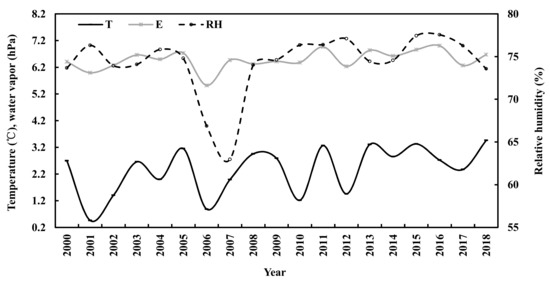
Figure 3. Annual air temperature (T), relative humidity (RH) and water vapor pressure (E) at Sodankylä.
Based on above as well as the following integrated results, the increase of air temperature is evidently associated with the increased GLPs, as well as water vapor. If the output of the Sun remains, solar global radiation at the ground would decrease and air temperature increase with the increase of atmospheric substances in the future.
3. The Losses of Global Solar Irradiance in the Atmosphere during 2000–2018
The global solar irradiance losses caused by absorbing and scattering GLPs (GLA and GLS) were calculated by using A1(1-e−kWm×cos(Z)) and A2(1-e−S/G), respectively. The total loss GL is GLA + GLS. The monthly losses due to absorption GLA dominated the total loss GL and showed clear seasonal variations, lower in April–September and higher in October–March, whereas GLS did not have evident seasonal variation and most peaks appeared in October–February. During January 2000 to December, 2018, (1) monthly GLA decreased slightly by 0.003%, associated with the increase of water vapor by 0.06%; (2) monthly GLS increased by 0.06%, associated with the increase of S/G by 0.14%; and (3) monthly GL increased by 0.02% (Figure 4).
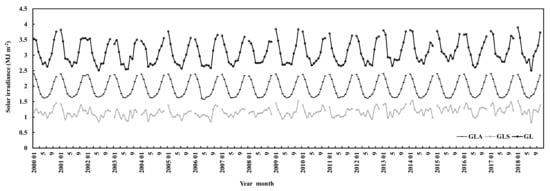
Figure 4. Monthly losses of global solar irradiance caused by absorbing and scattering substances (GLA, GLS) and total loss (GL = GLA + GLS) at Sodankylä.
For the annual losses of global solar irradiance during 2000–2018, GLA decreased by 0.02% per year, associating with the increase of E by 0.43%; GLS increased by 0.72% per year, associating with the increase of S/G by 1.73%; annual GL increased by 0.24% per year.
The contributions of monthly mean absorbing and scattering losses (RLA and RLS) to monthly mean total loss were 63.33% (ranged from 53.95 to 71.99%) and 36.67% (28.01–46.05%), respectively, during January 2000 to December 2018 (Figure 5), corresponding to the monthly averages of water vapor at 6.48 hPa (0.57–14.33) and S/G at 0.55 (0.30–0.94). Generally, RLA was lower in April–September and higher in October–March, whereas RLS varied inversely compared to RLA (i.e., most peaks appeared in October–February). The corresponding annual mean absorbing and scattering losses (RLA and RLS) to annual mean total loss were 63.32% (60.09–65.48%) and 36.68% (34.52–39.04%), respectively.
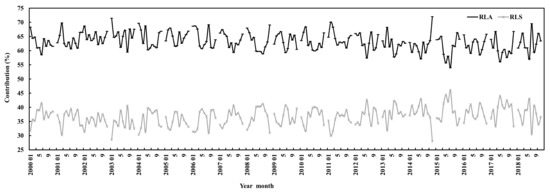
Figure 5. Contributions (RLA, RLS) of monthly absorbing and scattering losses to monthly total loss at Sodankylä.
During 2000–2018 at Sodankylä, the annual mean monthly loss of GLA, GLS and GL were 1.94 (1.57–2.41), 1.17 (0.82–1.53) and 3.11 (2.50–3.90) MJ m−2, corresponding to 539.82, 323.86 and 863.68 W m−2, respectively.
References
- Cao, Y.F.; Liang, S.L. Recent advances in driving mechanisms of the Arctic amplification: A review. Chin. Sci. Bull. 2018, 63, 2757–2771. (In Chinese)
- Cohen, J.; Screen, J.A.; Furtado, J.; Barlow, M.; Whittleston, D.; Coumou, D.; Francis, J.A.; Dethloff, K.; Entekhabi, D.; Overland, J.E.; et al. Recent Arctic amplification and extreme mid-latitude weather. Nat. Geosci. 2014, 7, 627–637.
- Liu, S.Y.; Wang, B.Y.; Xie, Y.X.; Hu, S.H.; Wang, Z.Y.; Yue, L.Y. The Variation Characteristics of Temperature in Barrow Alaska during 1925–2018. Clim. Chang. Res. Lett. 2019, 8, 769–774.
- Solanki, S.K. Solar variability and climate change: Is there a link. Astron. Geophys. 2002, 43, 5.
- Elminir, H.K. Relative influence of weather conditions and air pollutants on solar radiation—Part 2: Modification of solar radiation over urban and rural sites. Meteorol. Atmos. Phys. 2007, 96, 257–264.
- Lean, J.; Rind, D. Climate forcing by changing solar radiation. J. Clim. 1998, 11, 3069–3094.
- Andreae, M.O.; Ramanathan, V. Climate’s Dark Forcings. Sciences 2013, 340, 280–281.
- García, R.D.; Cuevas, E.; García, O.E.; Cachorro, V.E.; Pallé, P.; Bustos, J.J.; Romero-Campos, P.M.; de Frutos, A.M. Reconstruction of global solar radiation time series from 1933 to 2013 at the Izaña Atmospheric Observatory. Atmos. Meas. Tech. 2014, 7, 3139–3150.
- Rosenfeld, D.; Sherwood, S.; Wood, R.; Donner, L. Climate Effects of Aerosol-Cloud Interactions. Sciences 2014, 343, 379–380.
- Williamson, C.E.; Zepp, R.G.; Lucas, R.M.; Madronich, S.; Austin, A.T.; Ballaré, C.L.; Norval, M.; Sulzberger, B.; Bais, A.F.; McKenzie, R.L.; et al. Solar ultraviolet radiation in a changing climate. Nat. Clim. Chang. 2014, 4, 434–441.
- Calabrò, E.; Magazù, S. Correlation between Increases of the Annual Global Solar Radiation and the Ground Albedo Solar Radiation due to Desertification—A Possible Factor Contributing to Climatic Change. Climate 2016, 4, 64.
- Bai, J.H.; Zong, X.M. Global solar radiation transfer and its loss in the atmosphere. Appl. Sci. 2021, 11, 2651.
- Glover, J.; McCulloch, J.S.G. The empirical relation between solar radiation and hours of sunshine. Q. J. R. Meteorol. Soc. 1958, 84, 172–175.
- Zhang, J.; Zhao, L.; Deng, S.; Xu, W.; Zhang, Y. A critical review of the models used to estimate solar radiation. Renew. Sustain. Energy Rev. 2017, 70, 314–329.
- Gueymard, C.A. Critical analysis and performance assessment of clear sky solar irradiance models using theoretical and measured data. Sol. Energy 1993, 51, 121–138.
- Gueymard, C.A. Clear-sky solar irradiance predictions for large-scale applications using 18 radiative models: Improved validation methodology and detailed performance analysis. Sol. Energy 2012, 86, 2145–2169.
- Badescu, V.; Gueymard, C.A.; Cheval, S.; Oprea, C.; Baciu, M.; Dumitrescu, A.; Iacobescu, F.; Milos, I.; Rada, C. Accuracy analysis for fifty-four clear-sky solar radiation models using routine hourly global irradiance measurements in Romania. Renew. Energy 2013, 55, 85–103.
- Bayrakc, H.C.; Demircan, C.; Keceba, A. The development of empirical models for estimating global solar radiation on horizontal surface: A case study. Renew. Sustain. Energy Rev. 2018, 81, 2771–2782.
- Antonanzas-Torres, F.; Urraca, R.; Polo, J.; Perpinan-Lamigueiro, O.; Escobar, R. Clear sky solar irradiance models: A review of seventy models. Renew. Sustain. Energy Rev. 2019, 107, 374–387.
- Zang, H.; Cheng, L.; Ding, T.; Cheung, K.W.; Wang, M.; Wei, Z.; Sun, G. Estimation and validation of daily global solar radiation by day of the year-based models for different climates in China. Renew. Energy 2019, 135, 984–1003.
- Post, E.; Alley, R.B.; Christensen, T.R.; Macias-Fauria, M.; Forbes, B.; Gooseff, M.N.; Iler, A.; Kerby, J.T.; Laidre, K.L.; Mann, M.E.; et al. The polar regions in a 2 °C warmer world. Sci. Adv. 2019, 5, eaaw9883.
More
Information
Subjects:
Meteorology & Atmospheric Sciences
Contributor
MDPI registered users' name will be linked to their SciProfiles pages. To register with us, please refer to https://encyclopedia.pub/register
:
View Times:
2.9K
Entry Collection:
Environmental Sciences
Revisions:
4 times
(View History)
Update Date:
25 Nov 2021
Table of Contents


Notice
You are not a member of the advisory board for this topic. If you want to update advisory board member profile, please contact office@encyclopedia.pub.
OK
Confirm
Only members of the Encyclopedia advisory board for this topic are allowed to note entries. Would you like to become an advisory board member of the Encyclopedia?
Yes
No
${ textCharacter }/${ maxCharacter }
Submit
Cancel
Back
Comments
${ item }
|
${ item.createdUser.fullName }
${ item.createdAt }
${ item.vote }
${ item.reply }
Delete
${ reply.createdUser.fullName }
${ reply.createdAt }
${ reply.vote }
Delete
There is no reply to this comment~
${ item.replyTextCharacter }/${ item.replyMaxCharacter }
Submit
Cancel
More
No more~
There is no comment~
${ textCharacter }/${ maxCharacter }
Submit
Cancel
${ selectedItem.replyTextCharacter }/${ selectedItem.replyMaxCharacter }
Submit
Cancel
Confirm
Are you sure to Delete?
Yes
No