 +1 credit
| Version | Summary | Created by | Modification | Content Size | Created at | Operation |
|---|---|---|---|---|---|---|
| 1 | Hai Du | + 5299 word(s) | 5299 | 2020-03-26 09:28:17 | | | |
| 2 | Hai Du | Meta information modification | 5299 | 2020-04-02 14:31:43 | | | | |
| 3 | Rita Xu | -683 word(s) | 4616 | 2020-04-03 08:11:57 | | | | |
| 4 | Rita Xu | -34 word(s) | 4582 | 2020-10-29 10:19:21 | | | | |
| 5 | Rita Xu | -34 word(s) | 4582 | 2020-10-29 10:20:01 | | |
Video Upload Options
Phosphate (Pi) transporters play critical roles in Pi acquisition and homeostasis. However, currently little is known about these genes in oil crops. In this study, we aimed to characterize the five Pi transporter gene families (PHT1-5) in allotetraploid Brassica napus. We identified and characterized 81 putative PHT genes in B. napus (BnaPHTs), including 45 genes in PHT1 family (BnaPHT1s), four BnaPHT2s, 10 BnaPHT3s, 13 BnaPHT4s and nine BnaPHT5s. Phylogenetic analyses showed that the largest PHT1 family could be divided into two groups (Group I and II), while PHT4 may be classified into five, Groups I-V. Gene structure analysis revealed that the exon-intron pattern was conservative within the same family or group. The sequence characteristics of these five families were quite different, which may contribute to their functional divergence. Transcription factor (TF) binding network analyses identified many potential TF binding sites in the promoter regions of candidates, implying their possible regulating patterns. Collinearity analysis demonstrated that most BnaPHTs were derived from an allopolyploidization event (~40.7%) between Brassica rapa and Brassica oleracea ancestors, and small-scale segmental duplication events (~39.5%) in the descendant. RNA-Seq analyses proved that many BnaPHTs were preferentially expressed in leaf and flower tissues. The expression profiles of most colinearity-pairs in B. napus are highly correlated, implying functional redundancy, while a few pairs may have undergone neo-functionalization or sub-functionalization during evolution. The expression levels of many BnaPHTs tend to be up-regulated by diifferent hormones inductions, especially for IAA, ABA and 6-BA treatments. qRT-PCR assay demonstrated that six BnaPHT1s (BnaPHT1.11, BnaPHT1.14, BnaPHT1.20, BnaPHT1.35, BnaPHT1.41, BnaPHT1.44) were significantly up-regulated under low- and/or rich- Pi conditions in B. napus roots.
1. Identification of PHT Genes in B. napus
To identify the PHTs in the B. napus genome, a preliminary BLASTP search was performed using the sequences of known Arabidopsis PHT proteins (AtPHTs) as queries, based on the available B. napus genome database in GENOSCOPE (Darmor–bzh, http://www.genoscope.cns.fr/brassicanapus/) [1]. In each case, a large number of deduced PHT homologous sequences were acquired. The redundant sequences were firstly discarded from our dataset. Then the remaining sequences were verified by SMART (http://smart.embl-heidelberg.de/). The sequences possessing incomplete open reading frames (ORFs), especially long deletion were excluded from further analysis, such as BnaCnng51590D (Table S1). Finally, we obtained 81 typical PHT genes with relative complete ORFs in B. napus (BnaPHTs), and temporarily named them according to their order on the corresponding chromosomes (Table S1). To our knowledge, the candidate PHT genes in B. napus consist of the largest PHT family known to date [2][3][4][5]. This may attribute to B. napus (AACC. n=19) is an allotetraploid produced by the recent hybridization between B. rapa (AA. n=10) and B. oleracea (CC. n=9) about 7500 years ago.
Similarly, we also identified 46 candidate PHT homologs in Brassica rapa (BrPHTs) and 26 PHT homologs in Brassica oleracea (BoPHTs) from Phytozome v12 (https://phytozome.jgi.doe.gov/) by the same method (Table S2).
2. Phylogenetic Analysis of B. napus PHT Gene Family
To determine the evolutionary relationship of B. napus PHT gene families, we constructed a Neighbor-Joining (NJ) tree and a Maximum Likelihood (ML) trees of the candidate 165 PHT proteins from B. napus (80), Arabidopsis (22), B. rapa (42) and B. oleracea (21) based on the alignment of the full-length amino acid sequences using MEGA5.0 respectively. Five members (BnaPHT1.24, BrPHT1.25, BrPHT5.3, BoPHT1.4 and BoPHT1.5) were excluded from the phylogenetic trees because of technological reason (lacking common sites for the sequence pairs due to large sequence deletion).
The topologies and bootstrap support values of the NJ and ML trees were highly congruent (Figure 1 and Figure S1), and the candidate PHT members were clustered into five main clusters: PHT1-5 families (Figure 1). The PHT1 family is the largest one which includes nine genes in Arabidopsis (AtPHT1s), 25 in B. rapa (BrPHT1s), 8 B. oleracea (BoPHT1s) and 44 in B. napus (BnaPHT1s); the PHT2 family contained one AtPHT2 gene, two BrPHT2s, two BoPHT2s and four BnaPHT2s; the PHT3 family included three AtPHT3s, five BrPHT3s, four BoPHT3s and 10 BnaPHT3s; the PHT4 family was consisted of six AtPHT4s, seven BrPHT4s, six BoPHT4s and 13 BnaPHT4s; while the PHT5 family contained three AtPHT5s, three BrPHT5s, one BoPHT5 gene and nine BnaPHT5s (Figure 1). Consistent with previous studies [6], the PHT1 family could be further classified into two groups, where group I composed of 11 BnaPHT1s, seven BrPHT1s and five BoPHT1s that were homologous to AtPHT1.8 and AtPHT1.9; group II contained 33 BnaPHT1s, 18 BrPHT1s and three BoPHT1s that were homologous to AtPHT1.1-AtPHT1.7. Similarly, the PHT4 family might be classified into five groups (Group I-Ⅴ) (Figure 1), where group I contained nine Brassica members and AtPHT4.2 and AtPHT4.3; group II consisted of AtPHT4.5 and Brassica homologs; group III included AtPHT4.6 and four Brassica homologs; group IV composed of AtPHT4.1 and four Brassica homologs, and group Ⅴ included AtPHT4.4 and eight Brassica homologs.
Physicochemical property analysis showed that the molecular weight (MW) of candidate BnaPHT proteins (BnaPHTs) ranged from19.20-78.90 kDa, the isoelectric point (IP) is 5.44–10.01 (Table S1). The amino acid length of BnaPHTs varied from 279 to 704 aa, and these of PHT5 family are almost the longest while the PHT3 family are obviously shorter than the others. Subcellular localization analysis found that members of PHT1 and 4 families are located on the cell membrane, and members of PHT2 and 3 families are located on chloroplast and mitochondrion, respectively. In contrast, the majority of the PHT5 family are located on the cell membrane and vacuole except for one (BnaPHT5.2), which was located on the cell membrane and chloroplast. The diverse subcellular localization features (Table S1) of these five families were highly consistent with the functional diversity of their homologs in plants [6].
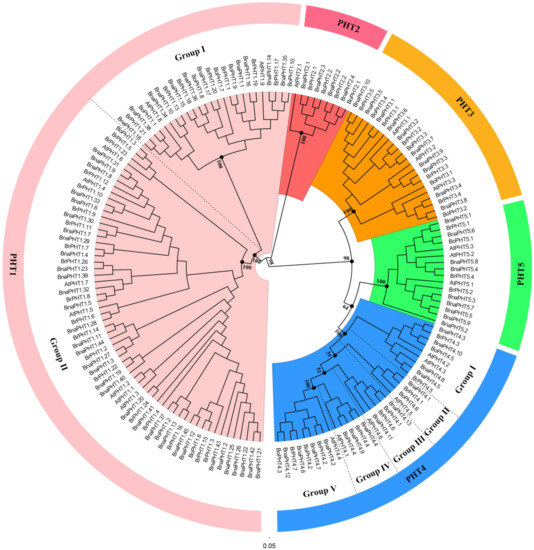
Figure 1. Phylogenetic analysis of phosphate transporter (PHT) gene families in Brassica napus, Arabidopsis, Brassica rapa and Brassica oleracea. The colored background indicates different PHT family. The different groups within the PHT1 and 4 families were separated by dashed lines, respectively.
3. Gene Structure of PHT Genes
To gain insight into the structural feature of PHTs in B. napus, Arabidopsis, B. rapa and B. oleracea, we compared their full-length cDNA and genomic DNA sequences to determine the insertion site and number of introns within each gene. The results of B. napus and Arabidopsis PHTs were viewed by GSDS software in Figure 2. The intron patterns of the five PHT families across these four species were presented in a schematic form in Figure S2, respectively.
As shown in Figure 2, the coding regions of most PHTs in B. napus and Arabidopsis are disrupted by introns varying from one to 14, except for 9 members in PHT1 family (Figure 2B). Among the five PHT families, the gene structures in PHT2, 3, and 5 families were highly conserved in terms of the exon-intron structure with only a few exceptions that may be attributed to low genome sequence quality, respectively (Figure 2B). The genes in PHT2 family possessed 2-3 introns, those in PHT3 family possessed 4-6 introns; and those in PHT5 family generally possessed 8-9 introns except for BnaPHT5.2, BrPHT5.2 and BrPHT5.3 (containing four or six introns). In contrast, the gene structures in PHT1 and 4 families were relatively less conserved. The PHTs in PHT1 family generally possessed 1-4 introns, where 21 members of the 54 PHT1s have one intron, 14 PHT1s contain two introns, ten PHT1s have three or four introns, respectively (Figure 2B). However, the gene structures were generally conserved in the same branch in PHT1 family that was consistent with their group classification in the phylogenetic tree, particularly the group I (Figure 2A), forming three conserved intron patterns across the four species investigated (Figure 2B). Similarly, the intron patterns of PHTs in PHT4 family could be summarized into -five conserved intron patterns (Figure 2B). Similar results were observed in B. rapa and B. oleracea PHTs (Figure S2). These results indicated that the gain and loss of introns likely occurred in these two families during evolution.
Taken together, our results showed that the exon-intron patterns were generally conserved in each family or group in these five PHT families across the four species, indicating that each pattern shares a common ancestor.
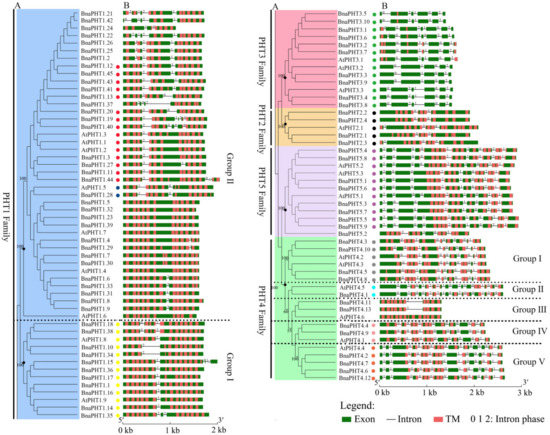
Figure 2. Gene structures of candidate PHT genes (PHTs) across different families. (A) Phylogenetic analysis of PHT families in B. napus and Arabidopsis. Colored background indicates genes belong to different families. The dashed lines represent the genes belong to different groups. (B) Gene structure of PHTs in B. napus (BnaPHTs) and Arabidopsis (AtPHTs). Exon was indicated by green boxes, transmembrane (TM) by red boxes, and the spaces between the colored boxes correspond to introns. Numbers 0, 1, 2 represent introns in phases 0, 1, and 2, respectively. The colored dots represent the conservative intron insertion patterns corresponding to the Figure S2, respectively.
4. Sequence Analysis of B. napus PHT Proteins
To analyze the sequence features of different PHT families in B. napus, we predicted the domains in the full-length protein sequences of the five PHT families using SMART software (Figure 3 and Table S3).
Our results showed that the protein structures of these five families were generally different. Among them, members of PHT1, 4 and 5 families display a similar domain architecture that they all contain the major facilitator superfamily (MFS-1, functions in transmembrane transport) and Sugar (and other) transporter (Sugar-tr, functions in transmembrane transport) domains. However, the sequence features of these two domains were not conservative among these three families with the MFS-1 and Sugar-tr domains are partial or even completely overlapped in these families. As shown in Figure 3, the MFS-1 domain (~400 aa) in PHT1 family is completely overlapped by the Sugar-tr domain (~480 aa) near the N-terminus. In contrast, the Sugar-tr domain is completely overlapped by the MFS-1 domain in PHT5 family (Figure 3). In addition, nearly all BnaPHT5s (except BnaPHT5.2) contained an additional highly conservative SYG1/Pho81/XPR1 (SPX, functions in phosphate transport) domain before the MFS-1 domain with a length of approximately 52 aa. In contrast, the MFS-1 and Sugar-tr domains are partial overlapped in PHT4 family. Furthermore, compared to PHT1 family, the MFS-1 domains were relatively highly conserved in both of PHT4 or PHT5 families, in contrast, the Sugar-tr domains were relatively poorly conserved in these two families. However, the sequence features of PHT2 and PHT3 were quite different from the PHT1, 4 and 5 families (Figure 3). The average lengths of the BnaPHT2s and BnaPHT3s were 584 aa and 337 aa, respectively. Moreover, the BnaPHT2s contained the highly conserved (PHO4, functions in inorganic phosphate transmembrane transport) domain near the C-terminus (approximately 400 aa in length), whereas the BnaPHT3s included two separated conservative Mitochondrial carrier (Mito-carr, substrate carrier proteins that are involved in energy transfer) domains at the N-terminus (about 90 aa for each domain).
The TMPRED software analyses showed that nearly all members of these five PHT families contained different numbers of transmembrane (TM) domains, suggesting this domain is important for their functions in plants. As shown in Figure 2B, all the BnaPHT1s contained 6-14 transmembrane (TM) domains; the BnaPHT2s contained 10-12 TM domains which are consistent with the previous report [7][8]; the BnaPHT4s and BnaPHT5s contained 8-14 and 11-13 TM domains, respectively; in addition, most of the BnaPHT3s possessed only 1-5 TM domains, but four members (BnaPHT3.3, BnaPHT3.4, BnaPHT3.8 and BnaPHT3.9) which belonged to the same branch with AtPHT3.2, and AtPHT3.2 lacked the TM domains. Because all the BnaPHT3s contained two mito-carr domains (including BnaPHT3.3, BnaPHT3.4, BnaPHT3.8 and BnaPHT3.9), the PHT3 family may rely on the mito-carr domain instead of the TM domain to function as Pi transporters. Furthermore, the sequence characteristics and spatial positions of the TM domains are generally conserved in each family or group. However, their locations were different across different families, such as those of BnaPHT5s were located at the C-terminal while those in BnaPHT1s were distributed in the full length ORF region.
Taken together, our results indicate that the sequence characteristics were conserved in each of the five PHT families or groups but were different across them, which may have contributed to functional divergence across different families.
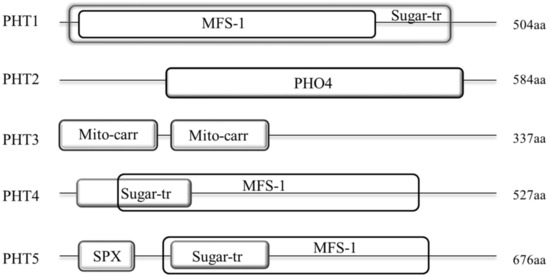
Figure 3. Architecture of conserved protein domains in the five PHT families in B. napus. The conserved domains by Simple modular architecture research tool (SMART) were represented by different size boxes. The average protein length of each family is indicated on the right.
5. Chromosomal Distribution and Duplication of BnaPHTs
To investigate the gene duplication events within B. napus PHT families, we analyzed the chromosomal locations and collinearity relationship of candidates based on the annotion information in Genoscope database.
Our results showed that the candidate BnaPHTs were distributed on all the 19 B. napus chromosomes, unevenly (Figure 4 and Table S1). The numbers of BnaPHTs between the two subgenomes are uneven, where the An-subgenome has 40 BnaPHTs while the Cn-subgenome possess 34 BnaPHTs. The genes distribution on each chromosome was bias, such as the A09 had a maximum number of nine genes, while A01 and A08 had a minimum of one gene. In addition, the chromosome information of seven genes was currently unknown (Table S1).
On the basis of the collinearity analyses between B. napus, B. rape and/or B. oleracea, we found that 65 of the 81 BnaPHTs have colinear relationships with BrPHTs, BoPHTs and/or BnaPHTs (Table S5). Of these, ~50.8% of the colinear genes were inherited from B. rapa (22 genes, ~33.8%) or B. oleracea (11 genes, ~17.0%) genomes. Given that B. napus is a new allotetraploid that was hybridized by B. rapa and B. oleracea about 7500 years ago, these results demonstrated that most of the BnaPHTs (33/81, ~40.7%) were derived from its parents through allopolyploidy. Moreover, up to ~18.5% BnaPHTs were demonstrated to be derived from the segmental exchange (SE) event; ~7.4 % genes were from the homologous exchange (HE) event; and ~7.4% genes were from the segmental duplication (SD) event (Table S5), indicating this family tend to undergo small-scale duplication events in B. napus genome. Furthermore, we found that all the five PHT families have the largest number of genes that are orthologous pairs between B. napus and B. rapa or B. oleracea, including 14 pairs in PHT1 family, three pairs in PHT2 family, six pairs in PHT3 family, and five pairs in both of PHT4 and 5 families (Table S5). There are three, three and two pairs of BnaPHT1s involved in HE, SE, and SD events respectively; one pair of PHT2-4 families in HE event respectively; one pair of PHT3-5 families in SE event respectively; and one pair of PHT3 family, and three pairs of PHT4 family in SD event respectively (Table S5). In addition, five pairs of tandem duplication (TD) genes (BnaPHT1.7/1.8, BnaPHT1.12/1.13, BnaPHT1.21/1.22, BnaPHT1.25/1.26, and BnaPHT1.30/1.31) were identified (~6.2%), according to their distributions on chromosomes and sequence similarity (Table S5).
Overall, our results demonstrated that allopolyploid (large-scale duplication event) and small-scale duplication events after genomic heterogeneous doubling (HE, SE, and SD) were the main driving force for the large expansion of PHT gene family in B. napus genome. However, the trends of small-scale duplication events in the five PHT families were different.
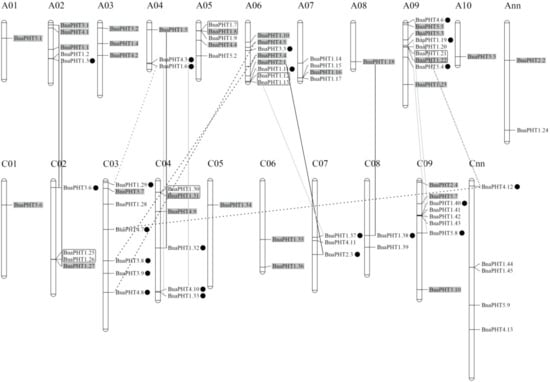
Figure 4. Distribution of PHT genes on B. napus chromosomes. The 81 BnaPHTs were mapped on the 19 chromosomes, except for seven genes. The Ann and Cnn chromosomes represent the chromosomal fragments mapped to An or Cn subgenome respectively, but the locations of these are as yet unclear. The genes in the gray background were originated from the whole genome duplication event (WGD). The black, gray and dashed lines represent the genes involved in homologous exchange (HE), segmental exchange (SE), and segmental duplication (SD) events with the new duplicated genes are marked in black dot, respectively. The genes in the black box represent tandem duplication (TD) pairs.
6. Transcription Factor Binding Network Analysis
Gene expression and even function is commonly regulated by many kinds of transcription factor genes (TFs). To explore the transcriptional regulating mechanism of BnaPHTs, we analyzed the putative TFs binding sites in their promoter regions (upstream 1500 bp) by PlantTFDB database, and constructed their TF-binding network using Cytoscape software (Figure 5).
In general, various putative TF binding sites were observed in the promoter regions of candidate BnaPHTs, belonging to 30 TF gene families (Table S4). The most enriched TFs belong to the ERF (Ethylene responsive element binding factors, 63 genes), WRKY (WRKY DNA-binding protein, 19 genes), NAC (NAM, ATAF, and CUC TFs, 17 genes), MADS-box (MCM1, AG, DEF, and SRF TFs, 13 members), MYB (myeloblastosis, 15 genes, including 12 R2R3-MYB and three MYB-related genes) and Dof (DNA binding with one finger, 12 genes) families (Figure 5 A). Moreover, many TFs are likely to bind to the same target gene, such as the 63 candidate ERF TFs may target to 21 BnaPHTs (Figure 5B). For example, many of the candidate WRKY TFs may bind to BnaPHT1.11 and BnaPHT1.44 genes promoters, suggesting these two BnaPHTs might be co-regulated by many WRKY TFs. Similarly, BnaPHT1.42 and BnaPHT4.7 were found to be the common targets of many ERF TFs, while many NAC TFs tend to target BnaPHT1.15 and BnaPHT5.4 (Figure 5B). In contrast, the Dof and MADS-box TFs are likely to target a much wider BnaPHTs, where the 13 MIKC-MADS-box TFs may regulate 27 BnaPHTs and the 12 Dof TFs may regulate 28 BnaPHTs (Figure 5B and Table S3). The remaining TF families only bind to a few BnaPHTs promoters as well, such as C3H TF may only bind to BnaPHT5.5 promoter, EIL TF may bind to BnaPHT1.41 promoter, while ZF-HD TF might bind to BnaPHT1.16 promoter (Figure 5).
To date, several TF families were reported to be involved in the transcriptional regulation of PHTs [9][10]. For example, the MYB-related gene PHR1 (phosphate starvation response), regulated PHT1 gene expression under low Pi condition through binding to the P1BS (PHR1-binding sequence) or P1BS-like domain; and the expressions of AtPHT1;1 and AtPHT1;4 genes were negatively regulated by MYB62 [9]. Accordingly, our results showed that many MYB homologs may bind to BnaPHTs promoters, suggesting their possible roles in Pi transport. It was previously reported that WRKY45 could positively regulate AtPHT1;1 expression under Pi starvation by binding to two W-boxes in its promoter [10]. Consequently, we found that 19 WRKY TFs may bind to BnaPHTs promoters, implying possible regulating roles of this kind of TFs in BnaPHTs expression.
Our results indicate that the expressions of BnaPHTs may be regulated by many types of TFs, especially the ERF, WRKY, MYB, Dof and MADS-box family members.
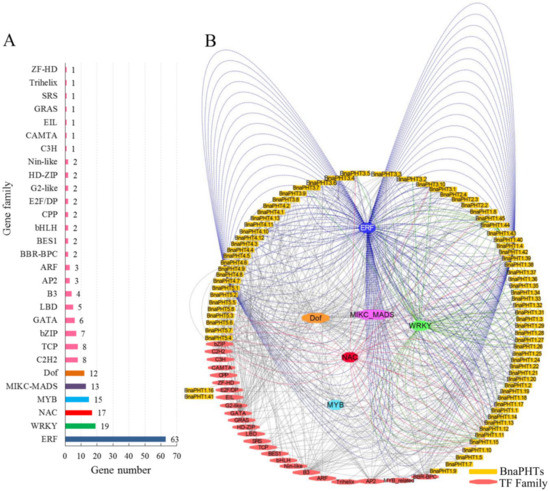
Figure 5. Transcription factor (TF) binding network of BnaPHTs. A: The TF gene families that may bind to the promoter regions of BnaPHTs; B: The TFs binding network of BnaPHTs based on the anlayses in PlantTFDB database.
7. Spatial and Temporal Expressions of BnaPHTs
Gene expression is related to its encoded protein function. So we inspected the expression patterns of the 81 candidate BnaPHTs in 50 B. napus tissues/organs across different developmental stages, based on the RNA-seq data in NCBI (BioProject ID PRJNA358784). Twenty-seven BnaPHTs of PHT1 family with no or weak (FPKM < 1) expression levels that might be pseudogenes or have spatially or temporally restricted expressional pattern, were excluded from the heatmap.
In general, the majority of BnaPHTs were partial to highly express in leaf and flower tissues (Figure 6), indicating a temporal and a spatial expression trend. Consistent with their diverse sequence characteristics, the expression profiles of BnaPHTs in PHT1, 3 and 4 families are relative divergent, which may explain their possible functional division in phosphorus transport process. For instance, the expression pattern of PHT1 family could be classified into three main categories: the first type is preferentially expressed in germination seeds (BnaPHT1.28, BnaPHT1.6 and BnaPHT1.33); the second type was highly expressed in radicle (BnaPHT1.20, BnaPHT1.41, BnaPHT1.14, BnaPHT1.35, BnaPHT1.11, BnaPHT1.44, BnaPHT1.38, BnaPHT1.29 and BnaPHT1.10); while the remaining are mainly expressed in leaf and flower tissues. The expression profiles of BnaPHT3s can also be divided in to three categories: the first category was expressed in germination seeds and cotyledons, the second was mainly expressed in silique pericarps, and the rest was highly expressed in flower tissues. The expression profiles of the BnaPHT3s could be related to their predicted mitochondrial localization according to all of them contained the mito-carr domain. Similarly, the expressions of BnaPHT4s can be divided into two major groups: the first one consists of five members (BnaPHT4.1, BnaPHT4.4, BnaPHT4.9, BnaPHT4.2 and BnaPHT4.7) that were highly expressed in leaf and flower tissues, while the second has relatively wider expression levels in the tissues investigated. In contrast, the expression profiles of the other two families are more conserved than the above three ones (Figure 6). In PHT2 family, the expressions of candidates are very similar and are highly expressed in leaf and flower tissues. Combined with their subcellular location analysis results, we predicted that they maybe affect Pi allocation at chloroplast. Similarly, the BnaPHT5s were mainly expressed in leaf, flower and silique pericarps tissues, and some members were also highly expressed in seed and embryo tissues. The expression patterns together with their subcellular location analysis suggested that the BnaPHT5s may function in Pi storage in many tissues.
In general, most of the BnaPHTs tend to be expressed in leaf and flower tissues. Moreover, the expression patterns within each family or group are similar, implying their functional conservation.
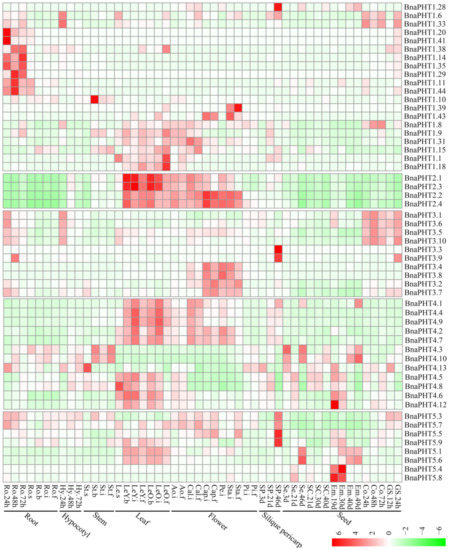
Figure 6. Expression pattern of BnaPHTs in 50 tissues during plant development. Ro = root, St = stem, Le = leaf, Sp = silique pericarp, Sc = seed coat, Em = embryo, Ao = anthocaulus, Se = seed, Hy = hypocotyl, GS =germination seeds, Cap = capillament, Pi = pistil, Cal = calyx, Co = cotyledon, Pe = petal. The “h”, “d”, “i”, “f”, “s” indicate hour, day, seeding, budding, initial flowering, and full-bloom stages, respectively. The BnaPHTs with no or weak expression levels (FPKM < 1) were removed from the heatmap. The color bar at the low right represents log2 expression value (FPKM ≥ 1): green represents low expression, and red represents high expression.
8. Expression Analysis of BnaPHTs under Five Hormone Inductions
Plant hormones participate in the regulation of diverse plant processes. For instance, auxin is a key regulator for virtually every aspect of plant growth and development [11]; Gibberellin (GA) is a bioactive growth regulator which controls seed germination, stem elongation, flowering [12]; 6-Benzylaminopurine (6-BA) could stimulate cell division or cytokinesis [13]. Moreover, phytohormones are also known to be associated with nutrient signaling [14]. Therefore, we explored the expression patterns of BnaPHTs under five exogenous hormone treatments (IAA, ACC, ABA, GA3, and 6-BA) in B. napus roots, based on our RNA-Seq dataset (BioProject ID PRJNA608211). Forty-four BnaPHTs with no or weak expression levels (FPKM < 1) were excluded from the heatmap.
As mentioned above, the expressions of most BnaPHTs were generally low in roots (Figure 6). However, the expressions of many genes in roots were induced by the five hormone treatments (Figure 7). Among the five PHT families, the BnaPHT1s (e.g., BnaPHT1.1, BnaPHT1.6, BnaPHT1.9, and BnaPHT1.31) were evidently up-regulated by ABA treatment; the BnaPHT2s (BnaPHT2.1-BnaPHT2.4) were up-regulated by all the five hormone treatments, especially IAA; the BnaPHT3s (BnaPHT3.1-BnaPHT3.8, and BnaPHT3.10) were up-regulated by IAA, ABA, GA3 and/or 6-BA treatments; whereas the genes in PHT5 family (BnaPHT5.1, BnaPHT5.3, BnaPHT5.5- BnaPHT5.7, and BnaPHT5.9) were evidently up-regulated by IAA and/or ABA treatments (Figure 7). Morevoer, the expressions of homologs in a same family are generally similar, such as BnaPHT1.1, BnaPHT1.9 and BnaPHT1.31 having similar expression patterns under ABA treatment; and BnaPHT2.1-BnaPHT2.4 having similar expression patterns under each of the five hormone inductions (Figure 7). These results suggest that the functions of PHTs in the same gene family are relative conserved. Notably, the expression patterns of BnaPHT4s were divided into two main patterns: the first type (BnaPHT4.1, BnaPHT4.2, BnaPHT4.4, BnaPHT4.7 and BnaPHT4.9) was obviously up-regulated by IAA treatment, while another was up-regulated by IAA, ABA, GA3 and/or 6-BA treatments under different trends. This suggests possibility functional divergence in the PHT4 family.
Previous reports have proven that the expressions of PHTs by hormone-induction are similar to that by Pi stress, suggesting there is a linkage between hormone treatment and Pi starvation [15][16][17]. For instance, in rice, OsPHT1;8 is involved in the cross-talk between Pi and auxin signaling, providing an evidence for the linkage between hormone and -Pi response [18]. Similarly, we found that the expressions of four BnaPHT1s (BnaPHT1.6, BnaPHT1.9, BnaPHT1.31 and BnaPHT1.33) which were up-regulated under Pi deficiency [19], were also up-regulated by IAA treatment (Figure 7). This implies a linkage between IAA treatment and Pi starvation. Moreover, cytokinin has been shown to be involved in the suppression of Pi starvation-induced gene expression [20]. Consistently, our results showed that the expressions of most BnaPHT1s were suppressed by 6-BA treatment (Figure 7), indicating similar mechanism may exist in B. napus.
In summary, our results demonstrate that exogenous hormones could strongly induce the expressions of many BnaPHTs in B. napus roots (especially IAA and ABA), indicating that hormones have an important role in their actions. Further research is required to elucidate their precise roles in hormone and −Pi signaling.
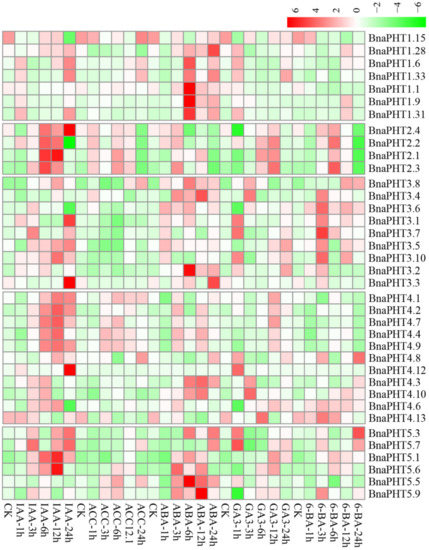
Figure 7. Expression profiles of BnaPHTs under five hormone inductions in B. napus seedling roots by RNA-seq. CK: no extra hormone inductions (0 h), IAA: indoleacetic acid, ACC: 1-amino cyclopropanecarboxylic acid, ABA: abscisic acid, GA3: gibberellin acid 3, 6-BA: cytokinin. The “1 h”, “3 h”, “6 h”, “12 h”, and “24 h” represent hours after treatment. The color bar in the upper right represents log2 expression values (FPKM ≥ 1): green represents low expression and red represents high expression.
9. Expression Analysis of BnaPHTs in Response to High-Pi and Low-Pi Conditions by qRT-PCR
The transcription levels of PHTs are generally responsive to Pi levels. Among the five PHT families, members of PHT1 family are high-affinity Pi transporters in plants [2][21][22][23] and are up-regulated under Pi deprivation conditions [24][25]. On the basis of our spatiotemporal expression analysis (Figure 6) and the known functions of Arabidopsis homologs, three homologous pairs (BnaPHT1.20/BnaPHT1.41, BnaPHT1.11/BnaPHT1.44 and BnaPHT1.14/BnaPHT1.35) which were highly expressed in roots were selected for further qRT-PCR assay to explore their potential roles in response to low Pi (1 μM, −Pi) and high Pi (2 mM, +Pi) conditions in B. napus seedling roots.
As shown in Figure 8, all of the six genes were strongly up-regulated under −Pi condition, but were relatively less induced by +Pi stress (except for BnaPHT1.41), indicating they were more sensitive to −Pi condition. The expression patterns of these genes can be classified into three patterns: BnaPHT1.41 and BnaPHT1.11 were strongly up-regulated under both of −Pi and +Pi conditions; the two homologs of AtPHT1.9, BnaPHT1.14 and BnaPHT1.35 were up-regulated by -Pi stress while were slightly up-regulated under +Pi condition; and BnaPHT1.20 and BnaPHT1.44 were strongly up-regulated under -Pi condition but were not induced by +Pi stress. Notably, as a sister pair, the expression profiles of BnaPHT1.11 and BnaPHT1.44 under −Pi and +Pi conditions were somewhat different, where the expression of BnaPHT1.11 was gradually increased under −Pi treatment (except for on the fifth day), while BnaPHT1.44 had the highest expression level on the third day under −Pi condition (Figure 8). This indicates functional divergence trend of sister pair genes during evolution.
Overall, our results demonstrated that the six BnaPHTs in PHT1 family may involve in −Pi stress response in B. napus seedling roots, which provided a fundament for further gene functional research.
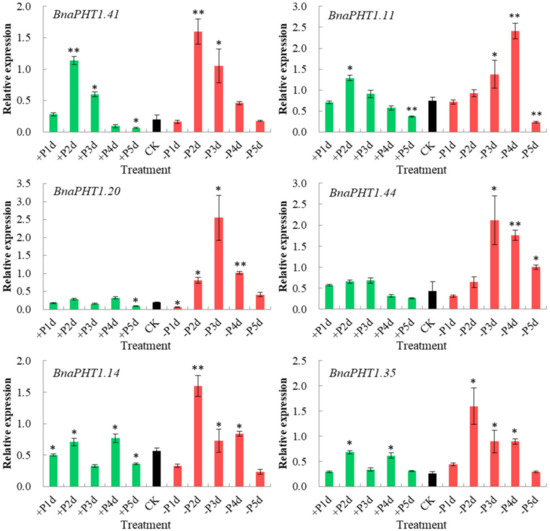
Figure 8. Expressions of six BnaPHT1s under low- or high- Pi treatments by qRT-PCR. The transcript levels were determined in B. napus seedling roots by qRT-PCR method under low (-Pi) or high Pi (+Pi) conditions. CK: normal Pi condition; +P1d~+P5d: +Pi condition on 1-5 day (s); -P1d~-P5d: -Pi condition on 1~5 day (s). The B. napus Actin7 (BnActin7) (GenBank accession no. AF024716) was used as the reference gene. The red bar represents the expressions of BnaPHTs under -Pi conditions; the green bar represents the expressions of BnaPHTs under +Pi conditions; and the black bar represents the expressions of BnaPHTs under normal Pi conditions (CK). Error bars indicate the standard deviation of three independent experiments. *: Significant difference (0.05 > p > 0.01); **: Extremely significant difference (p < 0.01).
References
- Plos Genetics Staff; The Plos Genetics Staff; Correction: Fungal Infection Induces Sex-Specific Transcriptional Changes and Alters Sexual Dimorphism in the Dioecious Plant Silene latifolia.. PLOS Genetics 2015, 11, e1005662, 10.1371/journal.pgen.1005662.
- Stephen R. Mudge; Anne L. Rae; Eugene Diatloff; Frank W. Smith; Expression analysis suggests novel roles for members of the Pht1 family of phosphate transporters in Arabidopsis.. The Plant Journal 2002, 31, 341-353, 10.1046/j.1365-313X.2002.01356.x.
- Fang Liu; Xiao-Jian Chang; Ying Ye; Weibo Xie; Ping Wu; Xingming Lian; Comprehensive Sequence and Whole-Life-Cycle Expression Profile Analysis of the Phosphate Transporter Gene Family in Rice. Molecular Plant 2011, 4, 1105-1122, 10.1093/mp/ssr058.
- Chunxia Zhang; Sen Meng; Mingjun Li; Zhong Zhao; Genomic Identification and Expression Analysis of the Phosphate Transporter Gene Family in Poplar. Frontiers in Plant Science 2016, 7, 798, 10.3389/fpls.2016.01398.
- Tingting Sun; Mingjun Li; Yun Shao; Lingyan Yu; Fengwang Ma; Comprehensive Genomic Identification and Expression Analysis of the Phosphate Transporter (PHT) Gene Family in Apple. Frontiers in Plant Science 2017, 8, 225, 10.3389/fpls.2017.00426.
- Duoliya Wang; Sulian Lv; Ping Jiang; Yinxin Li; Roles, Regulation, and Agricultural Application of Plant Phosphate Transporters. Frontiers in Plant Science 2017, 8, , 10.3389/fpls.2017.00817.
- R. A. Narang; Analysis of Phosphate Acquisition Efficiency in Different Arabidopsis Accessions. Plant Physiology 2000, 124, 1786-1799, 10.1104/pp.124.4.1786.
- Pierre Daram; Silvia Brunner; Christine Rausch; Cyrill Steiner; Nikolaus Amrhein; Marcel Bucher; Pht2;1 Encodes a Low-Affinity Phosphate Transporter from Arabidopsis. The Plant Cell 1999, 11, 2153, 10.2307/3871016.
- Ballachanda N. Devaiah; Ramaiah Madhuvanthi; Athikkattuvalasu S. Karthikeyan; Kashchandra G. Raghothama; Phosphate Starvation Responses and Gibberellic Acid Biosynthesis Are Regulated by the MYB62 Transcription Factor in Arabidopsis. Molecular Plant 2008, 2, 43-58, 10.1093/mp/ssn081.
- Hui Wang; Qian Xu; You-Han Kong; Yun Chen; Jun-Ye Duan; Wei-Hua Wu; Yi-Fang Chen; Arabidopsis WRKY45 transcription factor activates PHOSPHATE TRANSPORTER1;1 expression in response to phosphate starvation.. Plant Physiology 2014, 164, 2020-9, 10.1104/pp.113.235077.
- Karin Ljung; Auxin metabolism and homeostasis during plant development. Development 2013, 140, 943-950, 10.1242/dev.086363.
- Peter Hedden; Gibberellin Metabolism and Its Regulation. Journal of Plant Growth Regulation 2001, 20, 317-318, 10.1007/s003440010039.
- Y Deng; L Zhao; L Zhang; [Effects of sand and hormone treatment on seed germination of Bupleurum chinese DC. and B. falcatum L].. China Journal of Chinese Materia Medica 1996, 21, , null.
- Ngwon Baek; Hyun Jin Chun; Dae-Jin Yun; Min Chul Kim; Cross-talk between Phosphate Starvation and Other Environmental Stress Signaling Pathways in Plants. Molecules and Cells 2017, 40, 697-705, 10.14348/molcells.2017.0192.
- T. R. Bates; J. P. Lynch; Stimulation of root hair elongation in Arabidopsis thaliana by low phosphorus availability. Plant, Cell & Environment 1996, 19, 529-538, 10.1111/j.1365-3040.1996.tb00386.x.
- Jonathan Lynch; Kathleen M Brown; Ethylene and plant responses to nutritional stress. Physiologia Plantarum 1997, 100, 613-619, 10.1034/j.1399-3054.1997.1000324.x.
- Glena A. Gilbert; J. Diane Knight; Deborah L. Allan; Carroll P. Vance; Proteoid Root Development of Phosphorus Deficient Lupin is Mimicked by Auxin and Phosphonate. Annals Of Botany 2000, 85, 921-928, 10.1006/anbo.2000.1133.
- Hongfang Jia; Yongxia Yang; Huifang Shao; Songtao Zhang; Lizhi Wang; Hong Cui; Guohua Xu; OsPht1;8, a phosphate transporter, is involved in auxin and phosphate starvation response in rice. Journal of Experimental Botany 2017, 68, 5057-5068, 10.1093/jxb/erx317.
- Yu Li; Xue Wang; Hao Zhang; Sheliang Wang; Xiangsheng Ye; Lei Shi; Fangsen Xu; Guangda Ding; Molecular identification of the phosphate transporter family 1 (PHT1) genes and their expression profiles in response to phosphorus deprivation and other abiotic stresses in Brassica napus.. PLOS ONE 2019, 14, e0220374, 10.1371/journal.pone.0220374.
- Martin, A.C.; del Pozo, J.C.; Iglesias, J.; Rubio, V.; Solano, R.; de la Pena, A.; Leyva, A.; Paz-Ares, J. Influence of cytokininson the expression of phosphate starvation responsive genes in Arabidopsis. Plant J. 2000, 24, 559–567.
- Heungsop Shin; Hwa-Soo Shin; Gary R. Dewbre; Maria J. Harrison; Phosphate transport inArabidopsis: Pht1;1 and Pht1;4 play a major role in phosphate acquisition from both low- and high-phosphate environments. The Plant Journal 2004, 39, 629-642, 10.1111/j.1365-313x.2004.02161.x.
- Shubin Sun; Mian Gu; Yue Cao; Xinpeng Huang; Xiao Zhang; Penghui Ai; Jianning Zhao; Xiaorong Fan; Guohua Xu; A constitutive expressed phosphate transporter, OsPht1;1, modulates phosphate uptake and translocation in phosphate-replete rice.. Plant Physiology 2012, 159, 1571-81, 10.1104/pp.112.196345.
- Estelle Remy; T. R. Cabrito; Rita A Batista; Miguel C Teixeira; Isabel Sá-Correia; Paula Duque; The Pht1;9 and Pht1;8 transporters mediate inorganic phosphate acquisition by the Arabidopsis thaliana root during phosphorus starvation. New Phytologist 2012, 195, 356-371, 10.1111/j.1469-8137.2012.04167.x.
- Daniel P. Schachtman; Ryoung Shin; Nutrient Sensing and Signaling: NPKS. Annual Review of Plant Biology 2007, 58, 47-69, 10.1146/annurev.arplant.58.032806.103750.
- Sally E. Smith; Iver Jakobsen; Mette Grønlund; F. Andrew Smith; Roles of Arbuscular Mycorrhizas in Plant Phosphorus Nutrition: Interactions between Pathways of Phosphorus Uptake in Arbuscular Mycorrhizal Roots Have Important Implications for Understanding and Manipulating Plant Phosphorus Acquisition1. Plant Physiology 2011, 156, 1050-1057, 10.1104/pp.111.174581.


