 +1 credit
| Version | Summary | Created by | Modification | Content Size | Created at | Operation |
|---|---|---|---|---|---|---|
| 1 | Axel Loewe | + 3161 word(s) | 3161 | 2021-08-05 10:29:23 | | | |
| 2 | Rita Xu | -24 word(s) | 3137 | 2021-08-25 04:05:41 | | | | |
| 3 | Rita Xu | Meta information modification | 3137 | 2021-08-25 08:31:51 | | |
Video Upload Options
Computer modeling of the electrophysiology of the heart has undergone significant progress. A healthy heart can be modeled starting from the ion channels via the spread of a depolarization wave on a realistic geometry of the human heart up to the potentials on the body surface and the ECG.
1. Introduction
| Topic | Modeling Challenge | References |
|---|---|---|
| healthy heart—QRS | modeling the Purkinje tree | [1][2][3][4][5][6][7][8][9] |
| healthy heart—T-wave | modeling heterogeneity of repolarization | [10][11][12][13] |
| healthy heart—P-wave | modeling sinus node excitation and pathways from right to left atrium, anatomical variability | [14][15][16][17][18][19][20][21][22] |
| ischemia and infarction | modeling the effect of hyperkalemia, acidosis, hypoxia and cell-to-cell uncoupling | [23][24][25][26][27][28][29][30] |
| ventricular ectopic beats | localization with 12-lead ECG | [31][32][33][34] |
| ventricular tachycardia | localization of exit points with 12-lead ECG | [29][35] |
| cardiomyopathy | modeling typical changes of QRS- and T-wave | [36] |
| bundle branch blocks LBBB and RBBB | modeling asynchrony | [37][38][39][40] |
| atrial ectopic beats | localization with 12-lead ECG | [32][33][34] |
| atrial tachycardia, flutter | modeling all types of flutter | [20][41][42][43][44][45][46] |
| atrial fibrillation and fibrosis | modeling fibrosis and its distribution | [47][48][49][50][51] |
| genetic diseases | modeling LQT, SQT, Brugada | [52][53][54] |
| imbalance of electrolytes | hyper- and hypokalemia and hyper- and hypocalcemia | [13][55][56][57][58][59][60] |
| drug-induced changes | effect of various channel blockers | [61][62][63] |
2. Modeling the ECG of a Healthy Heart
2.1. The QRS Complex and the Purkinje Tree
2.2. The T-Wave and the Repolarization
repolarization current (transmural, apico-basal, left–right) and found that both transmural and apico-basal gradients can lead to realistic T-waves, whereas a pure left–right heterogeneity creates a notch in the T-wave [11]. Even though the focus of an article of Bukhari et al. was on the changes in the T-wave during dialysis, this article also reported on the heterogeneity that is needed to obtain a realistic T-wave in healthy hearts. They assume a solely transmural dispersion of ion channel conductivities [13]. Xue et al. analyzed how transmural and apico-basal heterogeneities change the morphology of the T-wave. They concluded that mainly apico-basal gradients contribute to a positive T-Wave [10]. The modeled heterogeneity scenarios are informed by experimental cellular data [82]. However, the available data do not allow us to draw definite conclusions and different heterogeneity patterns can lead to the similar T-wave morphologies.
2.3. The P-Wave
2.4. Modeling Rhythmic Features and Heart Rate Variability
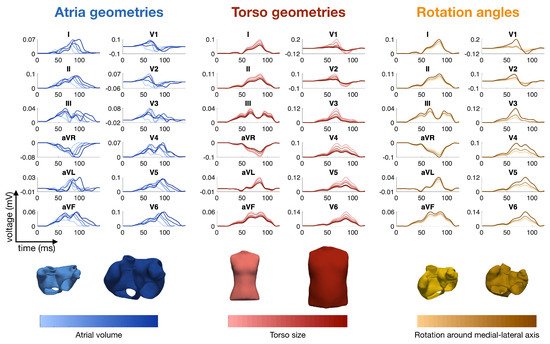
2.5. Modeling Inter- and Intra-Patient Variability
3. Modeling Diseases and the Corresponding ECG
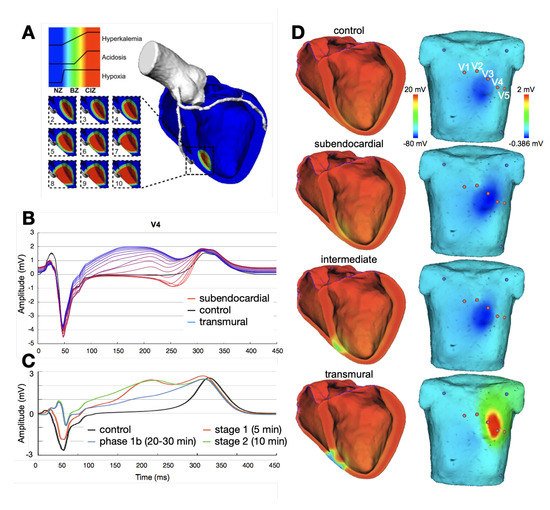
3.1. Ischemia and Infarction
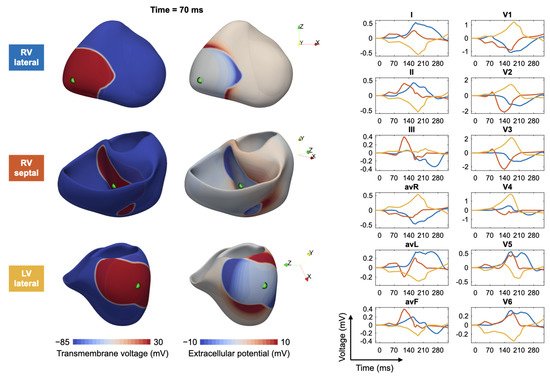
3.2. Ventricular Ectopic Beats and Extrasystoles
References
- Keller, D.U.J.; Kalayciyan, R.; Dössel, O.; Seemann, G. Fast creation of endocardial stimulation profiles for the realistic simulation of body surface ECGs. In Proceedings of the IFMBE World Congress on Medical Physics and Biomedical Engineering, Munich, Germany, 7–12 September 2009; Volume 25/4, pp. 145–148.
- Vigmond, E.J.; Stuyvers, B.D. Modeling our understanding of the His-Purkinje system. Prog. Biophys. Mol. Biol. 2016, 120, 179–188.
- Cardone-Noott, L.; Bueno-Orovio, A.; Mincholé, A.; Zemzemi, N.; Rodriguez, B. Human ventricular activation sequence and the simulation of the electrocardiographic QRS complex and its variability in healthy and intraventricular block conditions. EP Eur. 2016, 18, iv4–iv15.
- Kahlmann, W.; Poremba, E.; Potyagaylo, D.; Dössel, O.; Loewe, A. Modelling of patient-specific Purkinje activation based on measured ECGs. Curr. Dir. Biomed. Eng. 2017, 3, 171–174.
- Cranford, J.P.; O’Hara, T.J.; Villongco, C.T.; Hafez, O.M.; Blake, R.C.; Loscalzo, J.; Fattebert, J.L.; Richards, D.F.; Zhang, X.; Glosli, J.N.; et al. Efficient Computational Modeling of Human Ventricular Activation and Its Electrocardiographic Representation: A Sensitivity Study. Cardiovasc. Eng. Technol. 2018, 9, 447–467.
- Mincholé, A.; Zacur, E.; Ariga, R.; Grau, V.; Rodriguez, B. MRI-Based Computational Torso/Biventricular Multiscale Models to Investigate the Impact of Anatomical Variability on the ECG QRS Complex. Front. Physiol. 2019, 10, 1103.
- Pezzuto, S.; Prinzen, F.W.; Potse, M.; Maffessanti, F.; Regoli, F.; Caputo, M.L.; Conte, G.; Krause, R.; Auricchio, A. Reconstruction of three-dimensional biventricular activation based on the 12-lead electrocardiogram via patient-specific modelling. EP Eur. 2021, 23, 640–647.
- Gillette, K.; Gsell, M.A.; Prassl, A.J.; Karabelas, E.; Reiter, U.; Reiter, G.; Grandits, T.; Peyer, C.; Štern, D.; Urschler, M.; et al. A Framework for the Generation of Digital Twins of Cardiac Electrophysiology from Clinical 12-leads ECGs. Med. Image Anal. 2021, 71, 102080.
- Grandits, T.; Effland, A.; Pock, T.; Krause, R.; Plank, G.; Pezzuto, S. GEASI: Geodesic-based Earliest Activation Sites Identification in cardiac models. arXiv 2021, arXiv:2102.09962v1.
- Xue, J.; Chen, Y.; Han, X.; Gao, W. Electrocardiographic morphology changes with different type of repolarization dispersions. J. Electrocardiol. 2010, 43, 553–559.
- Keller, D.U.J.; Weiss, D.L.; Dossel, O.; Seemann, G. Influence of I(Ks) heterogeneities on the genesis of the T-wave: A computational evaluation. IEEE Trans. Biomed. Eng. 2012, 59, 311–322.
- Moss, R.; Moritz Wülfers, E.; Seemann, G. T-Wave Changes Due to Cardiac Deformation Are Dependent on the Temporal Relationship Between Repolarization and Diastolic Phase. Comput. Cardiol. 2018, 45, 1–4.
- Bukhari, H.A.; Palmieri, F.; Ramirez, J.; Laguna, P.; Ruiz, J.E.; Ferreira, D.; Potse, M.; Sanchez, C.; Pueyo, E. Characterization of T Wave Amplitude, Duration and Morphology Changes During Hemodialysis: Relationship with Serum Electrolyte Levels and Heart Rate. IEEE Trans. Biomed. Eng. 2020, 1, ahead of print.
- Krueger, M.W.; Schmidt, V.; Tobón, C.; Weber, F.M.; Lorenz, C.; Keller, D.U.J.; Barschdorf, H.; Burdumy, M.; Neher, P.; Plank, G.; et al. Modeling atrial fiber orientation in patient-specific geometries: A semi-automatic rule-based approach. In Functional Imaging and Modeling of the Heart 2011; Lecture Notes in Computer Science; Axel, L., Metaxas, D., Eds.; Springer: Berlin/Heidelberg, Germany, 2011; Volume 6666, pp. 223–232.
- Dössel, O.; Krueger, M.W.; Weber, F.M.; Wilhelms, M.; Seemann, G. Computational modeling of the human atrial anatomy and electrophysiology. Med. Biol. Eng. Comput. 2012, 50, 773–799.
- Krueger, M.W.; Dorn, A.; Keller, D.U.J.; Holmqvist, F.; Carlson, J.; Platonov, P.G.; Rhode, K.S.; Razavi, R.; Seemann, G.; Dössel, O. In-silico modeling of atrial repolarization in normal and atrial fibrillation remodeled state. Med. Biol. Eng. Comput. 2013, 51, 1105–1119.
- Loewe, A.; Krueger, M.W.; Platonov, P.G.; Holmqvist, F.; Dössel, O.; Seemann, G. Left and Right Atrial Contribution to the P-wave in Realistic Computational Models. In Lecture Notes in Computer Science; Springer: Berlin/Heidelberg, Germany, 2015; Volume 9126, pp. 439–447.
- Jacquemet, V. Modeling left and right atrial contributions to the ECG: A dipole-current source approach. Comput. Biol. Med. 2015, 65, 192–199.
- Potse, M.; Lankveld, T.A.R.; Zeemering, S.; Dagnelie, P.C.; Stehouwer, C.D.A.; Henry, R.M.; Linnenbank, A.C.; Kuijpers, N.H.L.; Schotten, U. P-wave complexity in normal subjects and computer models. J. Electrocardiol. 2016, 49, 545–553.
- Loewe, A.; Krueger, M.W.; Holmqvist, F.; Dössel, O.; Seemann, G.; Platonov, P.G. Influence of the earliest right atrial activation site and its proximity to interatrial connections on P-wave morphology. EP Eur. 2016, 18, iv35–iv43.
- Andlauer, R.; Seemann, G.; Baron, L.; Dössel, O.; Kohl, P.; Platonov, P.; Loewe, A. Influence of left atrial size on P-wave morphology: Differential effects of dilation and hypertrophy. EP Eur. 2018, 20, iii36–iii44.
- Nagel, C.; Schuler, S.; Dössel, O.; Loewe, A. A bi-atrial statistical shape model for large-scale in silico studies of human atria: Model development and application to ECG simulations. arXiv 2021, arXiv:2102.10838.
- Farina, D.; Dössel, O. Model-based approach to the localization of infarction. Comput. Cardiol. 2007, 34, 173–176.
- Jiang, Y.; Qian, C.; Hanna, R.; Farina, D.; Dössel, O. Optimization of the electrode positions of multichannel ECG for the reconstruction of ischemic areas by solving the inverse electrocardiographic problem. Int. J. Bioelectromagn. 2009, 11, 27–37.
- Wilhelms, M.; Dössel, O.; Seemann, G. Comparing Simulated Electrocardiograms of Different Stages of Acute Cardiac Ischemia. In Proceedings of the International Conference on Functional Imaging and Modeling of the Hear, LNCS, New York, NY, USA, 25–27 May 2011; Volume 6666, pp. 11–19.
- Wilhelms, M.; Dössel, O.; Seemann, G. In silico investigation of electrically silent acute cardiac ischemia in the human ventricles. IEEE Trans. Biomed. Eng. 2011, 58, 2961–2964.
- Loewe, A.; Schulze, W.H.W.; Jiang, Y.; Wilhelms, M.; Luik, A.; Dössel, O.; Seemann, G. ECG-Based Detection of Early Myocardial Ischemia in a Computational Model: Impact of Additional Electrodes, Optimal Placement, and a New Feature for ST Deviation. BioMed Res. Int. Artic. 2014, 2015, 530352.
- Loewe, A.; Wülfers, E.M.; Seemann, G. Cardiac ischemia-insights from computational models. Herzschrittmachertherapie Elektrophysiologie 2018, 29, 48–56.
- Lopez-Perez, A.; Sebastian, R.; Izquierdo, M.; Ruiz, R.; Bishop, M.; Ferrero, J.M. Personalized Cardiac Computational Models: From Clinical Data to Simulation of Infarct-Related Ventricular Tachycardia. Front. Physiol. 2019, 10, 580.
- Ledezma, C.A.; Zhou, X.; Rodríguez, B.; Tan, P.J.; Díaz-Zuccarini, V. A modeling and machine learning approach to ECG feature engineering for the detection of ischemia using pseudo-ECG. PLoS ONE 2019, 14, e0220294.
- Potyagaylo, D.; Chmelevsky, M.; van Dam, P.; Budanova, M.; Zubarev, S.; Treshkur, T.; Lebedev, D. ECG Adapted Fastest Route Algorithm to Localize the Ectopic Excitation Origin in CRT Patients. Front. Physiol. 2019, 10, 183.
- Feng, Y.; Roney, C.; Hocini, M.; Niederer, S.; Vigmond, E. Robust Atrial Ectopic Beat Classification From Surface ECG Using Second-Order Blind Source Separation. Comput. Cardiol. 2020, 47.
- Yang, T.; Yu, L.; Jin, Q.; Wu, L.; He, B. Localization of Origins of Premature Ventricular Contraction by Means of Convolutional Neural Network From 12-Lead ECG. IEEE Trans. Biomed. Eng. 2018, 65, 1662–1671.
- Ferrer-Albero, A.; Godoy, E.J.; Lozano, M.; Martínez-Mateu, L.; Atienza, F.; Saiz, J.; Sebastian, R. Non-invasive localization of atrial ectopic beats by using simulated body surface P-wave integral maps. PLoS ONE 2017, 12, e0181263.
- Kania, M.; Coudière, Y.; Cochet, H.; Haissaguerre, M.; Jais, P.; Potse, M. Prediction of the Exit Site of Ventricular Tachycardia Based on Different ECG Lead Systems. Comput. Cardiol. 2017, 44.
- Lyon, A.; Bueno-Orovio, A.; Zacur, E.; Ariga, R.; Grau, V.; Neubauer, S.; Watkins, H.; Rodriguez, B.; Mincholé, A. Electrocardiogram phenotypes in hypertrophic cardiomyopathy caused by distinct mechanisms: Apico-basal repolarization gradients vs. Purkinje-myocardial coupling abnormalities. EP Eur. 2018, 20, iii102–iii112.
- Potse, M.; Krause, D.; Kroon, W.; Murzilli, R.; Muzzarelli, S.; Regoli, F.; Caiani, E.; Prinzen, F.W.; Krause, R.; Auricchio, A. Patient-specific modelling of cardiac electrophysiology in heart-failure patients. EP Eur. 2014, 16 (Suppl. 4), iv56–iv61.
- Nguyen, U.C.; Potse, M.; Regoli, F.; Caputo, M.L.; Conte, G.; Murzilli, R.; Muzzarelli, S.; Moccetti, T.; Caiani, E.G.; Prinzen, F.W.; et al. An in-silico analysis of the effect of heart position and orientation on the ECG morphology and vectorcardiogram parameters in patients with heart failure and intraventricular conduction defects. J. Electrocardiol. 2015, 48, 617–625.
- Giffard-Roisin, S.; Fovargue, L.; Webb, J.; Molléro, R.; Lee, J.; Delingette, H.; Ayache, N.; Razavi, R.; Sermesant, M. Estimation of Purkinje Activation from ECG: An Intermittent Left Bundle Branch Block Study. Lect. Notes Comput. Sci. 2017, 10124, 135–142.
- Nguyên, U.C.; Potse, M.; Vernooy, K.; Mafi-Rad, M.; Heijman, J.; Caputo, M.L.; Conte, G.; Regoli, F.; Krause, R.; Moccetti, T.; et al. A left bundle branch block activation sequence and ventricular pacing influence voltage amplitudes: An in vivo and in silico study. EP Eur. 2018, 20, iii77–iii86.
- Zhou, Z.; Jin, Q.; Yu, L.; Wu, L.; He, B. Noninvasive Imaging of Human Atrial Activation during Atrial Flutter and Normal Rhythm from Body Surface Potential Maps. PLoS ONE 2016, 11, e0163445.
- Pezzuto, S.; Gharaviri, A.; Schotten, U.; Potse, M.; Conte, G.; Caputo, M.L.; Regoli, F.; Krause, R.; Auricchio, A. Beat-to-beat P-wave morphological variability in patients with paroxysmal atrial fibrillation: An in silico study. EP Eur. 2018, 20, iii26–iii35.
- Filos, D.; Tachmatzidis, D.; Maglaveras, N.; Vassilikos, V.; Chouvarda, I. Understanding the Beat-to-Beat Variations of P-Waves Morphologies in AF Patients During Sinus Rhythm: A Scoping Review of the Atrial Simulation Studies. Front. Physiol. 2019, 10, 742.
- Lehrmann, H.; Jadidi, A.S.; Minners, J.; Chen, J.; Müller-Edenborn, B.; Weber, R.; Dössel, O.; Arentz, T.; Loewe, A. Novel Electrocardiographic Criteria for Real-Time Assessment of Anterior Mitral Line Block. JACC Clin. Electrophysiol. 2018, 4, 920–932.
- Luongo, G.; Schuler, S.; Luik, A.; Almeida, T.P.; Soriano, D.C.; Dossel, O.; Loewe, A. Non-Invasive Characterization of Atrial Flutter Mechanisms Using Recurrence Quantification Analysis on the ECG: A Computational Study. IEEE Trans. Biomed. Eng. 2021, 68, 914–925.
- Luongo, G.; Schuler, S.; Rivolta, M.W.; Dössel, O.; Sassi, R.; Loewe, A. Automatic ECG-based Discrimination of 20 Atrial Flutter Mechanisms: Influence of Atrial and Torso Geometries. Comput. Cardiol. 2020.
- Saha, M.; Conte, G.; Caputo, M.L.; Regoli, F.; Krause, R.; Auricchio, A.; Jacquemet, V. Changes in P-wave morphology after pulmonary vein isolation: Insights from computer simulations. Europace 2016, 18, iv23–iv34.
- Rodrigo, M.; Climent, A.M.; Liberos, A.; Fernández-Avilés, F.; Berenfeld, O.; Atienza, F.; Guillem, M.S. Highest dominant frequency and rotor positions are robust markers of driver location during noninvasive mapping of atrial fibrillation: A computational study. Heart Rhythm 2017, 14, 1224–1233.
- Irakoze, E.; Jacquemet, V. Simulated P wave morphology in the presence of endo-epicardial activation delay. EP Eur. 2018, 20, iii16–iii25.
- Nagel, C.; Luongo, G.; Azzolin, L.; Schuler, S.; Dössel, O.; Loewe, A. Non-Invasive and Quantitative Estimation of Left Atrial Fibrosis Based on P Waves of the 12-Lead ECG—A Large-Scale Computational Study Covering Anatomical Variability. J. Clin. Med. 2021, 10, 1797.
- Luongo, G.; Azzolin, L.; Schuler, S.; Rivolta, M.W.; Almeida, T.P.; Martínez, J.P.; Soriano, D.C.; Luik, A.; Müller-Edenborn, B.; Jadidi, A.; et al. Machine learning enables noninvasive prediction of atrial fibrillation driver location and acute pulmonary vein ablation success using the 12-lead ECG. Cardiovasc. Digit. Health J. 2021, 2, 126–136.
- Seemann, G.; Weiß, D.L.; Sachse, F.B.; Dössel, O. Simulation of the Long-QT Syndrome in a Model of Human Myocardium. Comput. Cardiol. 2003, 30, 287–290.
- Weiss, D.L.; Seemann, G.; Sachse, F.B.; Dössel, O. Modelling of the short QT syndrome in a heterogeneous model of the human ventricular wall. EP Eur. 2005, 7s2, 105–117.
- Seemann, G.; Alvarez de Eulate, M.; Konrad, N.; Maier, J.; Wilhelms, M.; Keller, D.; Dössel, O.; Scholz, E. Evaluating body surface ECG differences of simulated long-QT syndromes. Comput. Cardiol. 2013, 40, 345–348.
- Hernández Mesa, M.; Pilia, N.; Dössel, O.; Severi, S.; Loewe, A. Effects of Serum Calcium Changes on the Cardiac Action Potential and the ECG in a Computational Model. Curr. Dir. Biomed. Eng. 2018, 4, 251–254.
- Hernández Mesa, M.; Pilia, N.; Dössel, O.; Loewe, A. Influence of ECG Lead Reduction Techniques for Extracellular Potassium and Calcium Concentration Estimation. Curr. Dir. Biomed. Eng. 2019, 5, 69–72.
- Loewe, A.; Lutz, Y.; Nairn, D.; Fabbri, A.; Nagy, N.; Toth, N.; Ye, X.; Fuertinger, D.H.; Genovesi, S.; Kotanko, P.; et al. Hypocalcemia-Induced Slowing of Human Sinus Node Pacemaking. Biophys. J. 2019, 117, 2244–2254.
- Pilia, N.; Hernandez Mesa, M.; Dössel, O.; Loewe, A. ECG-based Estimation of Potassium and Calcium Concentrations: Proof of Concept with Simulated Data. In Proceedings of the 2019 41st Annual International Conference of the IEEE Engineering in Medicine and Biology Society (EMBC), Berlin, Germany, 23–27 July 2019; pp. 2610–2613.
- Pilia, N.; Severi, S.; Raimann, J.G.; Genovesi, S.; Dössel, O.; Kotanko, P.; Corsi, C.; Loewe, A. Quantification and classification of potassium and calcium disorders with the electrocardiogram: What do clinical studies, modeling, and reconstruction tell us? APL Bioeng. 2020, 4, 041501.
- Pilia, N.; Corsi, C.; Severi, S.; Dössel, O.; Loewe, A. Reconstruction of Potassium Concentrations with the ECG on Imbalanced Datasets. arXiv 2020, arXiv:2006.05212.
- Wilhelms, M.; Rombach, C.; Scholz, E.P.; Doessel, O.; Seemann, G. Impact of amiodarone and cisapride on simulated human ventricular electrophysiology and electrocardiograms. EP Eur. 2012, 14, v90–v96.
- Zemzemi, N.; Bernabeu, M.O.; Saiz, J.; Cooper, J.; Pathmanathan, P.; Mirams, G.R.; Pitt-Francis, J.; Rodriguez, B. Computational assessment of drug-induced effects on the electrocardiogram: from ion channel to body surface potentials. Br. J. Pharmacol. 2013, 168, 718–733.
- Zemzemi, N.; Rodriguez, B. Effects of L-type calcium channel and human ether-a-go-go related gene blockers on the electrical activity of the human heart: A simulation study. EP Eur. 2015, 17, 326–333.
- Oosterom, A.V.; Oostendorp, T.F. ECGSIM: An interactive tool for studying the genesis of QRST forms. Heart 2004, 90, 165–168.
- Plank, G.; Loewe, A.; Neic, A.; Augustin, C.; Huang, Y.L.; Gsell, M.A.; Karabelas, E.; Nothstein, M.; Prassl, A.J.; Sánchez, J.; et al. The openCARP simulation environment for cardiac electrophysiology. Comput. Methods Programs Biomed. 2021, 208, 106223.
- Sánchez, J.; Nothstein, M.; Neic, A.; Huang, Y.L.; Prassl, A.J.; Klar, J.; Ulrich, R.; Bach, F.; Zschumme, P.; Selzer, M.; et al. openCARP: An Open Sustainable Framework for In-Silico Cardiac Electrophysiology Research. Comput. Cardiol. 2020, 47.
- Seemann, G.; Sachse, F.B.; Karl, M.; Weiss, D.L.; Heuveline, V.; Dössel, O. Framework for modular, flexible and efficient solving the cardiac bidomain equation using PETSc. Math. Ind. 2010, 15, 363–369.
- Sundnes, J.; Nielsen, B.F.; Mardal, K.A.; Cai, X.; Lines, G.T.; Tveito, A. On the computational complexity of the bidomain and the monodomain models of electrophysiology. Ann. Biomed. Eng. 2006, 34, 1088–1097.
- Cooper, F.; Baker, R.; Bernabeu, M.; Bordas, R.; Bowler, L.; Bueno-Orovio, A.; Byrne, H.; Carapella, V.; Cardone-Noott, L.; Cooper, J.; et al. Chaste: Cancer, Heart and Soft Tissue Environment. J. Open Source Softw. 2020, 5, 1848.
- Krause, D.; Potse, M.; Dickopf, T.; Krause, R.; Auricchio, A.; Prinzen, F. Hybrid Parallelization of a Large-Scale Heart Model. Lect. Notes Comput. Sci. 2012, 7174, 120–132.
- Quarteroni, A.; Manzoni, A.; Vergara, C. The cardiovascular system: Mathematical modelling, numerical algorithms and clinical applications. Acta Numer. 2017, 26, 365–590.
- Niederer, S.A.; Kerfoot, E.; Benson, A.P.; Bernabeu, M.O.; Bernus, O.; Bradley, C.; Cherry, E.M.; Clayton, R.; Fenton, F.H.; Garny, A.; et al. Verification of cardiac tissue electrophysiology simulators using an N-version benchmark. Philos. Trans. R. Soc. A Math. Phys. Eng. Sci. 2011, 369, 4331–4351.
- Lyon, A.; Mincholé, A.; Martínez, J.P.; Laguna, P.; Rodriguez, B. Computational techniques for ECG analysis and interpretation in light of their contribution to medical advances. J. R. Soc. Interface 2018, 15, 20170821.
- Potse, M. Scalable and Accurate ECG Simulation for Reaction-Diffusion Models of the Human Heart. Front. Physiol. 2018, 9, 370.
- Pezzuto, S.; Kal’avský, P.; Potse, M.; Prinzen, F.W.; Auricchio, A.; Krause, R. Evaluation of a Rapid Anisotropic Model for ECG Simulation. Front. Physiol. 2017, 8, 265.
- Keller, D.U.J.; Weber, F.M.; Seemann, G.; Dössel, O. Ranking the Influence of Tissue Conductivities on Forward-Calculated ECGs. IEEE Trans. Biomed. Eng. 2010, 57, 1568–1576.
- Schuler, S.; Tate, J.D.; Oostendorp, T.F.; MacLeod, R.S.; Dössel, O. Spatial Downsampling of Surface Sources in the Forward Problem of Electrocardiography. In Functional Imaging and Modeling of the Heart; Lecture Notes in Computer Science; Coudière, Y., Ozenne, V., Vigmond, E., Zemzemi, N., Eds.; Springer International Publishing: Berlin, Germany, 2019; Volume 11504, pp. 29–36.
- Neic, A.; Campos, F.O.; Prassl, A.J.; Niederer, S.A.; Bishop, M.J.; Vigmond, E.J.; Plank, G. Efficient computation of electrograms and ECGs in human whole heart simulations using a reaction-eikonal model. J. Comput. Phys. 2017, 346, 191–211.
- Schuler, S.; Pilia, N.; Potyagaylo, D.; Loewe, A. Cobiveco: Consistent biventricular coordinates for precise and intuitive description of position in the heart—With MATLAB implementation. arXiv 2021, arXiv:2102.02898.
- Bayer, J.; Prassl, A.J.; Pashaei, A.; Gomez, J.F.; Frontera, A.; Neic, A.; Plank, G.; Vigmond, E.J. Universal ventricular coordinates: A generic framework for describing position within the heart and transferring data. Med. Image Anal. 2018, 45, 83–93.
- Roney, C.H.; Pashaei, A.; Meo, M.; Dubois, R.; Boyle, P.M.; Trayanova, N.A.; Cochet, H.; Niederer, S.A.; Vigmond, E.J. Universal atrial coordinates applied to visualisation, registration and construction of patient specific meshes. Med. Image Anal. 2019, 55, 65–75.
- Opthof, T.; Remme, C.A.; Jorge, E.; Noriega, F.; Wiegerinck, R.F.; Tasiam, A.; Beekman, L.; Alvarez-Garcia, J.; Munoz-Guijosa, C.; Coronel, R.; et al. Cardiac activation-repolarization patterns and ion channel expression mapping in intact isolated normal human hearts. Heart Rhythm 2017, 14, 265–272.
- Wachter, A.; Loewe, A.; Krueger, M.W.; Dössel, O.; Seemann, G. Mesh structure-independent modeling of patient-specific atrial fiber orientation. Curr. Dir. Biomed. Eng. 2015, 1, 409–412.
- Nagel, C.; Pilia, N.; Loewe, A.; Dössel, O. Quantification of Interpatient 12-lead ECG Variabilities within a Healthy Cohort. Curr. Dir. Biomed. Eng. 2020, 6, 493–496.
- Rajendra Acharya, U.; Paul Joseph, K.; Kannathal, N.; Lim, C.M.; Suri, J.S. Heart rate variability: A review. Med. Biol. Eng. Comput. 2006, 44, 1031–1051.
- Wilders, R.; Hoekstra, M.; van Ginneken, A.C.G.; Verkerk, A.O. Beta-adrenergic modulation of heart rate: Contribution of the slow delayed rectifier K+ current (IKs). Comput. Cardiol. 2010, 37, 629–631.
- Dössel, O.; Reumann, M.; Seemann, G.; Weiss, D. The missing link between cardiovascular rhythm control and myocardial cell modeling. Biomed Tech. 2006, 51, 205–209.
- Rodero, C.; Strocchi, M.; Marciniak, M.; Longobardi, S.; Whitaker, J.; O’Neill, M.D.; Gillette, K.; Augustin, C.; Plank, G.; Vigmond, E.J.; et al. Linking statistical shape models and simulated function in the healthy adult human heart. PLoS Comput. Biol. 2021, 17, e1008851.
- Potyagaylo, D.; Seemann, G.; Schulze, W.; Dössel, O. Magnetocardiography did not uncover electrically silent ischemia in an in-silico study case. Comput. Cardiol. 2015, 42, 1145–1148.
- Ghasemi, M. Electrocardiographic imaging of myocardial infarction using heart vector analysis. Comput. Cardiol. 2007.


