Your browser does not fully support modern features. Please upgrade for a smoother experience.
Submitted Successfully!
 +1 credit
Thank you for your contribution! You can also upload a video entry or images related to this topic.
For video creation, please contact our Academic Video Service.
| Version | Summary | Created by | Modification | Content Size | Created at | Operation |
|---|---|---|---|---|---|---|
| 1 | Fabian Hemm | + 462 word(s) | 462 | 2021-07-29 05:30:25 | | | |
| 2 | Rita Xu | + 2538 word(s) | 3000 | 2021-08-10 06:26:23 | | |
Video Upload Options
We provide professional Academic Video Service to translate complex research into visually appealing presentations. Would you like to try it?
Cite
If you have any further questions, please contact Encyclopedia Editorial Office.
Hemm, F. Rodent Model of Experimental Autoimmune-Orchitis. Encyclopedia. Available online: https://encyclopedia.pub/entry/12971 (accessed on 08 February 2026).
Hemm F. Rodent Model of Experimental Autoimmune-Orchitis. Encyclopedia. Available at: https://encyclopedia.pub/entry/12971. Accessed February 08, 2026.
Hemm, Fabian. "Rodent Model of Experimental Autoimmune-Orchitis" Encyclopedia, https://encyclopedia.pub/entry/12971 (accessed February 08, 2026).
Hemm, F. (2021, August 09). Rodent Model of Experimental Autoimmune-Orchitis. In Encyclopedia. https://encyclopedia.pub/entry/12971
Hemm, Fabian. "Rodent Model of Experimental Autoimmune-Orchitis." Encyclopedia. Web. 09 August, 2021.
Copy Citation
The rodent model of experimental autoimmune-orchitis (EAO) was established to analyze the underlying mechanisms of male infertility and causes of reduced testosterone concentration.
experimental autoimmune-orchitis
osteoporosis
mouse model
biomechanical properties
rodent model
Complete Freund’s Adjuvant
Bordetella pertussis toxin
1. Introduction
Testicular inflammation is mainly caused by bacterial infections, either sexually transmitted or from the urinary tract, and often develops a chronic asymptomatic disease progression [1][2][3][4]. Therefore, orchitis can persist over prolonged periods until adequate therapy is started and may result in irreversible long-term damage regarding the reproductive system [2][3]. In this regard, inflammatory infiltrates in the testicular interstitium, damaged seminiferous tubules and disorder of spermatogenesis have been illustrated [2]. In most cases inflammation affects epididymides as well, and leads to a combined epididymo-orchitis [1][2]. Consequently, orchitis, or rather epididymo-orchitis, represents a frequent cause of fertility disorders in young men [3][5]. However, the majority of fertility disorders are diagnosed a long time after the initial inflammatory process. Thus, in vitro and in vivo models are crucial to investigate the underlying processes of epididymo- orchitis and its complications. In this context the rodent model of experimental autoimmune-orchitis (EAO) represents a well-established animal model to evaluate the processes of testicular inflammation, consequences regarding the reproductive functionality and possible therapy options [6][7][8][9]. Furthermore, EAO was found to significantly reduce the testosterone concentration in rats in a similar way to human orchitis [6]. Androgens are known to represent a major impact factor regarding bone metabolism in men [10][11][12]. Accordingly, human studies illustrated the development of osteoporosis even in young men suffering from hypogonadism [13][14].
2. Histomorphometric Bone Architecture
Microscopic overviews of hematoxylin-eosin-stained vertebral bodies (Figure 1) were automatically evaluated regarding bone area (B.Ar), trabecular thickness (Tb.Th) and trabecular separation (Tb.Sp), while the trabecular perimeter (Tb.Pm) was measured manually. Histomorphometrical measurement illustrated a significantly decreased bone area due to EAO (0.361 ± 0.020 mm2) and nearly significant reduction in the adjuvant group (Adj; 0.453 ± 0.043 mm2) compared to the control group (Cont; 0.594 ± 0.048 mm2, p < 0.01 vs. EAO, p = 0.080 vs. Adj, Figure 2). However, trabecular perimeter (EAO 17.082 ± 1.190 mm, Adj 17.358 ± 0.658 mm, Cont 21.550 ± 2.274 mm), trabecular thickness (EAO 17.050 ± 1.942 µm, Adj 17.509 ± 0.904 µm, Cont 18.024 ± 0.971 µm) and trabecular separation (EAO 106.298 ± 12.552 µm, Adj 108.196 ± 3.266 µm, Cont 87.265 ± 6.338 µm) remained without significant alterations.
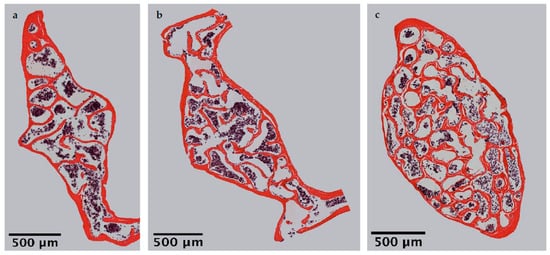
Figure 1. Microscopic overviews of vertebral bodies L3 stained with hematoxylin-eosin. Images taken at 40× magnification were merged. Mice were immunized with (a) testicular homogenate in adjuvant (EAO), (b) adjuvant alone or (c) remained untreated.
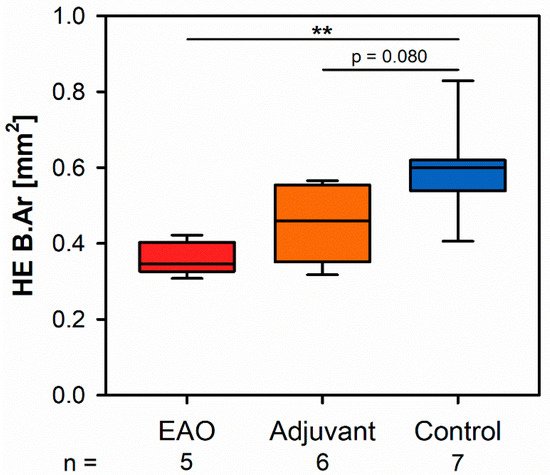
Figure 2. Histomorphometrical results regarding the bone area (B.Ar) in vertebral bodies L3 stained with hematoxylin-eosin (HE). Mice were immunized with testicular homogenate in adjuvant (EAO), adjuvant alone (adjuvant) or remained untreated (control). ** p < 0.01.
3. Microarchitecture of Cortical Bone
The microarchitecture of the femoral cortex was analyzed at mid diaphysis and distal diaphysis by micro computed tomography (µCT). Two-dimensional example images from µCT scans (Figure 3) demonstrated a loss of cortical as well as trabecular bone mass following (a) EAO or (b) treatment with adjuvant alone, compared to (c) untreated mice.
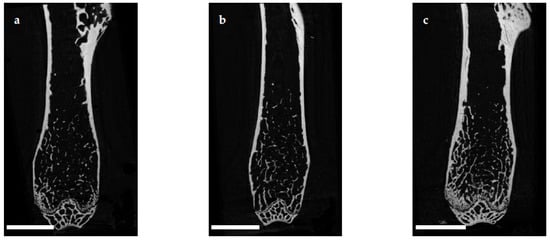
Figure 3. Two-dimensional images from µCT scans of distal femora (scale bar 2 mm). Mice were immunized with (a) testicular homogenate in adjuvant (EAO), (b) adjuvant alone or (c) remained untreated.
At the mid diaphyseal region, µCT identified a significantly reduced cortical thickness (Ct.Th, Figure 4a) in the EAO (0.147 ± 0.005 mm) and adjuvant group (0.155 ± 0.005 mm) in contrast to the control group (0.210 ± 0.007 mm, p < 0.001 each) with no difference between EAO and adjuvant. The cortical surface (Ct.S, not graphically displayed) remained unaltered in EAO (10.538 ± 0.163 mm2) compared to control (10.270 ± 0.235 mm2, p = 1.000), but slightly decreased in the adjuvant group (9.530 ± 0.238 mm2, p < 0.05 vs. EAO, p = 0.087 vs. Cont). In contrast, the cortical surface/volume ratio (Ct.S/Ct.V, Figure 4b) was significantly increased in EAO (18.588 ± 0.608 mm−1) and adjuvant (17.594 ± 0.549 mm−1) compared to control (13.670 ± 0.326 mm−1, p < 0.001 each). Therefore, the cortical surface/volume ratio indirectly indicated a loss of cortical bone volume in EAO and adjuvant without significant differences between them. The bone mineral density (BMD, Figure 4c) was reduced in EAO (1.164 ± 0.010 g/cm3, p < 0.001 vs. Cont 1.280 ± 0.006 g/cm3) while adjuvant (1.270 ± 0.045 g/cm3) showed no difference to control. Similarly, the tissue mineral density (TMD, Figure 4d) was decreased in the EAO group (1.480 ± 0.004 g/cm3) compared to control (1.537 ± 0.005 g/cm3, p < 0.001) and almost significantly decreased compared to the adjuvant group (1.531 ± 0.015 g/cm3, p = 0.053 vs. EAO) with no difference between adjuvant and control (p = 0.974).
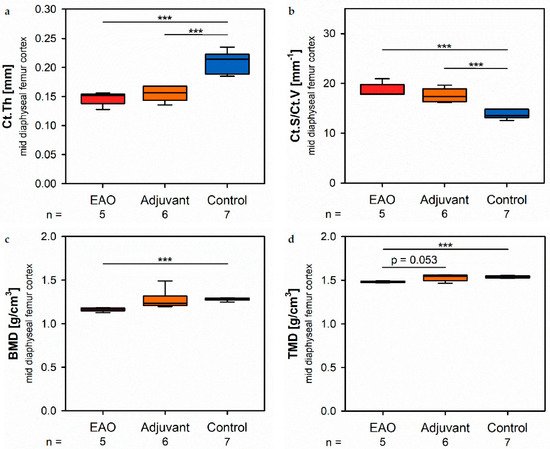
Figure 4. Microarchitecture of mid diaphyseal femur cortex in µCT. Measurement of (a) cortical thickness (Ct.Th), (b) cortical surface/volume ratio (Ct.S/Ct.V), (c) bone mineral density (BMD) and (d) tissue mineral density (TMD). Mice were immunized with testicular homogenate in adjuvant (EAO), adjuvant alone (adjuvant) or remained untreated (control). *** p < 0.001.
At the distal diaphysis, µCT showed a significantly thinner cortical thickness (Figure 5a) in the EAO (0.113 ± 0.004 mm) and adjuvant group (0.125 ± 0.005 mm) compared to the control group (0.165 ± 0.002 mm, p < 0.001 each) similar to the mid diaphysis. The cortical surface (not graphically displayed) remained without differences in all groups (EAO 13.012 ± 0.274 mm2, Adj 11.556 ± 0.326 mm2, Cont 12.686 ± 0.438 mm2). Again, the cortical surface/volume ratio (Figure 5b) was significantly increased in the EAO (24.713 ± 0.982 mm−1) and adjuvant group (22.396 ± 0.915 mm−1) in contrast to control (17.706 ± 0.152 mm−1, p < 0.01 each) and indicated a loss of cortical bone volume indirectly. The bone mineral density (Figure 5c) was reduced in EAO (0.944 ± 0.015 g/cm3) compared to control (1.055 ± 0.005 g/cm3, p < 0.001). Additionally, bone mineral density at distal diaphysis was also decreased in the adjuvant group (0.993 ± 0.020 g/cm3, p < 0.05) unlike at the mid diaphysis. In contrast, the tissue mineral density (Figure 5d) was only reduced in the EAO group (1.273 ± 0.012 g/cm3) compared to control (1.319 ± 0.005 g/cm3, p < 0.05) while adjuvant remained unaltered (1.309 ± 0.017 g/cm3, p = 1.000).
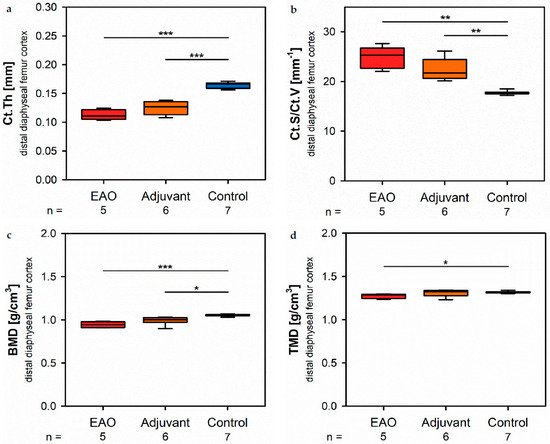
Figure 5. Microarchitecture of distal diaphyseal femur cortex in µCT. Measurement of (a) cortical thickness (Ct.Th), (b) cortical surface/volume ratio (Ct.S/Ct.V), (c) bone mineral density (BMD) and (d) tissue mineral density (TMD). Mice were immunized with testicular homogenate in adjuvant (EAO), adjuvant alone (adjuvant) or remained untreated (control). * p < 0.05; ** p < 0.01; *** p < 0.001.
4. Microarchitecture of Trabecular Bone
The microarchitecture of trabecular bone was studied in femora and lumbar vertebral bodies (L1) by µCT. Two-dimensional example images from µCT scans of vertebral bodies (Figure 6) illustrate a loss of trabecular bone mass following (a) EAO or (b) treatment with adjuvant alone compared to (c) untreated mice, similar to µCT scans of the distal femora (Figure 3).
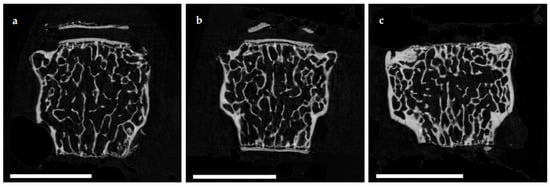
Figure 6. Two-dimensional images from µCT scans of vertebral bodies L1 (scale bar 2 mm). Mice were immunized with (a) testicular homogenate in adjuvant (EAO), (b) adjuvant alone or (c) remained untreated.
In the trabecular region of the femora, µCT indicated a loss of trabecular number (Tb.N, Figure 7a) and trabecular thickness (Tb.Th, Figure 7b) in EAO (Tb.N: 1.171 ± 0.099 mm−1; Tb.Th: 0.038 ± 0.003 mm) and in the adjuvant group (Tb.N: 1.344 ± 0.133 mm−1; Tb.Th: 0.038 ± 0.002 mm) compared to control (Tb.N: 2.771 ± 0.197 mm−1, p < 0.001 each; Tb.Th: 0.048 ± 0.002 mm, p < 0.05 each). Trabecular separation (Tb.Sp, Figure 7c) was larger in EAO (0.276 ± 0.006 mm) and adjuvant (0.256 ± 0.005 mm) than in control (0.199 ± 0.006 mm, p < 0.001 each). Consequently, the bone volume fraction (BV/TV, Figure 7d), as well as the bone surface density (BS/TV, Figure 7e) were significantly decreased in EAO (BV/TV: 4.452 ± 0.447%; BS/TV: 4.427 ± 0.335 mm−1) and adjuvant groups (BV/TV: 5.065 ± 0.566%; BS/TV: 5.171 ± 0.440 mm−1) in comparison to control (BV/TV: 13.340 ± 1.283%, p < 0.01 each; BS/TV: 10.340 ± 0.698 mm−1, p < 0.001 each). Thereby, the specific bone surface (BS/BV, Figure 7f) increased in the EAO (101.214 ± 6.639 mm−1, p < 0.05 vs. Cont 79.430 ± 3.681 mm−1) and adjuvant groups (103.878 ± 4.293 mm−1, p < 0.01). This finding illustrates a pronounced loss of trabecular bone volume over trabecular bone surface. Furthermore, the structure model index (SMI; Figure 7g) and trabecular pattern factor (Tb.Pf, not graphically displayed) were significantly elevated in EAO (SMI: 2.252 ± 0.087; Tb.Pf: 37.822 ± 2.271 mm−1) and adjuvant (SMI: 2.231 ± 0.100; Tb.Pf: 38.736 ± 2.703 mm−1) compared to control (SMI: 1.699 ± 0.102, p < 0.01 each; Tb.Pf: 22.782 ± 2.360 mm−1, p < 0.01 each), both indicating a degradation of trabecular integrity. The bone mineral density (BMD, Figure 7h) was reduced in both immunized groups (EAO 0.078 ± 0.006 g/cm3, Adj 0.091 ± 0.008 g/cm3) in contrast to control (0.205 ± 0.016 g/cm3, p < 0.001 each) similar to the femoral cortex. Equally, the tissue mineral density (TMD, Figure 7i) was decreased in both immunized groups (EAO 0.922 ± 0.018 g/cm3, Adj 0.931 ± 0.012 g/cm3) compared to control (1.002 ± 0.012 g/cm3, p < 0.01 each).
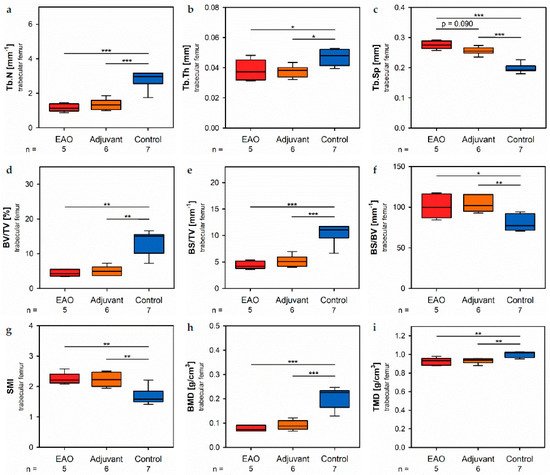
Figure 7. Microarchitecture of trabecular femur by µCT. Measurement of (a) trabecular number (Tb.N), (b) trabecular thickness (Tb.Th), (c) trabecular separation (Tb.Sp), (d) bone volume fraction (BV/TV), (e) bone surface density (BS/TV), (f) specific bone surface (BS/BV), (g) structure model index (SMI), (h) bone mineral density (BMD) and (i) tissue mineral density (TMD). Mice were immunized with testicular homogenate in adjuvant (EAO), adjuvant alone (adjuvant) or remained untreated (control). * p < 0.05; ** p < 0.01; *** p < 0.001.
Investigation of the trabecular region in vertebral bodies L1 by µCT (Figure 8) demonstrated generally similar alterations like the trabecular region in femora (Figure 7). However, several significant differences between EAO and the adjuvant group were detected in the trabecular region of vertebral bodies L1, while both groups were mostly comparable in the trabecular region of the femora.
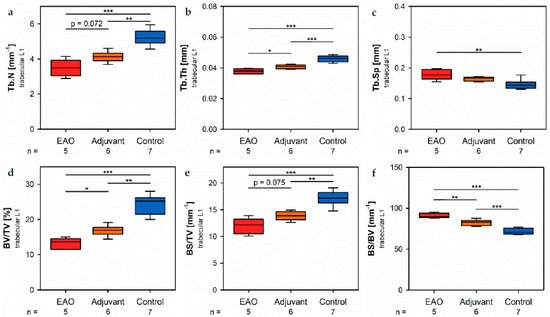
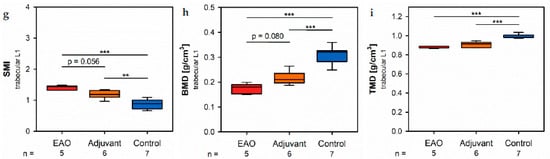
Figure 8. Microarchitecture of trabecular vertebral body L1 by µCT. Measurement of (a) trabecular number (Tb.N), (b) trabecular thickness (Tb.Th), (c) trabecular separation (Tb.Sp), (d) bone volume fraction (BV/TV), (e) bone surface density (BS/TV), (f) specific bone surface (BS/BV), (g) structure model index (SMI), (h) bone mineral density (BMD) and (i) tissue mineral density (TMD). Mice were immunized with testicular homogenate in adjuvant (EAO), adjuvant alone (adjuvant) or remained untreated (control). * p < 0.05; ** p < 0.01; *** p < 0.001.
In the vertebral bodies, L1 trabecular number (Figure 8a) and trabecular thickness (Figure 8b) were significantly decreased in the EAO (Tb.N: 3.488 ± 0.215 mm−1; Tb.Th: 0.038 ± 0.001 mm) and adjuvant groups (Tb.N: 4.131 ± 0.123 mm−1; Tb.Th: 0.041 ± 0.001 mm) compared to control (Tb.N: 5.243 ± 0.176 mm−1, p < 0.001 vs. EAO, p < 0.01 vs. Adj; Tb.Th: 0.046 ± 0.001 mm, p < 0.001 each). Furthermore, trabecular number was nearly (p = 0.072) and trabecular thickness significantly (p < 0.05) lower in EAO than in the adjuvant group. The trabecular separation (Figure 8c) was larger following EAO (0.179 ± 0.008 mm) than in the control group (0.147 ± 0.006 mm, p < 0.01), but unaltered in the adjuvant group (0.164 ± 0.003 mm, p = 0.113). These findings resulted in a significant reduction of the bone volume fraction (Figure 8d) as well as the bone surface density (Figure 8e) in EAO (BV/TV: 13.154 ± 0.711%; BS/TV: 11.951 ± 0.659 mm−1) and in the adjuvant group (BV/TV: 16.856 ± 0.628%; BS/TV: 13.868 ± 0.342 mm−1) in comparison to control (BV/TV: 24.056 ± 1.132%, p < 0.001 vs. EAO, p < 0.01 vs. Adj; BS/TV: 17.149 ± 0.535 mm−1, p < 0.001 vs. EAO, p < 0.01 vs. Adj). Bone volume fraction was significantly lower (p < 0.05), and bone surface density was almost lower (p = 0.075) in the EAO than in the adjuvant group. The specific bone surface (Figure 8f) was increased in the adjuvant group (82.504 ± 1.489 mm−1, p < 0.001 vs. Cont 71.647 ± 1.474 mm−1) and even more significantly raised after EAO (90.882 ± 1.376 mm−1, p < 0.001 vs. Cont, p < 0.01 vs. Adj), again indicating a predominant loss of trabecular bone volume over trabecular bone surface. Both the structure model index (Figure 8g) and trabecular pattern factor (not graphically displayed) illustrated a loss of trabecular integrity in EAO (SMI: 1.400 ± 0.033; Tb.Pf: 21.194 ± 0.562 mm−1) and adjuvant groups (SMI: 1.188 ± 0.054; Tb.Pf: 16.390 ± 1.011 mm−1) compared to control (SMI: 0.876 ± 0.061, p < 0.001 vs. EAO, p < 0.01 vs. Adj; Tb.Pf: 10.544 ± 0.927 mm−1, p < 0.001 vs. EAO, p < 0.01 vs. Adj). Again, EAO was more severely affected in this regard than the adjuvant group (SMI: p = 0.056; Tb.Pf: p < 0.01). The bone mineral density (Figure 8h) was decreased in both immunized groups (EAO 0.173 ± 0.009 g/cm3, Adj 0.216 ± 0.011 g/cm3) in contrast to control (0.308 ± 0.014 g/cm3, p < 0.001 each). Likewise, the tissue mineral density (Figure 8i) was reduced in EAO (0.883 ± 0.004 g/cm3) and adjuvant groups (0.908 ± 0.012 g/cm3) compared to control (0.995 ± 0.008 g/cm3, p < 0.001 each).
5. Osteoblasts
Osteoblast activity was determined by the expression of alkaline phosphatase (ALP), a major enzyme of osteoblast hydroxyapatite synthesis. Enzyme histochemical staining of ALP in vertebral bodies resulted in a distinctive violet labeling located along the trabecular surface (Figure 9a). Histomorphometrical calculation illustrated a significantly decreased relative ALP perimeter (ALP.Pm/Tb.Pm, Figure 9b) in the EAO (12.720 ± 1.841%) and adjuvant groups (21.298 ± 3.237%) compared to control (43.185 ± 4.818%, p < 0.001 vs. EAO, p < 0.01 vs. Adj). This finding was supported by a reduced mRNA expression of ALP (Figure 9c) in the immunized groups (EAO −9.034 ± 0.102 [−∆CP], Adj −9.017 ± 0.106 [−∆CP]) in contrast to control (−8.461 ± 0.110 [−∆CP], p < 0.01 each) determined by real-time reverse transcription polymerase chain reaction (real-time RT-PCR). Beside bone mineralization, osteoblasts are responsible for synthesis and secretion of organic bone matrix. Therefore, we examined the mRNA expression of collagen 1α1 (Col1α1, Figure 9d) as another parameter of osteoblast activity. Regarding the mRNA expression of collagen 1α1, we detected no significant differences between the investigated groups (EAO −2.092 ± 0.256 [−∆CP], Adj −2.490 ± 0.082 [−∆CP], Cont −2.411 ± 0.143 [−∆CP]). Additionally, we conducted Von Kossa/Van Gieson staining of histological specimens, which resulted in a red labeling of osteoid (Figure 9f). However, the histomorphometrical calculation of relative osteoid area (O.Ar/B.Ar, Figure 9e) influenced neither EAO nor adjuvant compared to control (EAO 21.674 ± 1.662%, Adj 17.720 ± 4.299%, Cont 15.695 ± 3.673%).
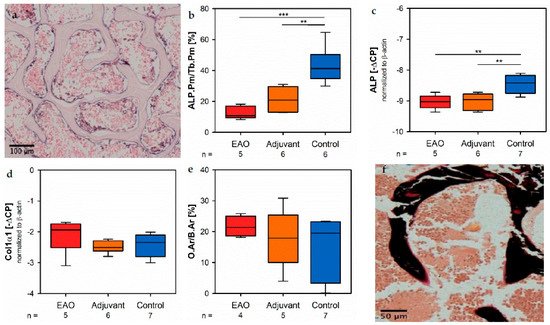
Figure 9. Osteoblasts. (a) Enzyme histochemical staining of alkaline phosphatase (ALP, violet) in vertebral body L3 from an untreated mouse. (b) Histomorphometrical calculation of relative ALP perimeter (ALP.Pm/Tb.Pm) in enzyme histochemical-stained vertebral bodies L3. mRNA expression of (c) ALP and (d) collagen 1α1 (Col1α1) in real-time RT-PCR of vertebral bodies Th10. (e) Histomorphometrical calculation of relative osteoid area (O.Ar/B.Ar) in vertebral bodies L2 by Von Kossa/Van Gieson staining. (f) Von Kossa/Van Gieson staining in vertebral body L2 from an untreated mouse (red: osteoid; black: mineralized bone; brown: bone marrow). Mice were immunized with testicular homogenate in adjuvant (EAO), adjuvant alone (adjuvant) or remained untreated (control). ** p < 0.01; *** p < 0.001.
6. Osteoclasts
Osteoclasts were identified by enzyme histochemical staining of tartrate resistant acid phosphatase (TRAP). Multinuclear, red stained cells in contact to the trabecular surface were counted as osteoclasts (Figure 10a). The calculation of osteoclast number in relation to trabecular perimeter (TRAP.N/Tb.Pm, Figure 10b) illustrated a significant reduction of osteoclasts in EAO (1.924 ± 0.488 n/mm) and adjuvant groups (1.933 ± 0.407 n/mm) compared to control (5.447 ± 0.527 n/mm, p < 0.001 each). These findings were supplemented by the results of real-time RT-PCR regarding cathepsin K (CtsK), another typical degrading enzyme of osteoclasts. The mRNA expression of cathepsin K (Figure 10c) was significantly decreased after EAO (−4.522 ± 0.292 [−∆CP]) in comparison to control (−3.754 ± 0.159 [−∆CP], p < 0.05) while it was not significantly decreased in the adjuvant group (−4.097 ± 0.129 [−∆CP], p = 0.620). As a major regulatory factor of osteoclast differentiation, we determined the mRNA expression of the receptor activator of nuclear factor-kappa B ligand (RANKL, Figure 10d) but no significant alterations were detected (EAO −11.292 ± 0.088 [−∆CP], Adj −11.192 ± 0.085 [−∆CP], Cont −10.816 ± 0.237 [−∆CP]). Additionally, we evaluated the mRNA expression of osteoprotegerin (OPG, Figure 10e), an inhibitor of RANKL and, thereby, regulating the differentiation of osteoclasts. Expression of osteoprotegerin was significantly reduced in the adjuvant group (−10.530 ± 0.186 [−∆CP], p < 0.01 vs. Cont −9.493 ± 0.194 [−∆CP]) and almost significantly decreased after EAO (−10.262 ± 0.249 [−∆CP], p = 0.062 vs. Cont). Therefore, the reduction of osteoclast activity can neither been explained by RANKL nor by osteoprotegerin.
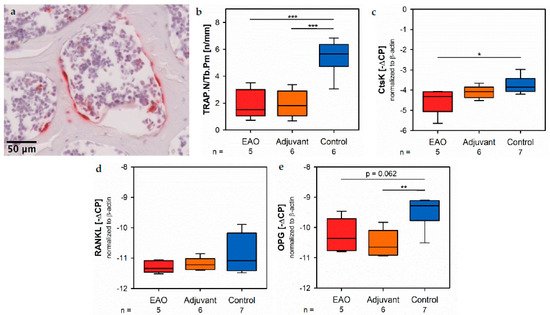
Figure 10. Osteoclasts. (a) Enzyme histochemical staining of tartrate resistant acid phosphatase (TRAP, red) in vertebral body L3 from an untreated mouse. (b) Histomorphometrical calculation of number of TRAP positive cells per trabecular perimeter (TRAP.N/Tb.Pm) in enzyme histochemical-stained vertebral bodies L3. mRNA expression of (c) cathepsin K (CtsK), (d) receptor activator of nuclear factor-kappa B ligand (RANKL) and (e) osteoprotegerin (OPG) in real-time RT-PCR of vertebral bodies Th10. Mice were immunized with testicular homogenate in adjuvant (EAO), adjuvant alone (adjuvant) or remained untreated (control). * p < 0.05; ** p < 0.01; *** p < 0.001.
7. Osteocytes and Cell-Contacts
Since sclerostin represents a typical marker of osteocytes, we analyzed the mRNA expression of the sclerostin gene (SOST, Figure 11a) by real-time RT-PCR. The mRNA expression of SOST was significantly decreased in both immunized groups (EAO −12.782 ± 0.277 [−∆CP], Adj −12.522 ± 0.281 [−∆CP]) compared to control (−11.359 ± 0.295 [−∆CP], p < 0.05 each). Gap junctions link osteocytes with each other and are mandatory regarding structural integrity and cellular survival. Connexin 43 represents a characteristic element of gap junctions. The mRNA expression of connexin 43 (Cx43, Figure 11b) was significantly lower after EAO (−8.530 ± 0.164 [−∆CP]) than it was in the control group (−7.759 ± 0.122 [−∆CP], p < 0.01) while the adjuvant group showed an intermediate mRNA level of connexin 43 (−8.100 ± 0.097 [−∆CP], p = 0.199 vs. Cont).
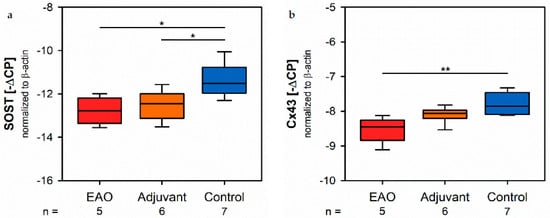
Figure 11. Osteocytes and cell-contacts. mRNA expression of (a) sclerostin (SOST) and (b) connexin 43 (Cx43) in real-time RT-PCR of vertebral bodies Th10. Mice were immunized with testicular homogenate in adjuvant (EAO), adjuvant alone (adjuvant) or remained untreated (control). * p < 0.05; ** p < 0.01.
8. Biomechanical Properties
By a three-point bending test of the femora, we objectified the consequences regarding biomechanical bone properties due to the cellular and molecular alterations following EAO described before. The maximum load (Figure 12a) was significantly decreased in the EAO (8.234 ± 1.099 N) and adjuvant groups (10.392 ± 1.086 N) compared to control (15.984 ± 0.665 N, p < 0.001 vs. EAO, p < 0.01 vs. Adj). The stiffness (Figure 12b) was significantly reduced in the EAO group (39.331 ± 7.355 N/mm, p < 0.05 vs. Cont 66.980 ± 4.208 N/mm) and almost significantly reduced in the adjuvant group (45.886 ± 8.284 N/mm, p = 0.055). Consequently, both immunized groups required less work to fracture compared to control (Figure 12c, EAO 4.277 ± 1.421 N/mm, Adj 5.566 ± 0.390 N/mm, Cont 12.520 ± 1.380 N/mm, p < 0.01 Cont vs. each).
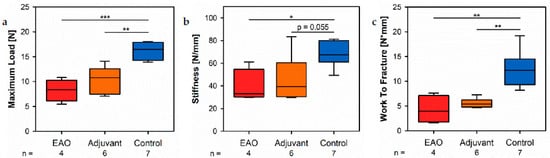
Figure 12. Biomechanical properties of the femora in the three-point bending test. Measurement of (a) maximum load, (b) stiffness and (c) work to fracture. Mice were immunized with testicular homogenate in adjuvant (EAO), adjuvant alone (adjuvant) or remained untreated (control). * p < 0.05; ** p < 0.01; *** p < 0.001.
9. Body Weight
Mice were weighed before the first immunization and 50 days after the first immunization in order to check their general health and well-being. Regarding the initial body weight (Table 1, Body weight before) as well as the body weight before euthanasia (Table 1, Body weight after) no differences between the investigated groups were noticed. Furthermore, all groups significantly gained body weight during the period of 50 days.
Table 1. Body weights before the first immunization and 50 days after the first immunization.
| p-Values | ||||||||
|---|---|---|---|---|---|---|---|---|
| Parameter | Statistic | Unit | EAO (n = 5) |
Adjuvant (n = 6) |
Control (n = 7) |
EAO vs. Adj. | EAO vs. Cont. | Adj. vs. Cont. |
| Body weight before | x¯ | |||||||
| ± SEM | g | 28.820 ± 1.233 | 27.283 ± 1.164 | 28.440 ± 0.680 | 0.978 | 1.000 | 1.000 |
| Body weight after | x¯ |
| ± SEM | g | 30.420 ± 1.283 | 29.783 ± 1.262 | 31.540 ± 0.963 | 1.000 | 1.000 | 0.938 | |
| p-values | before vs. after | 0.020 | 0.001 | 0.016 | ||||
References
- Haidl, G.; Allam, J.P.; Schuppe, H.-C. Chronic epididymitis: Impact on semen parameters and therapeutic options. Andrologia 2008, 40, 92–96.
- Schuppe, H.-C.; Meinhardt, A.; Allam, J.P.; Bergmann, M.; Weidner, W.; Haidl, G. Chronic orchitis: A neglected cause of male infertility? Andrologia 2008, 40, 84–91.
- Schuppe, H.-C.; Pilatz, A.; Hossain, H.; Diemer, T.; Wagenlehner, F.; Weidner, W. Urogenital Infection as a Risk Factor for Male Infertility. Dtsch. Aerzteblatt Int. 2017, 114, 339–346.
- Weidner, W.; Pilatz, A.; Diemer, T.; Schuppe, H.C.; Rusz, A.; Wagenlehner, F. Male urogenital infections: Impact of infection and inflammation on ejaculate parameters. World J. Urol. 2013, 31, 717–723.
- Dohle, G.; Colpi, G.; Hargreave, T.; Papp, G.; Jungwirth, A.; Weidner, W. EAU Guidelines on Male Infertility. Eur. Urol. 2005, 48, 703–711.
- Fijak, M.; Schneider, E.; Klug, J.; Bhushan, S.; Hackstein, H.; Schuler, G.; Wygrecka, M.; Gromoll, J.; Meinhardt, A. Testosterone Replacement Effectively Inhibits the Development of Experimental Autoimmune Orchitis in Rats: Evidence for a Direct Role of Testosterone on Regulatory T Cell Expansion. J. Immunol. 2011, 186, 5162–5172.
- Nicolas, N.; Muir, J.A.; Hayward, S.; Chen, J.L.; Stanton, P.G.; Gregorevic, P.; de Kretser, D.M.; Loveland, K.L.; Bhushan, S.; Meinhardt, A.; et al. Induction of experimental autoimmune orchitis in mice: Responses to elevated circulating levels of the activin-binding protein, follistatin. Reproduction 2017, 154, 293–305.
- Tung, K.S.; Teuscher, C. Mechanisms of autoimmune disease in the testis and ovary. Hum. Reprod. Update 1995, 1, 35–50.
- Fijak, M.; Pilatz, A.; Hedger, M.P.; Nicolas, N.; Bhushan, S.; Michel, V.; Tung, K.S.K.; Schuppe, H.-C.; Meinhardt, A. Infectious, inflammatory and ‘autoimmune’ male factor infertility: How do rodent models inform clinical practice? Hum. Reprod. Update 2018, 24, 416–441.
- Rucker, D.; Ezzat, S.; Diamandi, A.; Khosravi, J.; Hanley, D.A. IGF-I and testosterone levels as predictors of bone mineral density in healthy, community-dwelling men. Clin. Endocrinol. 2004, 60, 491–499.
- Mooradian, A.D.; Morley, J.E.; Korenman, S.G. Biological actions of androgens. Endocr. Rev. 1987, 8, 1–28.
- Clarke, B.L.; Khosla, S. Androgens and bone. Steroids 2009, 74, 296–305.
- Francis, R.M.; Peacock, M.; Aaron, J.E.; Selby, P.L.; Taylor, G.A.; Thompson, J.; Marshall, D.H.; Horsman, A. Osteoporosis in hypogonadal men: Role of decreased plasma 1,25-dihydroxyvitamin D, calcium malabsorption, and low bone formation. Bone 1986, 7, 261–268.
- Rozenberg, S.; Bruyère, O.; Bergmann, P.; Cavalier, E.; Gielen, E.; Goemaere, S.; Kaufman, J.M.; Lapauw, B.; Laurent, M.R.; De Schepper, J.; et al. How to manage osteoporosis before the age of 50. Maturitas 2020, 138, 14–25.
More
Information
Subjects:
Endocrinology & Metabolism
Contributor
MDPI registered users' name will be linked to their SciProfiles pages. To register with us, please refer to https://encyclopedia.pub/register
:
View Times:
729
Revisions:
2 times
(View History)
Update Date:
10 Aug 2021
Table of Contents


Notice
You are not a member of the advisory board for this topic. If you want to update advisory board member profile, please contact office@encyclopedia.pub.
OK
Confirm
Only members of the Encyclopedia advisory board for this topic are allowed to note entries. Would you like to become an advisory board member of the Encyclopedia?
Yes
No
${ textCharacter }/${ maxCharacter }
Submit
Cancel
Back
Comments
${ item }
|
${ item.createdUser.fullName }
${ item.createdAt }
${ item.vote }
${ item.reply }
Delete
${ reply.createdUser.fullName }
${ reply.createdAt }
${ reply.vote }
Delete
There is no reply to this comment~
${ item.replyTextCharacter }/${ item.replyMaxCharacter }
Submit
Cancel
More
No more~
There is no comment~
${ textCharacter }/${ maxCharacter }
Submit
Cancel
${ selectedItem.replyTextCharacter }/${ selectedItem.replyMaxCharacter }
Submit
Cancel
Confirm
Are you sure to Delete?
Yes
No