 +1 credit
| Version | Summary | Created by | Modification | Content Size | Created at | Operation |
|---|---|---|---|---|---|---|
| 1 | Thyago Celso Cavalcante Nepomuceno | + 1826 word(s) | 1826 | 2021-04-28 22:14:10 | | | |
| 2 | Catherine Yang | Meta information modification | 1826 | 2021-04-29 05:09:29 | | | | |
| 3 | Thyago Celso Cavalcante Nepomuceno | Meta information modification | 1826 | 2021-04-30 14:44:25 | | |
Video Upload Options
In the simple words of Peter Drucker, efficiency is doing things right while effectiveness is doing the right things. Efficient and Effective Rankings are ranking classifications for Decision-Making Units (DMUs) based on a combination of the efficiency score (obtained by parametric or non-parametric Data Envelopment Analysis frontier estimations) with a multiple effectiveness measure (often obtained using a Multicriteria Decision Analysis).
This study aims at providing a non-compensatory ranking classification combining Conditional Frontier Analysis with the PROMETHEE II methodology for the multidimensional efficiency and effectiveness analysis of Police. The results on Pernambuco (Brazil) Police departments offer interesting perspectives for public administrations concerning prioritizations of units based on the mitigation of resources and strategic objectives.
1. Introduction
The sustainable development of a society requires the optimal usage of resources for the provision of goods and services and the ability to reach the desired social goals. Efficiency can be defined as the capacity to avoid wasting materials, resources, efforts, or time to produce a result or outcome. This concept is strictly related to sustainability. On the other hand, effectiveness can be defined as the ability of producing a desired result. This concept is strictly related to quality. In the simple words of Peter Drucker, efficiency is doing things right while effectiveness is doing the right things. These two perspectives are not always walking in the same direction and their potential conflict can jeopardize some of the promising prospects of sustainable service provisions, especially considering public administrations[1].
There is a recurrent trade-off between quality and efficiency in many empirical assessments [2][3][4]. Lo Storto [5], investigating the relationship between efficiency and effectiveness of public expenditure in 108 major Italian municipalities, suggests shreds of evidence for this trade-off involving public service quality indicators (expenditure effectiveness) and DEA measures for cost-efficiencies. Nepomuceno et al. [6], using the Complexity of Needs Model to investigate 88 public and private health service units in Pernambuco, Brazil, also offer support in addition to this discussion. According to the authors, most hospitalization-efficient units are crowded public hospitals working at full capacity most of the year, which can only meet all the demand for hospitalizations (the output in the analysis) by compromising the service's quality.
Some composite indicators, such as the Civil Society Organization Sustainability Index developed by the United States Agency for International Development, offer an interesting methodology for measuring civil society's short-term quality in implementing development solutions and long-term achievement of sustainable outcomes. The index, which ranges from 1 (enhanced sustainability) to 7 (impeded sustainability), evaluates the legal environment, organizational capacity, financial viability, advocacy, service provision, sectorial infrastructure and public image of 82 countries. Other composite methodologies considering multiple perspectives for ranking regions are also provided in the scientific literature [7][8][9].
Ranking Decision-Making Units (DMUs) according to their productive performance has been the objective of Data Envelopment Analysis (DEA) applications in many sectors of economic activities for classifying both efficient and inefficient units[10][11][12]. Ranking service units provide valuable discriminations that support strategic decision-making by creating incentive structures for rewarding efficient managers, teams, resource allocations, recognizing prospective policies and best practices, changing misleading business competencies, operations, and activities, and developing sustainable directions for continuous improvement. It also offers clear information for taxpayers and society on investments' returns regarding public and state companies. Ranking police units under the influence of different environments, subjective value judgments, contexts and exogenous potentials of policing and criminality is challenging in the field of nonparametric efficiency analysis due to the stochastic nature of criminal occurrences.
Ranking service units also requires much effort in defining quality standards for the organization's products and services. Such a prospect is not limited to measuring decision units' technical efficiency with projections for how much outputs can be expanded and inputs contracted toward the industry's production capacity. It also extends to measuring how effective the decision unit is in achieving predefined objectives, which is strictly related to the quality of products and services. Multicriteria Decision Aid (MCDA) methods are a valuable source for systematic ranking multiple alternatives based on decision criteria weighted and evaluated by one or many decision-makers and stakeholders.
2. Methodology
Many DEA ranking methods in the Productive and Efficiency Analysis literature are considered post-analysis approaches[12]. The framework illustrated in Figure 1 can be situated in this classification. Four sub-ranks are constructed through pairwise comparisons. Compensations between efficiency and effectiveness are restricted with the imposition of vetoes for clustering effective/ineffective and efficient/inefficient alternatives (municipalities). The municipality is top-ranked when it is sufficiently effective according to the predefined objective and efficient in using the available resources to produce clear-ups for the specified felonies and misdemeanors. The second sub-rank has effective but not efficient municipalities, i.e., excellent efficiency prospects cannot offset poor effectiveness. If the municipality is efficient in using the available resources to solve crimes but is not effective in reaching the specified institutional goal, it is located in the third sub-rank with similar municipalities. The last sub-rank has both ineffective and inefficient units. The PROMETHEE II net flow coefficient outranks the units in each sub-rank of this framework.
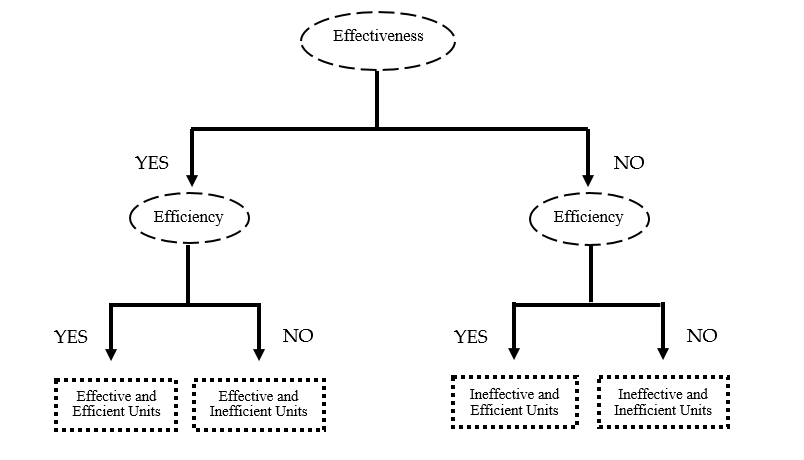 Figure 1. Framework for the Non-compensatory Ranking Methodology.
3. Data, Application and Discussion
Data regarding the number of police officers (input) and inquiries with the definition of responsibility (clear-ups) for three types of felonies (output), and the corresponding occurrences (Violent Crime, Street Mugging and Carjack) in 145 of the 185 Pernambuco cities were provided by the Secretariat for Social Defence (SDS-PE) [13]. The criminal occurrences are the environmental factors conditioning the directional efficiency of the police departments. Adequacy of this data can find support in similar assessments of police efficiency [14]. Table 1 and Figure 1 summarize the main descriptive data information.
Table 1. Data Descriptive Statistics.
|
Variable |
Total |
Min. |
Max. |
Median |
Mean |
1st Q. |
3rd Q. |
Std. Dev. |
|
Input |
||||||||
|
Officers |
1430 |
3.000 |
48.000 |
8.000 |
9.862 |
6.000 |
11.000 |
6.36 |
|
Outputs |
||||||||
|
Violent Crime |
1212 |
0.000 |
42.000 |
5.000 |
8.359 |
3.000 |
11.000 |
9.24 |
|
Street Mugging |
1334 |
0.0 |
79.0 |
5.0 |
9.2 |
1.0 |
10.0 |
13.24 |
|
Carjacking |
298 |
0.000 |
25.000 |
1.000 |
2.055 |
0.000 |
2.000 |
3.89 |
|
Environmental Factors |
||||||||
|
Violent Crime |
2905 |
0.00 |
198.00 |
13.00 |
20.03 |
7.00 |
26.00 |
23.94 |
|
Street Mugging |
20890 |
2.0 |
2198.0 |
42.0 |
144.1 |
19.0 |
135.0 |
300.9 |
|
Carjacking |
10180 |
1.00 |
1161.00 |
25.00 |
70.21 |
11.00 |
63.00 |
127.92 |
The following tables report the overall Policing Effectiveness-Efficiency application for a non-compensatory ranking of 145 Pernambuco's municipalities described in the methodology. According to the results, none of the three completely efficient units (i.e., efficient in all three output models) are ineffective. For this reason, we have 3 sub-rankings instead of 4, as illustrated in Figure 1. The tables provide information on the non-compensatory compared to the compensatory ranking position, i.e., when the municipalities are all outranked in the same group without the imposition of effectiveness or efficiency vetoes. The Net Flow parameter is used to outranking the units in each sub-rank.
Table 2. Effective and Efficient Units.
|
Position |
Compensatory Position |
DMUs |
Net Flow |
Effectiveness |
Relative Inefficiency |
|
1 |
18 |
Jucati |
0.456 |
0.333 |
0.000 |
|
2 |
37 |
Saloá |
0.279 |
0.250 |
0.000 |
|
3 |
69 |
Camocim de São Félix |
0.006 |
0.154 |
0.000 |
Table 3. Effective and Inefficient Units.
|
Position |
Compensatory Position |
DMUs |
Net Flow |
Effectiveness |
Relative Inefficiency |
|
4 |
2 |
Cumaru |
0.778 |
1.000 |
0.250 |
|
5 |
4 |
Lagoa do Ouro |
0.686 |
0.600 |
0.333 |
|
6 |
10 |
Água Preta |
0.579 |
0.500 |
0.333 |
|
7 |
11 |
Itaquitinga |
0.545 |
0.444 |
0.200 |
|
8 |
19 |
Terezinha |
0.452 |
0.600 |
0.400 |
|
9 |
26 |
Calçado |
0.363 |
0.500 |
0.389 |
|
10 |
32 |
Jataúba |
0.315 |
0.286 |
0.167 |
|
11 |
35 |
Joaquim Nabuco |
0.284 |
0.500 |
0.381 |
|
12 |
36 |
Correntes |
0.281 |
0.333 |
0.250 |
|
13 |
40 |
Jatobá |
0.219 |
0.500 |
0.476 |
|
14 |
45 |
Moreilândia |
0.205 |
0.667 |
0.541 |
|
15 |
46 |
Catende |
0.195 |
0.432 |
0.466 |
|
16 |
47 |
Canhotinho |
0.193 |
0.250 |
0.200 |
|
17 |
60 |
Quipapá |
0.063 |
0.500 |
0.541 |
|
18 |
61 |
Araçoiaba |
0.060 |
0.422 |
0.500 |
|
19 |
62 |
Petrolândia |
0.053 |
0.400 |
0.458 |
|
20 |
67 |
Tabira |
0.014 |
0.444 |
0.444 |
|
21 |
68 |
Santa Cruz |
0.010 |
0.400 |
0.500 |
|
22 |
71 |
São Caitano |
-0.006 |
0.187 |
0.259 |
|
23 |
76 |
Mirandiba |
-0.033 |
0.500 |
0.545 |
|
24 |
78 |
Jaqueira |
-0.039 |
0.272 |
0.428 |
|
25 |
79 |
Amaraji |
-0.042 |
0.300 |
0.466 |
|
26 |
80 |
Ipubi |
-0.051 |
0.307 |
0.444 |
|
27 |
85 |
Lagoa de Itaenga |
-0.076 |
0.166 |
0.190 |
|
28 |
87 |
Agrestina |
-0.083 |
0.333 |
0.444 |
|
29 |
90 |
Riacho das Almas |
-0.098 |
0.250 |
0.428 |
|
30 |
91 |
Custódia |
-0.103 |
0.4545 |
0.566 |
|
31 |
93 |
Ouricuri |
-0.124 |
0.500 |
0.648 |
|
32 |
96 |
Tamandaré |
-0.157 |
0.347 |
0.533 |
|
33 |
107 |
Floresta |
-0.259 |
0.181 |
0.393 |
|
34 |
109 |
Angelim |
-0.282 |
0.200 |
0.400 |
|
35 |
110 |
Brejo da Madre de Deus |
-0.293 |
0.355 |
0.545 |
|
36 |
111 |
Águas Belas |
-0.295 |
0.136 |
0.296 |
|
37 |
116 |
Palmares |
-0.328 |
0.232 |
0.375 |
|
38 |
119 |
Bom Conselho |
-0.364 |
0.250 |
0.444 |
|
39 |
121 |
Belém de Maria |
-0.375 |
0.200 |
0.428 |
|
40 |
125 |
Cortês |
-0.404 |
0.125 |
0.333 |
|
41 |
127 |
Araripina |
-0.423 |
0.166 |
0.461 |
|
42 |
128 |
Aliança |
-0.438 |
0.210 |
0.500 |
|
43 |
135 |
Toritama |
-0.577 |
0.152 |
0.500 |
|
44 |
138 |
João Alfredo |
-0.586 |
0.142 |
0.515 |
|
45 |
140 |
Sertânia |
-0.599 |
0.181 |
0.518 |
Table 4. Ineffective and Inefficient Units.
|
Position |
Compensatory Position |
DMUs |
Net Flow |
Effectiveness |
Relative Inefficiency |
|
46 |
1 |
Paranatama |
0.819 |
0.000 |
0.166 |
|
47 |
3 |
Jupi |
0.761 |
0.000 |
0.0555 |
|
48 |
5 |
Goiana |
0.681 |
0.000 |
0.288 |
|
49 |
6 |
Santa Terezinha |
0.597 |
0.000 |
0.333 |
|
50 |
7 |
Venturosa |
0.586 |
-0.166 |
0.208 |
|
51 |
8 |
Sanharó |
0.586 |
-0.111 |
0.166 |
|
52 |
9 |
Casinhas |
0.583 |
-0.182 |
0.166 |
|
53 |
12 |
Lajedo |
0.542 |
-0.107 |
0.091 |
|
54 |
13 |
Iati |
0.540 |
-0.166 |
0.266 |
|
55 |
14 |
Bezerros |
0.529 |
0.020 |
0.354 |
|
56 |
15 |
Nazaré da Mata |
0.512 |
0.100 |
0.424 |
|
57 |
16 |
Escada |
0.459 |
-0.021 |
0.411 |
|
58 |
17 |
Ribeirão |
0.456 |
0 |
0.416 |
|
59 |
20 |
Cabo de Santo Agostinho |
0.443 |
-0.294 |
0.144 |
|
60 |
21 |
Macaparana |
0.429 |
-0.111 |
0.375 |
|
61 |
22 |
Brejão |
0.392 |
-0.166 |
0.333 |
|
62 |
23 |
Feira Nova |
0.378 |
0.000 |
0.375 |
|
63 |
24 |
Camutanga |
0.377 |
0.000 |
0.444 |
|
64 |
25 |
Tuparetama |
0.377 |
0.000 |
0.444 |
|
65 |
27 |
Cupira |
0.351 |
-0.464 |
0.111 |
|
66 |
28 |
Vitória de Santo Antão |
0.339 |
-0.430 |
0.166 |
|
67 |
29 |
Limoeiro |
0.336 |
-0.227 |
0.111 |
|
68 |
30 |
Vertentes |
0.335 |
-0.315 |
0.285 |
|
69 |
31 |
Camaragibe |
0.318 |
-0.277 |
0.363 |
|
70 |
33 |
Itambé |
0.314 |
-0.111 |
0.416 |
|
71 |
34 |
Itaíba |
0.310 |
0.000 |
0.476 |
|
72 |
38 |
Ferreiros |
0.277 |
-0.333 |
0.166 |
|
73 |
39 |
Barreiros |
0.265 |
-0.304 |
0.333 |
|
74 |
41 |
Capoeiras |
0.219 |
-0.333 |
0.333 |
|
75 |
42 |
Sairé |
0.209 |
-0.143 |
0.381 |
|
76 |
43 |
Belo Jardim |
0.205 |
-0.589 |
0.143 |
|
77 |
44 |
Timbaúba |
0.205 |
-0.307 |
0.372 |
|
78 |
48 |
Caetés |
0.193 |
-0.363 |
0.333 |
|
79 |
49 |
Serrita |
0.189 |
0.000 |
0.518 |
|
80 |
50 |
Taquaritinga do Norte |
0.176 |
-0.500 |
0.333 |
|
81 |
51 |
Rio Formoso |
0.155 |
-0.176 |
0.466 |
|
82 |
52 |
Sirinhaém |
0.155 |
-0.518 |
0.200 |
|
83 |
53 |
Pesqueira |
0.138 |
-0.272 |
0.285 |
|
84 |
54 |
Trindade |
0.122 |
-0.210 |
0.407 |
|
85 |
55 |
Machados |
0.090 |
-0.666 |
0.277 |
|
86 |
56 |
Arcoverde |
0.086 |
-0.090 |
0.529 |
|
87 |
57 |
São José do Egito |
0.080 |
0.000 |
0.545 |
|
88 |
58 |
Santa Maria da Boa Vista |
0.077 |
-0.090 |
0.547 |
|
89 |
59 |
Ibimirim |
0.074 |
-0.071 |
0,555 |
|
90 |
63 |
São Bento do Una |
0.046 |
-0.280 |
0.500 |
|
91 |
64 |
Passira |
0.041 |
-0.333 |
0.388 |
|
92 |
65 |
Belém do São Francisco |
0.031 |
0.000 |
0.606 |
|
93 |
66 |
São Vicente Ferrer |
0.019 |
-0.545 |
0.285 |
|
94 |
70 |
Tupanatinga |
-0.002 |
-0.444 |
0.428 |
|
95 |
72 |
Serra Talhada |
-0.014 |
-0.025 |
0.597 |
|
96 |
73 |
Paudalho |
-0.017 |
-0.115 |
0.463 |
|
97 |
74 |
Afrânio |
-0.020 |
-0.500 |
0.388 |
|
98 |
75 |
São João |
-0.021 |
-1.000 |
0.200 |
|
99 |
77 |
São Benedito do Sul |
-0.037 |
-1.500 |
0.166 |
|
100 |
81 |
Vicência |
-0.053 |
-0.647 |
0.407 |
|
101 |
82 |
Panelas |
-0.054 |
-0.727 |
0.375 |
|
102 |
83 |
São Joaquim do Monte |
-0.063 |
-1.900 |
0.133 |
|
103 |
84 |
Lagoa Grande |
-0.069 |
-1.000 |
0.333 |
|
104 |
86 |
Lagoa do Carro |
-0.080 |
-1.375 |
0.208 |
|
105 |
88 |
Carpina |
-0.083 |
-0.551 |
0.283 |
|
106 |
89 |
Gameleira |
-0.089 |
-0.529 |
0.407 |
|
107 |
92 |
Barra de Guabiraba |
-0.121 |
-1.166 |
0.333 |
|
108 |
94 |
Bonito |
-0.133 |
-1.416 |
0.250 |
|
109 |
95 |
Santa Cruz do Capibaribe |
-0.142 |
-0.288 |
0.473 |
|
110 |
97 |
Salgueiro |
-0.168 |
-0.150 |
0.636 |
|
111 |
98 |
Tracunhaém |
-0.172 |
-0.375 |
0.444 |
|
112 |
99 |
Bom Jardim |
-0.173 |
-1.154 |
0.333 |
|
113 |
100 |
Chã Grande |
-0.174 |
-0.666 |
0.388 |
|
114 |
101 |
Tacaimbó |
-0.174 |
-0.666 |
0.388 |
|
115 |
102 |
Primavera |
-0.175 |
-0.571 |
0.444 |
|
116 |
103 |
Moreno |
-0.184 |
-0.311 |
0.388 |
|
117 |
104 |
Vertente do Lério |
-0.207 |
-1.333 |
0.333 |
|
118 |
105 |
Altinho |
-0.210 |
-1.500 |
0.200 |
|
119 |
106 |
Surubim |
-0.214 |
-0.421 |
0.509 |
|
120 |
108 |
São José da Coroa Grande |
-0.263 |
-1.277 |
0.407 |
|
121 |
112 |
Xexéu |
-0.295 |
-0.714 |
0.458 |
|
122 |
113 |
Buíque |
-0.299 |
-0.900 |
0.407 |
|
123 |
114 |
Palmeirina |
-0.301 |
-1.000 |
0.4 |
|
124 |
115 |
Iguaraci |
-0.306 |
-1.000 |
0.333 |
|
125 |
117 |
Flores |
-0.338 |
-0.333 |
0.600 |
|
126 |
118 |
Orobó |
-0.349 |
-3.000 |
0.333 |
|
127 |
120 |
São Lourenço da Mata |
-0.368 |
-0.444 |
0.433 |
|
128 |
122 |
São José do Belmonte |
-0.381 |
-0.375 |
0.600 |
|
129 |
123 |
Orocó |
-0.390 |
-1.200 |
0.444 |
|
130 |
124 |
Betânia |
-0.400 |
-1.000 |
0.476 |
|
131 |
126 |
Condado |
-0.421 |
-2.000 |
0.380 |
|
132 |
129 |
Glória do Goitá |
-0.485 |
-0.800 |
0.500 |
|
133 |
130 |
Alagoinha |
-0.500 |
-2.000 |
0.388 |
|
134 |
131 |
Cabrobó |
-0.518 |
-1.000 |
0.431 |
|
135 |
132 |
Terra Nova |
-0.543 |
-2.000 |
0.444 |
|
136 |
133 |
Parnamirim |
-0.557 |
-0.833 |
0.566 |
|
137 |
134 |
Itapissuma |
-0.577 |
-0.833 |
0.583 |
|
138 |
136 |
Exu |
-0.584 |
-1.600 |
0.500 |
|
139 |
137 |
Tacaratu |
-0.585 |
-4.000 |
0.444 |
|
140 |
139 |
Gravatá |
-0.587 |
-1.000 |
0.500 |
|
141 |
141 |
Carnaíba |
-0.637 |
-3.000 |
0.4762 |
|
142 |
142 |
Chã de Alegria |
-0.647 |
-1.500 |
0.500 |
|
143 |
143 |
Bodocó |
-0.710 |
-1.333 |
0.566 |
|
144 |
144 |
Pombos |
-0.727 |
-1.571 |
0.500 |
|
145 |
145 |
Afogados da Ingazeira |
-0.780 |
-1.333 |
0.608 |
The effectiveness is measured in how much the municipality has reached the target of 12% reduction in homicides (so more is preferable, but 0.12 is sufficient). The last column for the relative inefficiency aggregates each unit's relative inefficiency scores for all the three models considering the slacks (so less is preferable and zero means the unit is efficient in all three models, with no slack for police officers). It is interesting how different the non-compensatory top-ranked municipalities would feature in a compensatory evaluation. Jucati, the first top-ranked municipality, is a small city in the agreste pernambucano (rural / wasteland region) of about 11 thousand residents and a population density of 87.92 per km². It had 4 officers as input along the year, 4 homicide occurrences (all solved), 12 street mugging (10 solved) and 15 carjackings (8 recovered). The municipality reduced from 9 homicides in 2015 to 6 homicides in 2016 (about 33% reduction) and from 6 homicides in 2016 to 4 homicides in 2017 (about 33% reduction).
When compared to the first effective but not efficient unit (Cumaru, Table 2) we can observe the compensation effect: because Cumaru, another small city in Pernambuco, could reduce the homicides entirely in the year of evaluation (from 2 to zero, 100% effectiveness, w = 0,5208333) this more than compensates a poor efficiency performance (25% relative inefficiency), locating this municipality in the second position in the Compensatory Ranking, and Jucati in the 18º. Compensations of this nature can be observed all over the rankings. Non-compensatory / Compensatory ranking inversions are even bigger for Saloá (2 compared to 37) and Camocim de São Félix (3 compared to 69). The Non-compensatory ranking of units in this assessment tends to provide a fairer evaluation in line with what is expected by the policymaker.
The entry is from 10.3390/su13084251
References
- Thyago Nepomuceno; Cinzia Daraio; Ana Costa; Multicriteria Ranking for the Efficient and Effective Assessment of Police Departments. Sustainability 2021, 13, 4251, 10.3390/su13084251.
- Daraio, C., Simar, L. & Paul W.; Quality as a Latent Heterogeneity Factor in the Efficiency of Universities. Economic Modelling 2021, 99 (2021), 105485.
- Clara E. Dismuke; Vania Sena; Is there a Trade-Off between Quality and Productivity? The Case of Diagnostic Technologies in Portugal. Annals of Operations Research 2000, 107, 101-116, 10.1023/a:1014946914816.
- S. Nuti; C. Daraio; C. Speroni; M. Vainieri; Relationships between technical efficiency and the quality and costs of health care in Italy. International Journal for Quality in Health Care 2011, 23, 324-330, 10.1093/intqhc/mzr005.
- Corrado Lo Storto; The trade-off between cost efficiency and public service quality: A non-parametric frontier analysis of Italian major municipalities. Cities 2015, 51, 52-63, 10.1016/j.cities.2015.11.028.
- Thyago C. C. Nepomuceno; Wilka M. N. Silva; Késsia T. C. Nepomuceno; Isloana K. F. Barros; A DEA-Based Complexity of Needs Approach for Hospital Beds Evacuation during the COVID-19 Outbreak. Journal of Healthcare Engineering 2020, 2020, 1-9, 10.1155/2020/8857553.
- Francisco Ruiz; José Cabello; MRP-PCI: A Multiple Reference Point Based Partially Compensatory Composite Indicator for Sustainability Assessment. Sustainability 2021, 13, 1261, 10.3390/su13031261.
- Rosane Seibert; Clea Macagnan; Robert Dixon; Priority Stakeholders’ Perception: Social Responsibility Indicators. Sustainability 2021, 13, 1034, 10.3390/su13031034.
- Carolina Lino Martins; Hipólito Marcelo Losada López; Adiel Teixeira de Almeida; Jonatas Araújo Almeida; Mirian Batista De Oliveira Bortoluzzi; An MCDM project portfolio web-based DSS for sustainable strategic decision making in an electricity company. Industrial Management & Data Systems 2017, 117, 1362-1375, 10.1108/imds-09-2016-0412.
- Cinzia Daraio; Kristiaan Kerstens; Thyago Nepomuceno; Robin C. Sickles; Empirical surveys of frontier applications: a meta-review. International Transactions in Operational Research 2019, 27, 709-738, 10.1111/itor.12649.
- Thyago Celso C. Nepomuceno; Cinzia Daraio; Ana Paula C. S. Costa; Theoretical and Empirical Advances in the Assessment of Productive Efficiency since the introduction of DEA: A Bibliometric Analysis. International Journal of Operational Research 2021, 1, xxx, 10.1504/ijor.2020.10035180.
- Abdullah Aldamak; Saeed Zolfaghari; Review of efficiency ranking methods in data envelopment analysis. Measurement 2017, 106, 161-172, 10.1016/j.measurement.2017.04.028.
- Thyago Celso Cavalcante Nepomuceno; Katarina Tatiana Marques Santiago; Cinzia Daraio; Ana Paula Cabral Seixas Costa; Exogenous crimes and the assessment of public safety efficiency and effectiveness. Annals of Operations Research 2020, xxx, 1-34, 10.1007/s10479-020-03767-6.
- Thyago Celso Cavalcante Nepomuceno; Katarina Tatiana Marques Santiago; Cinzia Daraio; Ana Paula Cabral Seixas Costa; Exogenous crimes and the assessment of public safety efficiency and effectiveness. Annals of Operations Research 2020, 2020, 1-34, 10.1007/s10479-020-03767-6.


