 +1 credit
| Version | Summary | Created by | Modification | Content Size | Created at | Operation |
|---|---|---|---|---|---|---|
| 1 | Omar Israel Gonzalez Peña | + 1673 word(s) | 1673 | 2021-04-25 10:08:19 | | | |
| 2 | Karina Chen | Meta information modification | 1673 | 2021-05-08 03:18:15 | | |
Video Upload Options
Pharmaceuticals enhance our quality of life; consequently, their consumption is growing as a result of the need to treat ageing-related and chronic diseases and changes in the clinical practice. The market revenues also show an historic growth worldwide motivated by the increase on the drug demand. However, this positivism on the market is fogged because the discharge of pharmaceuticals and their metabolites into the environment, including water, also increases due to their inappropriate management, treatment and disposal; now, worldwide, this fact is recognized as an environmental concern and human health risk.
1. Global Pharmaceutical Market Revenue Distribution
Recently, the pharmaceutical market worldwide has significantly increased. In 2019, the value of the market was on the order of USD 1.25 trillion, in comparison to USD 390 billion in 2001 (Figure 1). The manner by which people obtains and pays for medicine is driven by the pharmaceutical market; however, pharmaceutical companies are well aware that some markets are better than others [1].
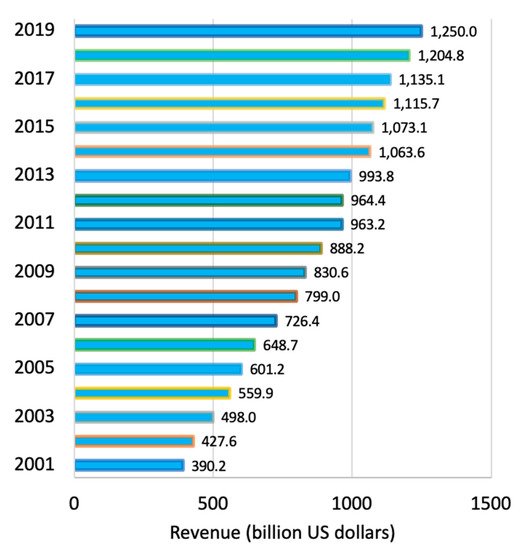
Figure 1. Global pharmaceutical revenue from 2001 to 2019 [1].
North America is the region with the largest portion of pharmaceutical revenue (48.9%), and the US is still leading the pharmaceutical market; however, recently, a group of emerging markets is playing an important role. Emergent economies such as those of Brazil, India, Russia, Colombia, and Egypt are examples of such markets. Despite the participation of Latin American countries in the increasing market, their contribution to global revenue remains insignificant. In contrast, the Chinese pharmaceutical industry has shown the highest growth rates during recent years. Figure 2 shows the projected global pharmaceutical sales for 2022 by region [1]. Much of this prediction lies in the fact that the main pharmaceutical companies that produce drugs are in the regions where the greatest growth is expected as Figure 3 indicates.
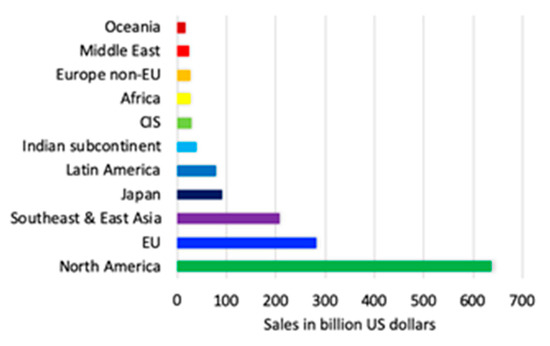
Figure 2. Projected global pharmaceutical sales for 2022 by region [1].
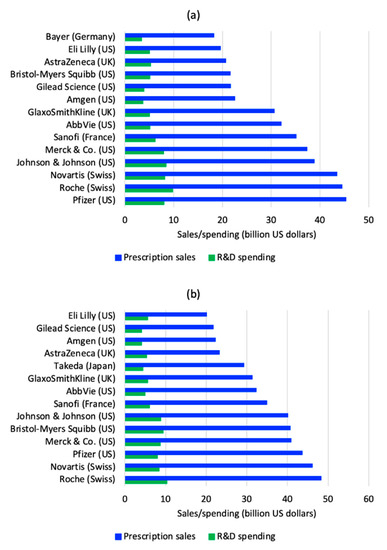
Figure 3. Top global pharmaceutical companies by sales and R&D spending in 2018 (a); and 2019 (b) [1].
2. Companies and Products
European and American companies remain the leaders of the pharmaceutical market. In 2019, Roche was the company with the largest pharmaceutical revenue on the order of 48.3 billion USD and the top based on research and development (R&D) with 10.3 billion USD; while, in 2018 Pfizer was the world’s largest company with pharmaceutical sales of 45.3 billion USD and 7.96 billion USD on R&D spending and its products were available in more than 125 countries. In 2019, Novartis overcame Pfizer with 46.09 billion USD on sales and 8.39 billion USD on R&D spending. Besides Pfizer (43.66 billion USD on sales and 7.99 billion USD on R&D), other important companies from the US were Merck & Co. (40.90 billion USD on revenue), Bristol-Myers Squibb (40.69 billion USD on sales) and Johnson & Johnson (40.08 billion US dollars of revenue). In Europe, besides Roche and Novartis in Switzerland, Sanofi in France, GlaxoSmithKline and AstraZeneca in the United Kingdom (UK) were the leaders. Surely the report of 2020, will present important changes level of revenues and R&D spending due to the COVID pandemic. Figure 3 shows the top 14 global pharmaceutical companies by sales and R&D spending in 2018 and 2019 [1]. The figure reveals important changes from a year to another and much difference in drug sales among the largest companies in the world; however, the investment they have for R&D does not reflect much discrepancy.
The largest share of pharmaceutical revenue corresponds to branded and patented medicines. Amongst therapeutic drugs, oncologic, antidiabetic, respiratory, autoimmune disease, and antibiotic and vaccine drugs are the top pharmaceuticals generating approximately USD 100 billion, 79 billion, 61 billion, 54 billion and 41 billion, respectively, in 2018 (Figure 4). Individually, the most important pharmaceutical products for revenue generation are Humira (AbbVie, anti-inflammatory), which generated approximately 20 billion USD in 2018; Eliquis (BS/Pfizer, anticoagulant), which produced 9.9 billion USD; and Revlimid (Celgene, immunomodulator agent), which generated 9.7 billion USD. Figure 5 presents the top 15 pharmaceutical products by sales worldwide in 2018 [1]. Most of the companies invest in R&D between 5 and 10 billion USD. However, Humira (AbbVIe) is the one with the highest investment in the U.S. by doubling the amount (20 billion USD) compared to the second place.
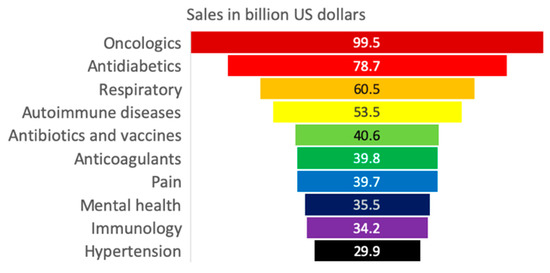
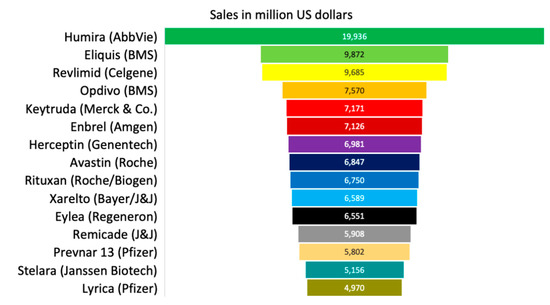
Figure 5. Top pharmaceutical products by sales worldwide in 2018 [1].
Amongst all industries, the pharmaceutical industry has the largest investment on R&D. Such spending involves identification and development of compounds for new drugs, and it is increasing throughout the world over time. Worldwide, the largest number of new compounds and pharmaceuticals between 2013 and 2017 was generated by the US pharmaceutical industry, followed by that of Europe. Figure 6 shows the number of new chemical or biological entities developed between 1992 and 2018, by region of origin [1].
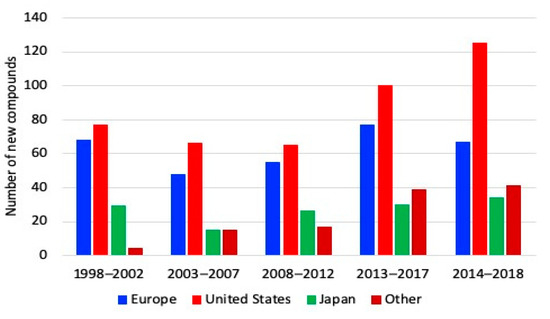
Figure 6. New chemical and biological entities developed between 1992 and 2018 [1].
Figure 6 shows that in the period 1998–2002 the Europe and the U.S. developed approximately the same number of compounds in a quantity slightly less than 80. However, the U. S. enhanced the production of new compounds at a higher rate than other regions from 2013. As a result, the U.S. production is around 130 new compounds while Europe remained approximately constant in recent years. This increase has reflected that the U.S. increased its sales compared to other regions. Between 2015 and 2019, the same trend is observed, American companies produced 120 new chemical and biological substances; while Europe and Japan introduced 58 and 36 new products, respectively.
3. Pharmaceutical Consumption
Similar to the market, worldwide the consumption of pharmaceuticals continues increasing due to changes in clinical practices and the growing demand for drugs for treating ageing-related and chronic diseases. Four groups of pharmaceuticals are the most relevant: cholesterol-lowering, antidepressant, antihypertensive and antidiabetic drugs [2].
In OECD countries, the consumption of cholesterol-lowering drugs nearly quadrupled from 2000 to 2017, as shown in Figure 7. In the OECD countries, an eightfold variation in consumption levels of cholesterol-lowering drugs can be observed; United Kingdom (UK), Denmark, Belgium and Norway had the highest consumption per capita in 2017 [2].
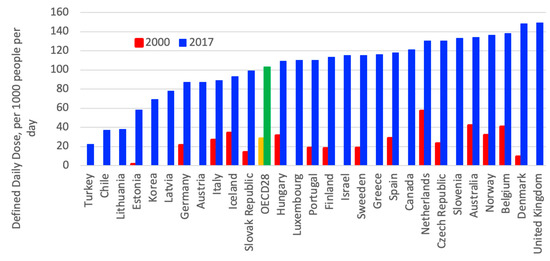
Figure 7. Consumption of cholesterol-lowering drugs in Organization for Economic Cooperation and Development (OECD) countries from 2000 to 2017 [2].
Use of antidepressant drugs doubled in OECD countries between 2000 and 2017 as driven by the recognition of depression, therapeutic treatment, guidelines and changes in patient and provider attitudes [2][3], as shown in Figure 8. However, between countries, a significant variation in consumption of antidepressant can be observed; in 2017, Iceland, Canada, Australia, and the UK had the highest consumption levels, while Latvia, Korea, Hungary and Estonia had the lowest consumption levels [2].
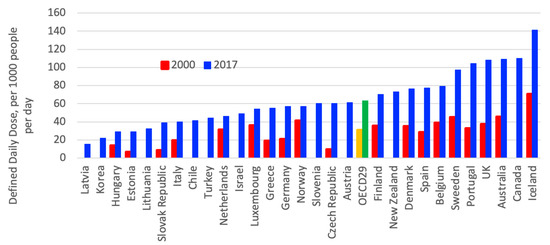
Figure 8. Consumption of antidepressant drugs in OECD countries between 2000 and 2015 [2].
Antihypertensive pharmaceutical consumption nearly doubled in OECD countries from 2000 to 2017, with the highest use occurring in Germany and Hungary at five times the consumption levels of Korea and Turkey (Figure 9). In Luxemburg and Estonia, the consumption levels have nearly quadrupled. These remarkable variations are a consequence of differences in the prevalence of high blood pressure and clinical practices [2].
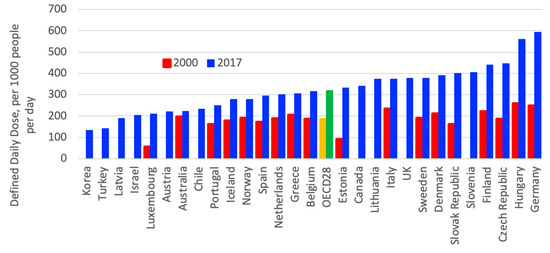
Figure 9. Consumption of antihypertensive pharmaceuticals in OECD countries from 2000 to 2017 [2].
The use of antidiabetic drugs approximately doubled in OECD countries between 2000 and 2017; Finland, the Czech Republic, Canada, UK, Germany, and Slovenia have the highest consumption, as shown in Figure 10. This increasing consumption can be explained by the increasing prevalence of diabetes and obesity [2].
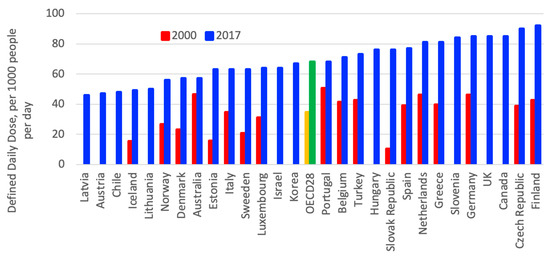
Figure 10. Consumption of antidiabetic drugs in OECD countries from 2000 to 2017 [2].
Regarding the consumption of pharmaceuticals per region, drug consumption varies from region to region; however, some similarities can be observed. The differences and similarities reflect genetic, lifestyle and food diet composition differences and probably differences in food access depending on the population’s economy. From a list of 28 groups of pharmaceuticals, the following analysis was conducted per region. In Europe, the most consumed groups of pharmaceuticals are those treating cardiovascular system, alimentary tract and metabolism, nervous system, agents acting on the renin–angiotensin system and blood and blood-forming organs, whereas antacids are the less commonly consumed. Notably, since 2015, an important reduction in the consumption of all pharmaceuticals has been observed (Figure 11) [2].
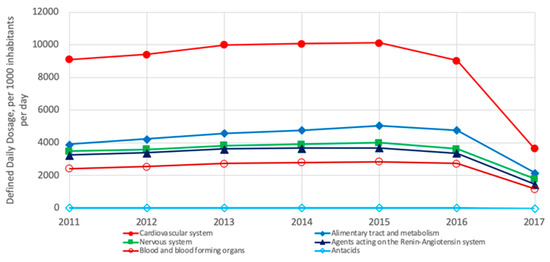
Figure 11. Most consumed pharmaceuticals in OECD European countries from 2011 to 2017 [2]. Drugs for treating the cardiovascular system are most consumed in both regions [2].
In North America (US and Canada), the five most commonly consumed groups of drugs are those for treating the cardiovascular system, agents acting on the renin-angiotensin system, nervous system, alimentary tract and metabolism and lipid-modifying agents; meanwhile, the cardiac glycosides are less commonly consumed (Figure 12). As shown, the four groups of pharmaceuticals are also the most consumed in Europe but in a different order of consumption.
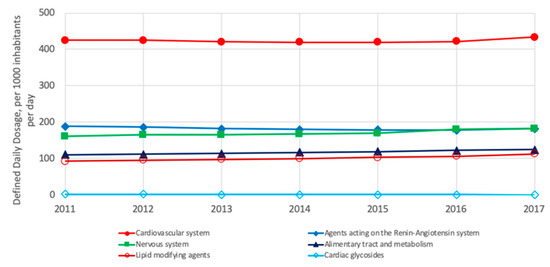
Figure 12. Most consumed pharmaceuticals in the US and Canada between 2011 and 2017 [2].
Similar to Europe and North America, in Asia, the most commonly consumed group of pharmaceuticals is that to treat the alimentary tract and metabolism; additionally, drugs for the cardiovascular system, blood and blood-forming organs, nervous system and respiratory system are amongst the most commonly consumed, whereas the cardiac glycoside group is less commonly consumed (Figure 13) [2].
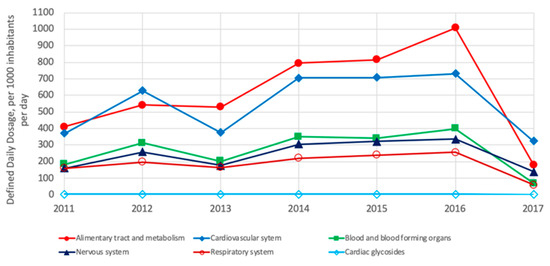
Figure 13. Most consumed pharmaceuticals in OECD Asian countries from 2011 to 2017 [2].
Similar to Europe and North America, in Oceania (Australia and New Zealand), the most commonly consumed groups of drugs are those for treating the cardiovascular system, nervous system and alimentary tract and metabolism; additionally, lipid-modifying agents and agents acting on the renin-angiotensin system are also amongst the most used. In contrast, a less commonly consumed drug group is the antiarrhythmics (Figure 14) [2].
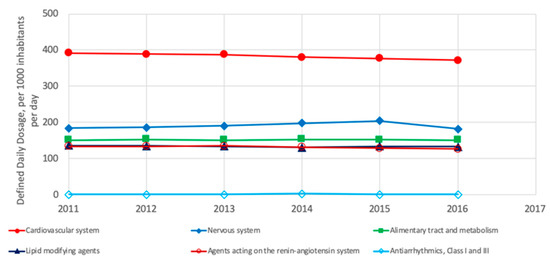
Figure 14. Most consumed pharmaceuticals in Australia and New Zeeland between 2011 and 2017 [2].
In Latin America, the most consumed pharmaceuticals are agents acting on the renin-angiotensin system, as well as diuretics, drugs used in diabetes, lipid-modifying agents and antidepressants, whereas the antihypertensives are less commonly consumed (Figure 15) [2]. Notably, the analysis for Latin America is not conclusive because limited data are available.
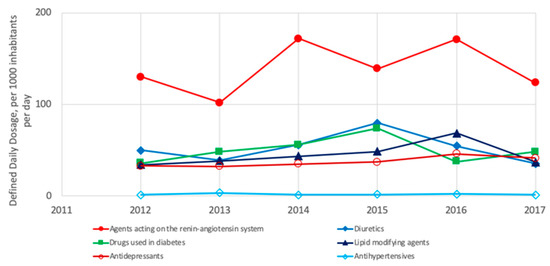
Figure 15. Most consumed pharmaceuticals in OECD Latin American countries from 2011 to 2017 [2].
Regarding the consumption of generic pharmaceuticals in OECD countries, in 2017, generics represented more than three-quarters of the total volume consumed in the UK, Chile, Germany and New Zealand, while it represented less than one-quarter in Luxembourg and Switzerland (Figure 16). Some of the differences can be explained by the market structures, number of off-patent medicines and prescribing practices; however, generic consumption also depends on policies implemented by the countries [2][1][4][5].
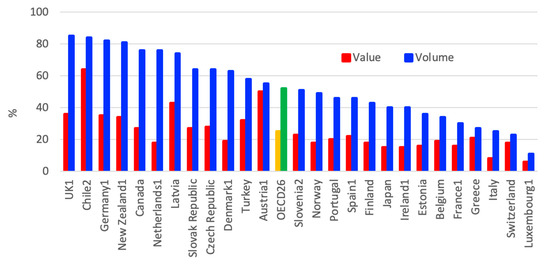
Figure 16. Consumption of generic pharmaceuticals in the OECD countries in 2017. (1) Reimbursed pharmaceutical market. (2) Community pharmacy market [2].
References
- Mikulic, M. Statistics & Facts, Global Pharmaceutical, Industry; Statista: Hamburg, Germany, 2020.
- CIHR. Drug Bank Database; Version 5.1.3; Canadian Institute of Health Research: Ottawa, ON, USA, 2019.
- OECD. Health and Glance Indicators; OECD Publishing: Paris, France, 2017.
- Vogler, S. The impact of pharmaceutical pricing and reimbursement policies on generics uptake: Implementation of policy options on generics in 29 European countries—An overview. Generics Biosimilars Initiat. J. 2012, 1, 44.
- EGA–European Generic Medicines. Market Review–The European Generic Medicines Markets. European Generic Medicines; European Generic Medicines Association: Brussels, Belgium, May 2011.

