Your browser does not fully support modern features. Please upgrade for a smoother experience.
Submitted Successfully!
 +1 credit
Thank you for your contribution! You can also upload a video entry or images related to this topic.
For video creation, please contact our Academic Video Service.
| Version | Summary | Created by | Modification | Content Size | Created at | Operation |
|---|---|---|---|---|---|---|
| 1 | Aleksey Kudreyko | -- | 2789 | 2023-12-30 17:49:59 | | | |
| 2 | Fanny Huang | Meta information modification | 2789 | 2024-01-02 10:00:53 | | |
Video Upload Options
We provide professional Academic Video Service to translate complex research into visually appealing presentations. Would you like to try it?
Cite
If you have any further questions, please contact Encyclopedia Editorial Office.
Kudreyko, A.A.; Chigrinov, V.G. Types of Liquid Crystal Biosensors. Encyclopedia. Available online: https://encyclopedia.pub/entry/53287 (accessed on 21 July 2026).
Kudreyko AA, Chigrinov VG. Types of Liquid Crystal Biosensors. Encyclopedia. Available at: https://encyclopedia.pub/entry/53287. Accessed July 21, 2026.
Kudreyko, Aleksey A., Vladimir G. Chigrinov. "Types of Liquid Crystal Biosensors" Encyclopedia, https://encyclopedia.pub/entry/53287 (accessed July 21, 2026).
Kudreyko, A.A., & Chigrinov, V.G. (2023, December 30). Types of Liquid Crystal Biosensors. In Encyclopedia. https://encyclopedia.pub/entry/53287
Kudreyko, Aleksey A. and Vladimir G. Chigrinov. "Types of Liquid Crystal Biosensors." Encyclopedia. Web. 30 December, 2023.
Copy Citation
Interactions between liquid crystal molecules and target analytes open up various biosensing applications for quick screening and point-of-care applications. There exist different kinds of biosensors, such as electrochemical, wearable, amperometric, potentiometric, optical, impedimetric and thermometric. Liquid crystal (LC) biosensors belong to the type of optical biosensors, which employ its anisotropy and sensitivity to external stimuli. As it is known, LCs are highly sensitive to environment changes, e.g., temperature, electric fields and surface interactions. The inherent property of LCs to respond to external stimuli gives LC biosensors a high potential to contribute to the new biosensing era.
liquid crystal biosensor
1. Definition of Liquid Crystal Biosensors
There exist different kinds of biosensors, such as electrochemical, wearable, amperometric, potentiometric, optical, impedimetric and thermometric [1]. Liquid crystal (LC) biosensors belong to the type of optical biosensors, which employ its anisotropy and sensitivity to external stimuli. As it is known, LCs are highly sensitive to environment changes, e.g., temperature, electric fields and surface interactions. The inherent property of LCs to respond to external stimuli gives LC biosensors a high potential to contribute to the new biosensing era. Furthermore, LC-based sensors do not require molecular labels, electric power, intensive labor and complex instrumentation, which makes them extraordinarily attractive in the development of inexpensive and portable devices for point-of-care diagnostics. The main advantage of LC biosensors lies in their label-free and real-time detection capabilities, i.e., that no additional tags or labels are required for signal detection, and the response can be assessed as it occurs. Earlier obtained results demonstrate that LC biosensors are highly sensitive to low concentrations of target molecules. This property makes LC sensors valuable tools for medical diagnostics, environmental monitoring and biotechnology research.
Specific biological recognition elements are immobilized on the surface of LCs. In particular, the target analyte (e.g., antibodies, enzymes and bacteriophage) binds to recognition elements [2]. Consequently, it induces changes in the local surface properties, altering the alignment of LC molecules. As a result, it is possible to visualize changes in color, light polarization or birefringence.
2. Types of Liquid Crystal Biosensors
The birefringent optical response of LC molecules gives rise to bright optical textures under crossed polarizers. Another distinguished feature of LCs is low anchoring energy (10−6–10−3 J/m2)10−6–10−3 J/m2. Consequently, the alignment of LCs is sensitive to the chemical structure of the substrates and the presence of various biochemical substances. The long-range orientational order of LCs extends the changes in the interfacial alignment of LC molecules over distances of up to ~100 μm. This results in the amplification of molecular interactions into visible optical signals, which are detectable by polarized optical microscopy. The set of biosensor applications and LC properties for biosensors make us believe that the development of LC-based biosensors will result in a new therapeutic window for point-of-care diagnostics (see Figure 1).
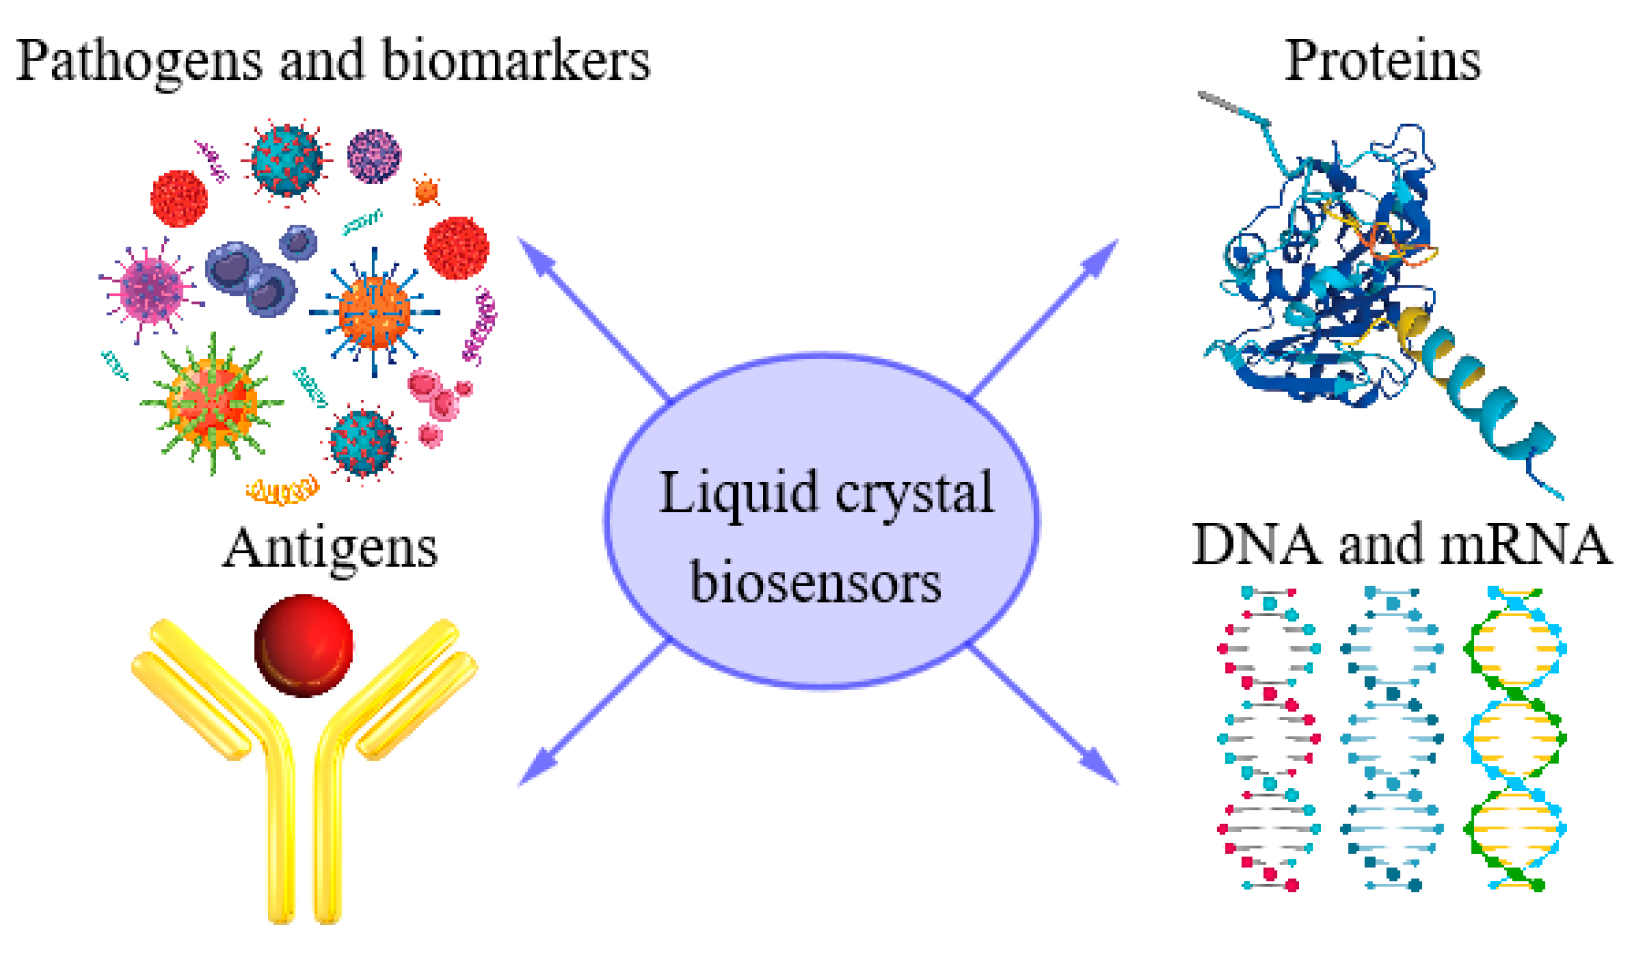
Figure 1. Potential applications of LC biosensors in point-of-care diagnostics.
One can make several comments on Figure 1. Proteins are involved in all vital processes within cells and organisms, such as cell signaling and the immune response. LC-based biosensors have also been developed for protein and peptide detection, e.g., amyloid fiber formation in Alzheimer’s disease is a lipid membrane-associated process, since lipids lead to the acceleration of aggregation by several orders of magnitude [3]. Based on a coated lipid, it was demonstrated that LCs can serve as markers for distinguishing molecular secondary structures in proteins of protein aggregates [4]. Functional interfaces for the detection of environmental pollutants, toxic metal ions and disease-causing pathogens were earlier fabricated by using LCs (e.g., [5][6]). Cancer biomarkers (proteins, DNA, RNA, cell-surface receptors, antibodies, etc.) that are present in serum, blood or tumor tissues can be visualized for assessment and the forecasting of cancer [7]. Another recent application of LC biosensors was demonstrated in the specific sensing of goat Immunoglobulin G by a nematic liquid crystal material [8].
2.1. Nematic LC-Based Biosensors
Biological agents, biomarkers and lightweight molecules are essential indicators of biological processes. In particular, biomarkers are attracting close attention in diagnosing diseases and the optimization of treatments based on accurate measurements of biomarkers in body fluids. The investigation of methods for the identification of cancer cells is necessary for early detection and proper selection of the treatment method.
In order to address the inherent limitations of bioanalytical methods in terms of early sensitivity, researchers suggest taking advantage of the sensitivity of LCs, which is affected by the bounding surfaces and optical anisotropy. This enables us to transfer chemical and biological changes in tissues into the changes of scattered polarized light. It is clear that multiple light scattering induces changes in the degree of beam polarization and Stokes parameters. Accordingly, uncertainty arises in the expected properties of polarized light. A combination of changes in polarized light, induced by biological objects, opens up an opportunity to extract information about the structural state of a sample (tissues, cells and saliva) and the presence of morphological changes. These changes can be detected by, e.g., a cosine similarity approach.
Earlier published results showed that it is technically possible to assemble a matrix of micropolarizers to detect the Stokes parameters and obtain multiple microscopic images of tissues [9]. Like a vast majority of commercially available camera systems, image sensors were originally designed to capture intensity and color. However, these sensors are “blind” to the polarization state. Capturing the polarization state of light reflected or emitted by objects in an input image scene provides valuable information about the geometrical, physical, chemical, etc. properties and a series of numerical data for a number of machine vision problems, e.g., automatic target detection. Let us consider the method of the optical detection of pathogens in detail.
Multiple light scattering on biological objects (see the input image scene in Figure 2) develops a pattern with the set of Stokes parameters. If the object has pathogens, then the Stokes parameters will differ from the sample. The subsequent registration of the Stokes parameters ( ) by using a complementary metal oxide semiconductor (CMOS) sensor and a collection of polarized light microscopy images obtained by light scattering in the sampled biological medium and a biological medium with morphological changes make it possible to form a bank of sampled data (see Figure 2). A schematic representation of the biosensor enables measuring the Stokes parameters of circularly polarized components. These components are expressed as follows:
where 𝑀LP is the Mueller matrix of an ideal linear polarizer, and 𝑀ret is the Mueller matrix of the retarder. Since only the input Stokes parameter are measurable, the intensity of the emerging light from the retarder–polarizer combination is .
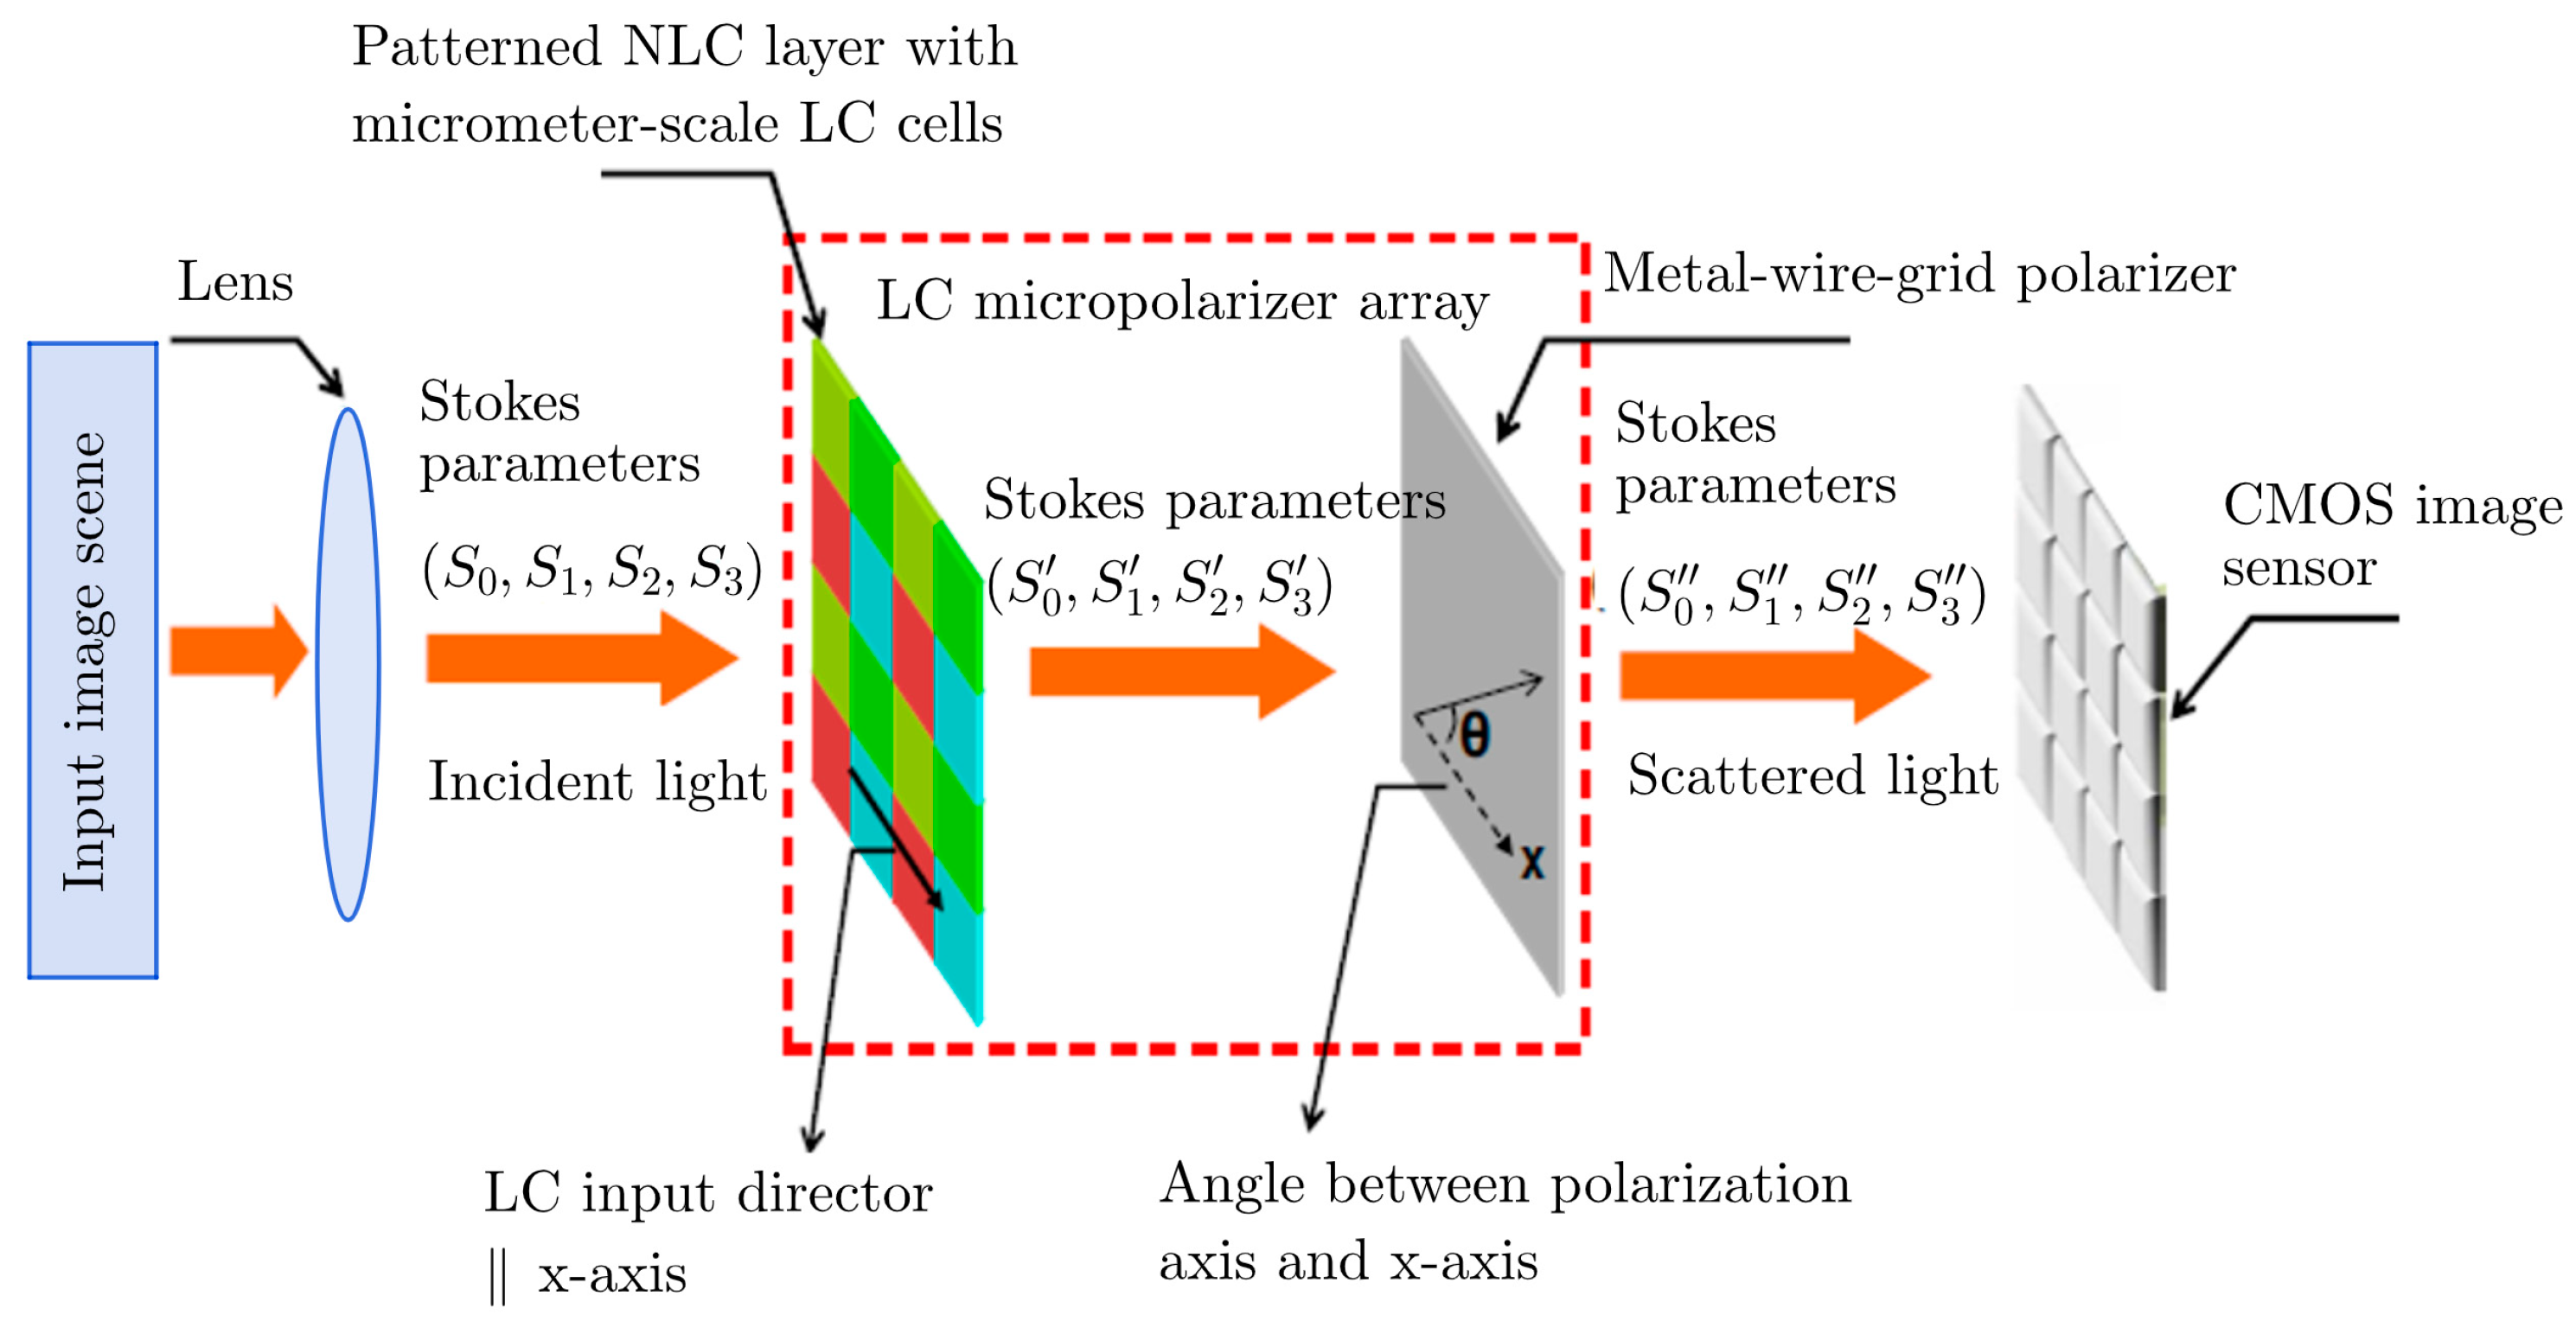
Figure 2. Schematic representation of an LC biosensor with a micropolarizer array.
In fact, each set of (𝜃,𝜑) corresponds to one optical polarizing device. Mathematically, at least four intensity measurements with four different optical polarizing devices having four different values of (𝜃,𝜑) are needed to extract all the Stokes parameters in expression 𝐼(𝜃,𝜑). The four Stokes parameters can then be expressed by the linear combinations of the emerging light intensities after transmitting through the four different optical polarizing devices. This analysis suggests that there should be an assumption that the polarization state of scattered light is spatially uniform.
A key component of the setup depicted in Figure 2 is the two-dimensional micropolarizer array, which is fabricated by using photoalignment technology [9]. Here, the photoalignment technique provides an opportunity to produce a number of matrix patterns with the resolution of 100 nm for the subsequent identification of biological objects [10].
The collected data of the Stokes parameters and images obtained by polarization optical microscopy are the basis for their subsequent investigations by means of data mining methods [11].
2.2. Cholesteric LC-Based Biosensors
In comparison to NLCs, cholesteric liquid crystals (CLCs) have a helical arrangement along the orientation of the director. This mesophase is characterized by the helical pitch p, which is the distance corresponding to the 2π rotation of mesogens along the helix director (see Figure 3a). If the pitch length is of the same order of magnitude as the wavelength of visible light, then the cholesteric phase selectively reflects visible light.
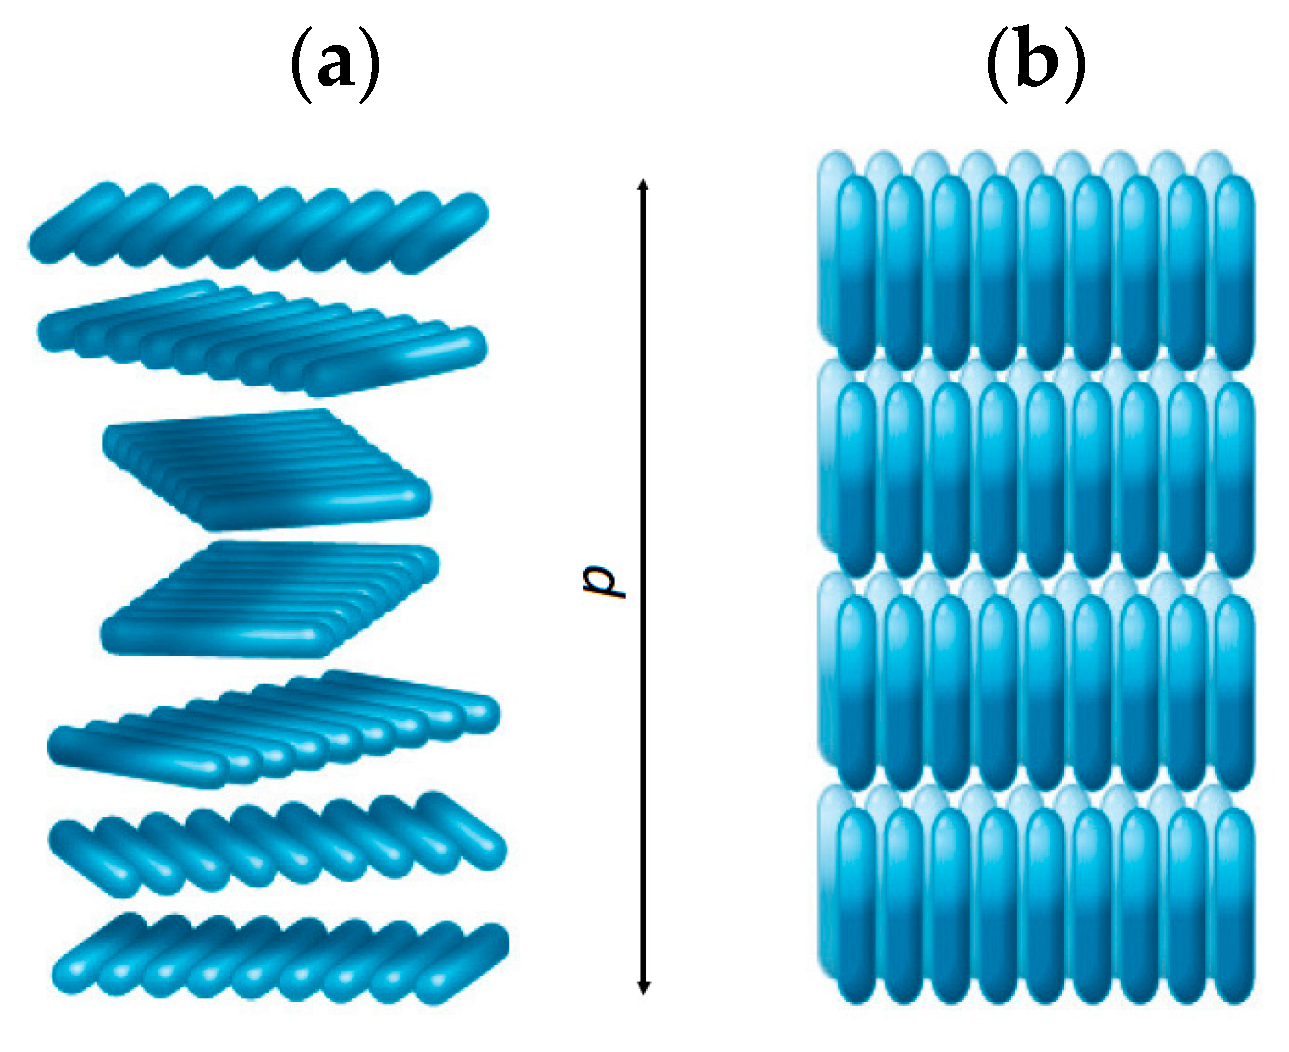
Figure 3. (a) Schematic representation of a cholesteric mesophase structure; p is the helix pitch. (b) A smectic mesophase structure.
In other words, the intrinsic periodicity and cholesteric mesophase structure possess a Bragg selective light reflection band (photonic band gap) with the central wavelength λc defined by the identity
for normal light incidence and reflection, where n is the mean refractive index of the LC compound. The reflectance is limited by 50% of the ambient, unpolarized light, because only circularly polarized light of the same handedness as the helix is reflected. This selective reflection of light makes them unique materials with a significant advantage over other mesophases.
Droplets (i.e., LC-in-water emulsions) represent another type of LC arrangement and are rapidly emerging as promising candidates for LC-based sensing. Droplets have attracted attention because of the micrometer-sized geometric confinement of LCs in various configurations. This confinement depends on how the LC orientation at the interface influences the LC structure throughout the droplet. In comparison with planar LC films, the preparation of droplets does not require a substrate and grid structure to support and confine LCs. Moreover, LC droplets with a large surface area-to-volume ratio and topological defects allow detecting a variety of targets, which makes them an excellent candidate for sensing applications.
The fabrication of an LC droplet sensor is mainly based on the LC long-range order and birefringence. The goal of an LC droplet sensor is to design a modified sensitive surface with specific recognition of the target molecules. Under the action of the modified molecule, the LC molecules arrange themselves [12]. However, this alignment is hindered in the presence of the target analyte. LC droplets are produced by using a microfluidic device and have either bipolar or radial configuration due to the orientational ordering of LC mesogens within a droplet (see Figure 4). Notably, the droplets also adopt other configurations, which are not discussed here [13].
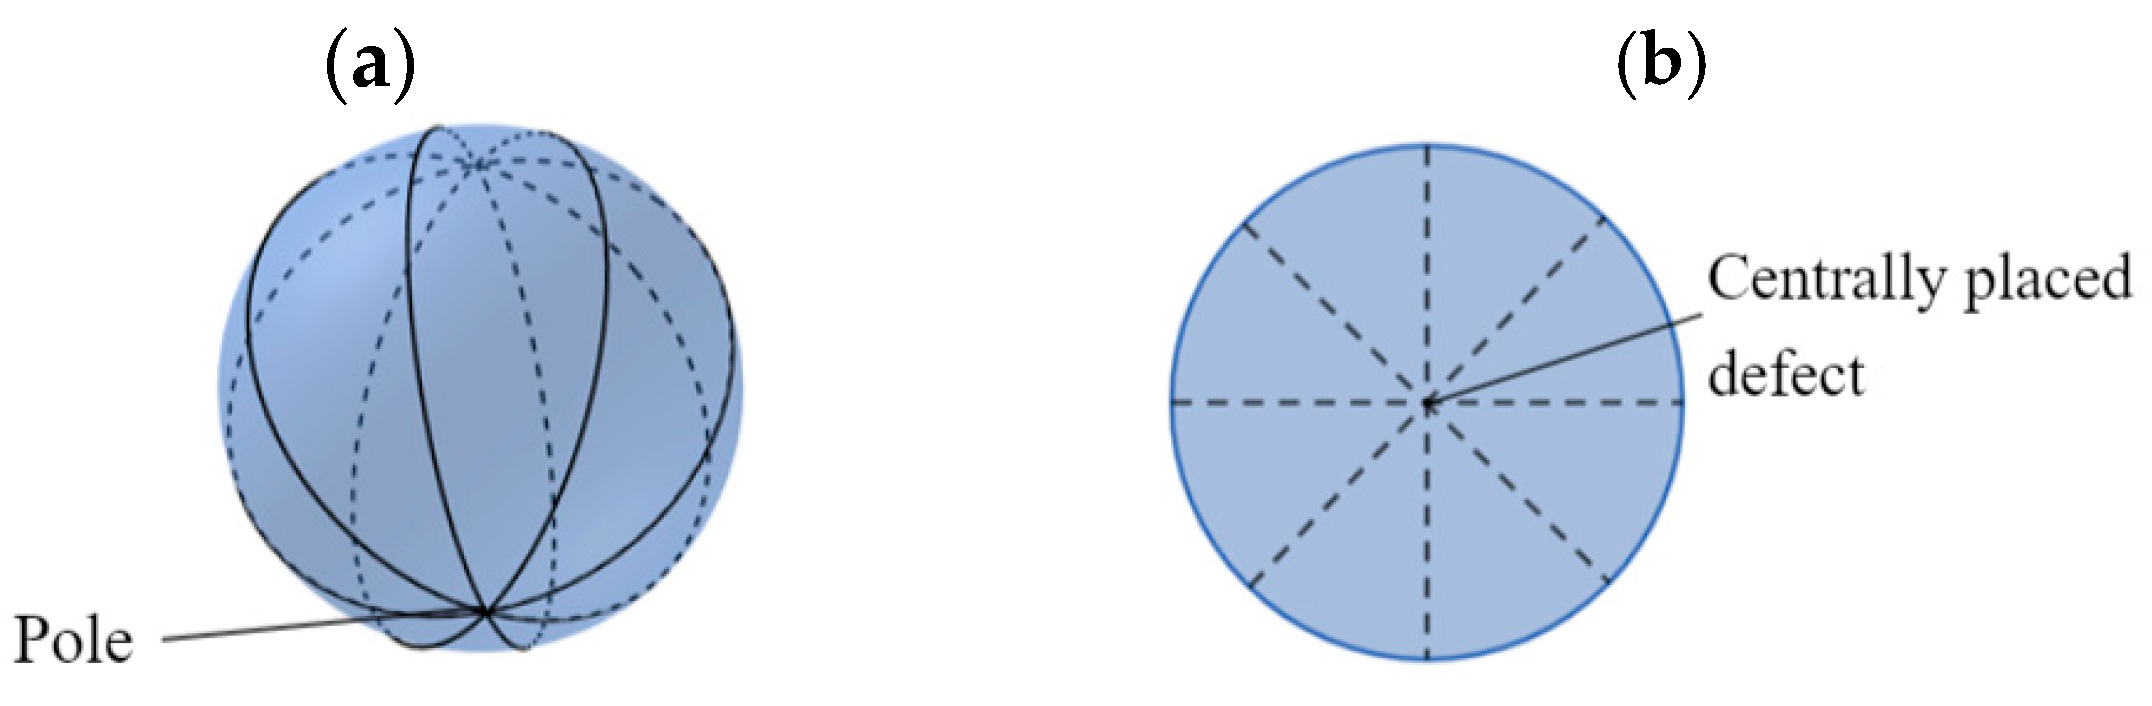
Figure 4. (a) Bipolar and (b) radial configurations of an LC droplet.
The parallel alignment of LC mesogens to the surface of a droplet with two diametrically opposite surface point defects at the poles results in bipolar configuration (Figure 4a), whereas the radial configuration of LCs forms an orthogonal alignment to a droplet surface with centrally placed defects (Figure 4b).
A microfluidic technique can be used to overcome the size–polydispersity bottleneck in the fabrication of LC droplets; therefore, wider applications of advanced photonic devices are becoming possible [14]. To apply CLC droplets in biosensing, their surfaces must be coated with a sensitive material to the external stimuli of interest, and this response should change the CLC droplet configuration. Consequently, a functionalized compound known as PAA-b-LCP (PAA and LCP denote poly (acrylic acid) and poly (4-cyanobiphenyl-4-oxy-undecylacrylate), respectively) was developed. These droplets have become pH-sensitive. Being a weak polyelectrolyte at a low pH, protonated PAA exposes a neutral charge, and it shrinks, being a bulk material (Figure 5a). High values of pH result in deprotonated PAA with a negative charge state, as shown in Figure 5b,c. The charged state of PAA favors a homeotropic alignment. Therefore, bright field images of CLC droplets look different for various concentrations of a chiral dopant and different pH. Thus, the helical structure of CLC droplets is pH-sensitive. This structure provides the basis for sensing pH-perturbing target analytes [15].
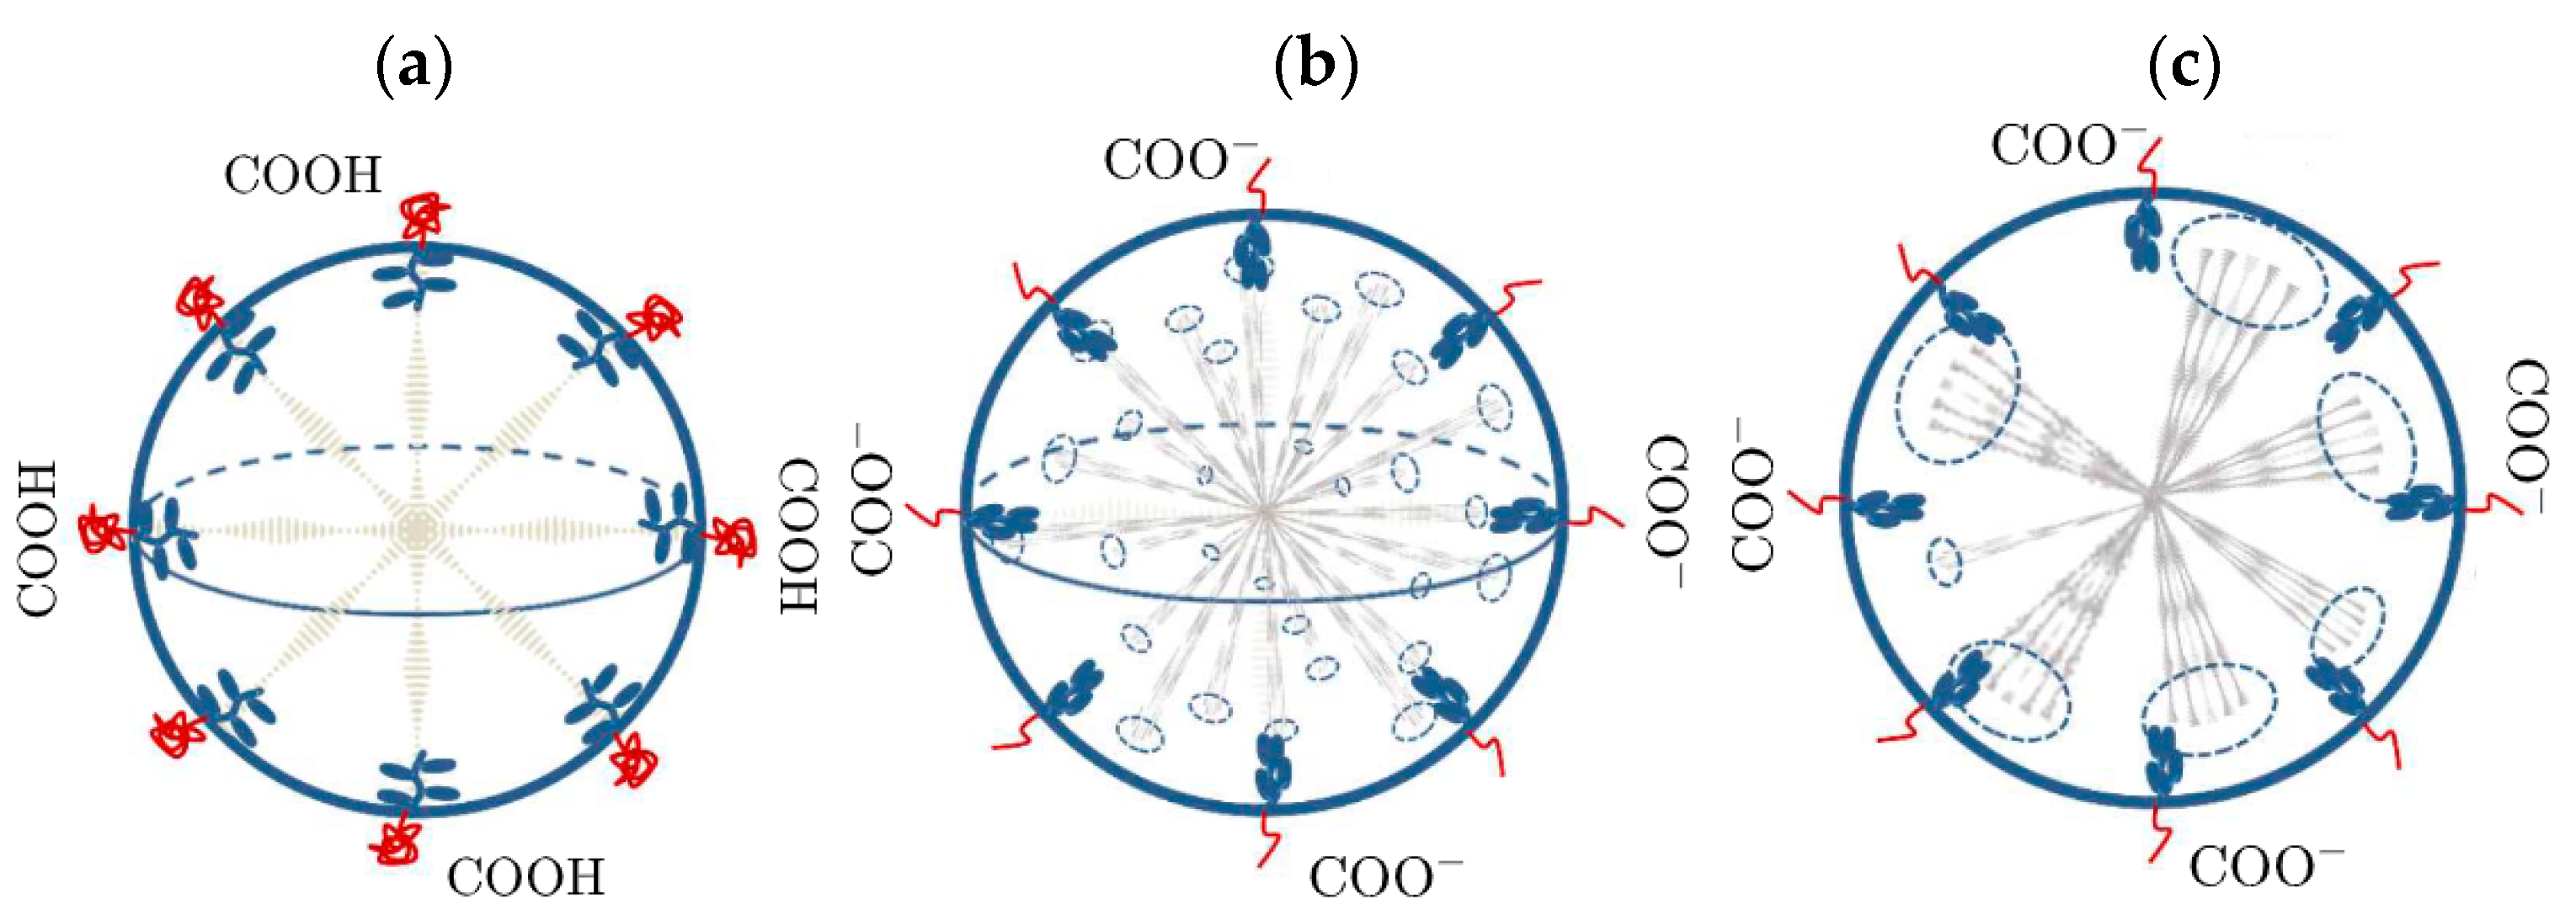
Figure 5. Working design principles of CLC configurations for (a) low and (b,c) high pH.
pH-responsive and color-inducing CLC droplets at high concentrations are leveraged as a platform for developing new biosensors by immobilizing enzymes on the surface. The droplets have high sensitivity, good selectivity and fast responses to the presence of glucose and cholesterol [12].
Thus, microfluidic techniques provide a promising tool for the fabrication of uniform and reproducible LC-based sensing platforms, but the performance of LC droplet-based biosensors strongly depends on the droplet density.
2.3. Smectic LC-Based Biosensors
Smectic LCs represent another well-known mesophase that has been extensively explored. Like CLCs, smectic LCs also possess a layered structure with a certain periodicity. A layered structure of smectic LCs results in the highest order parameter value among all LCs:
where α is the angle between the director and long molecular axis, d is the layer spacing and z is the position of the molecular center (see Figure 3b). A variety of smectic LCs, such as SmA, SmB and SmC, have been deeply investigated, but their applications in biosensing are difficult due to their strong intermolecular bonding. Meanwhile, a recent study reported the crystallization of cholesterol (concentrations in ethanol of 100, 200, 300 and 400 mg/dL) in combination with ferroelectric liquid crystal (FLC) in the form of cholesterol needles (Figure 6) [16]. Optical microphotographs showed gradual changes in the texture with the increase of the concentration of cholesterol, i.e., the change in the induction of the needle-like lines perpendicular to the alignment or parallel to the sematic layers. The angle between the rubbing direction and polarizer (analyzer) axis was 45°. Cholesterol crystals are optically anisotropic and have the tendency to rotate the plane of polarized light; hence, a slight change in transmission through these lines was also observed. It means that the region of lines is optically active, i.e., the lines are a combination of FLC and cholesterol. If these lines are dominated by the FLC molecules, then the transmission must change with the application of the electric field.
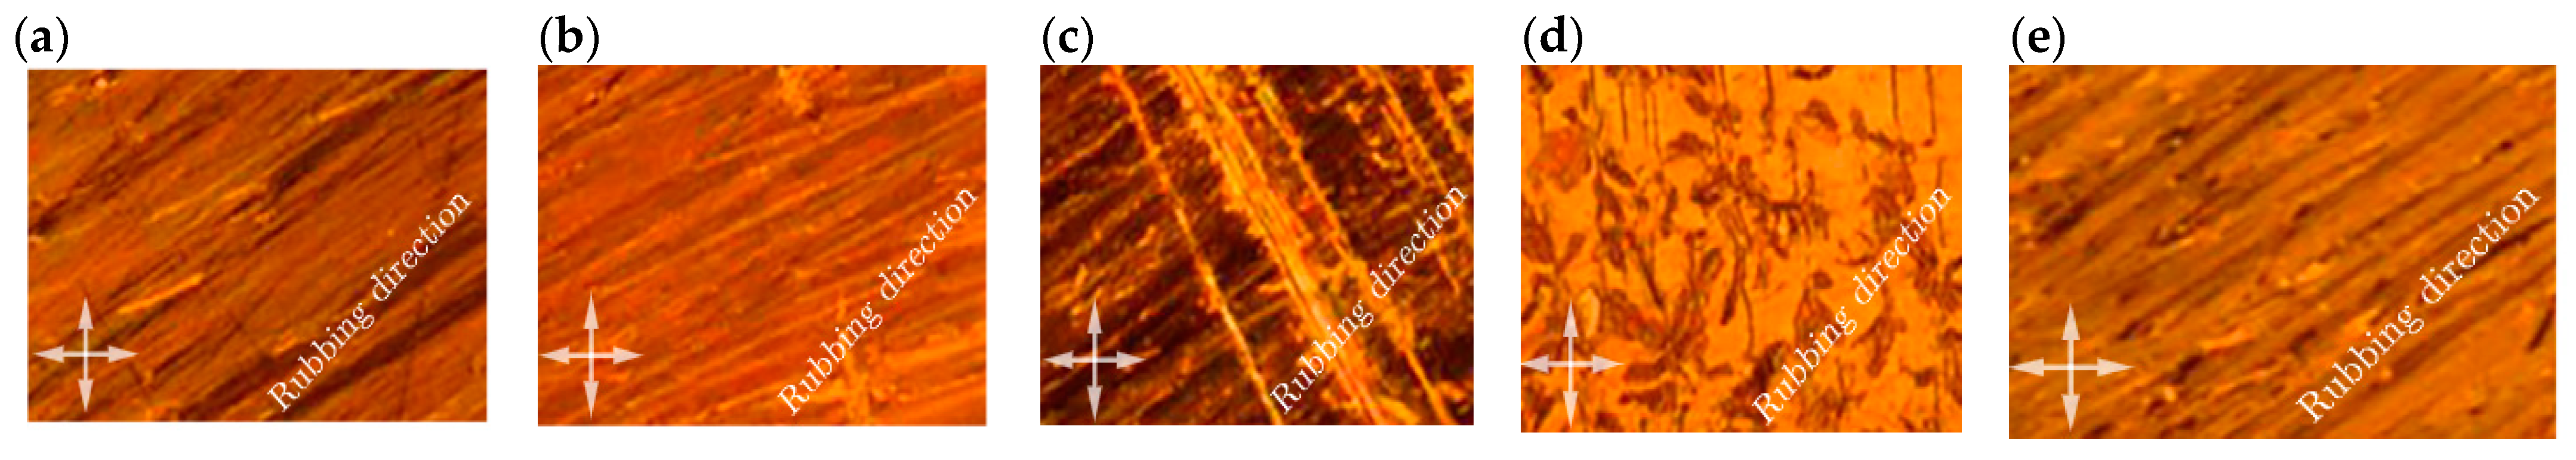
Figure 6. Optical microphotographs of cholesterol with various concentrations in ethanol: (a) 100 mg/dL, (b) 200 mg/dL, (c) 300 mg/dL, (d) 400 mg/dL and (e) a pure FLC mixture under crossed polarizers (double-headed arrows).
This behavior of lines was analyzed in the presence of an electric field at room temperature. The application of an electric field confirms that the lines are not due to only FLC molecules but also due to the crystals of cholesterol.
2.4. Polymer-Stabilized Blue-Phase Liquid Crystal Biosensor
A number of optical properties of polymer-stabilized blue-phase liquid crystals (PS-BPLCs) make these materials excellent for optoelectronics. Earlier studies revealed that PS-BPLCs are sensitive to xylene, heptane, cyclohexane, dichloromethane and ethyl alcohol vapors [17]. The effect of vapors on PS-BPLC sensors consists of a change of color from blue to green. The reason for this effect is the change in the refractive index and the anchoring energy between LC molecules and the polymer network induced by the diffusion and adsorption of volatile vapors. Then, subsequently holding the PS-BPLC sensor in the air leads to recovering of the original color. This PS-BPLC sensor also had a good selectivity, sensitivity, high repeatability, insensitivity to humidity, fast response and long-term stability.
The fabrication of an LC cell includes the following steps: an LC compound must be heated up to an isotropic state and stirred for 30 min; then, the compound must be injected into the LC cell without an initial alignment (Figure 7a). The thickness of the LC cell should be about 20 μm. At 44.6 °C, the sample must be irradiated with ultraviolet light (5 mW/cm2) for 30 min (Figure 7b). After removing the upper glass substrate of the LC cells, the PS-BPLC film is obtained, and the hue of the PS-BPLC textures turns from green to blue due to the deformation collapse of the lattices.
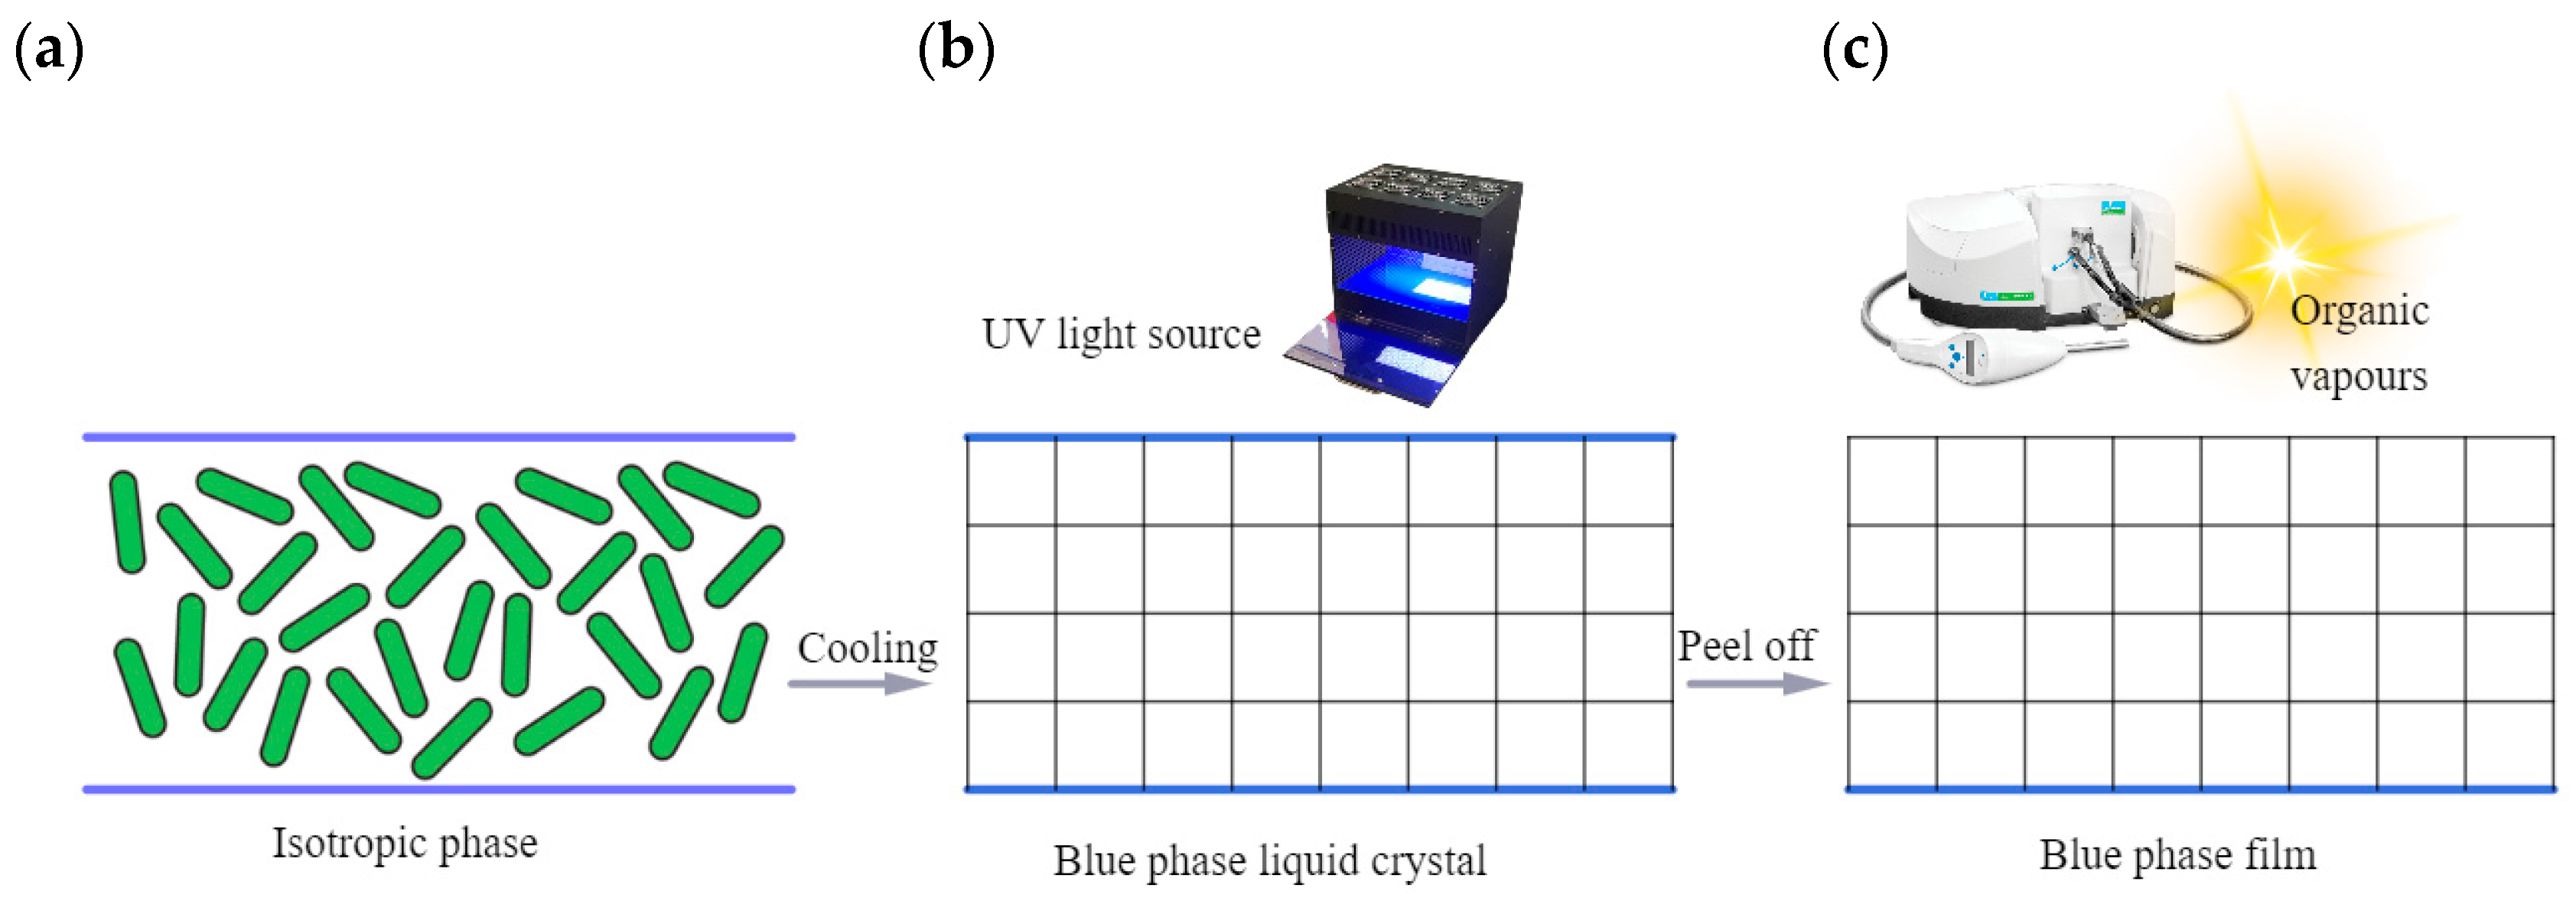
Figure 7. Sketch of an experimental sensor for the detection of organic vapors by using a PS-BPLC. The LC mixture was filled in a cell and heated to the isotropic phase (a); then, the LC mixture was carefully cooled to the blue phase and exposed by UV light with an intensity of 5 mW/cm2 for 30 min to ensure complete polymerization (b). Then, a PS-BPLC film was obtained after peeling off the top glass substrate. The platelet texture change of the PS-BPLC is observed using a spectrometer (c).
In order to evaluate the sensing properties of the sensor, the PS-BPLC film is placed in a closed chamber at room temperature. Organic vapors are injected into the closed chamber by a pipette. The sunlight is reflected by the PS-BPLC film, and a fiber spectrometer connected to a computer detects the reflection spectrum (see Figure 7c). The detected red shift of the PS-BPLC sensor increases from 10 to 40 nm when the copolymer concentration decreases from 16 wt% to 10 wt%.
In addition to PS-BPLCs, CLCs were also applied in microfluidic devices for gas sensing applications. The photonic band gap (Equation (2)) of CLCs is also very sensitive to temperature and a volatile organic compound [18]. This can be done by applying a thin layer of CLCs directly to microfluidic devices and then protecting it with a layer of a gas-permeable membrane. In this case, gas molecules permeate through the membrane and induce the color change of CLCs. An important finding of this application is that perceptible changes in color can be detected with a spectrometer within seconds of exposure of the LC film to the chemical environments.
References
- Mukherjee, A.; Bhattacharya, J.; Moulick, R.G. Nanodevices: The future of medical diagnostics. In NanoBioMedicine; Saxena, S., Khurana, S., Eds.; Springer: Singapore, 2020; pp. 371–388.
- Xu, J.; Chau, Y.; Lee, Y.-K. Phage-based electrochemical sensors: A review. Micromachines 2019, 10, 855.
- Karaboğa, M.N.S.; Sezgintürk, M.K. Biosensor approaches on the diagnosis of neurodegenerative diseases: Sensing the past to the future. J Pharm. Biomed. 2022, 209, 114479.
- Sadati, M.; Apik, A.I.; Armas-Perez, J.C.; Martinez-Gonzalez, J.; Hernandez-Ortiz, J.P.; Abbott, N.L.; de Pablo, J.J. Liquid crystal enabled early stage detection of beta amyloid formation on lipid monolayers. Adv. Funct. Mater. 2015, 25, 6050–6060.
- Zafiu, C.; Hussain, Z.; Küpcü, S.; Masutani, A.; Kilickiran, P.; Sinner, E.-K. Liquid crystals as optical amplifiers for bacterial detection. Biosens. Bioelectron. 2016, 80, 161–170.
- Otón, E.; Otón, J.; Caño-García, M.; Escolano, J.; Quintana, X.; Geday, M.A. Rapid detection of pathogens using lyotropic liquid crystals. Opt. Express 2019, 27, 10098–10107.
- Khan, M.; Liu, S.; Qi, L.; Ma, C.; Munir, S.; Yu, L.; Hu, Q. Liquid crystal-based sensors for the detection of biomarkers at the aqueous/LC interface. TrAC Trends Anal. Chem. 2021, 144, 116434.
- Popov, P.; Honaker, L.W.; Kooijman, E.E.; Mann, E.K.; Jákli, A.I. A liquid crystal biosensor for specific detection of antigens. Sens. Bio-Sens. Res. 2016, 8, 31–35.
- Zhao, X.; Bermak, A.; Boussaid, F.; Du, T.; Chigrinov, V.G. High-resolution photoaligned liquid-crystal micropolarizer array for polarization imaging in visible spectrum. Opt. Lett. 2009, 34, 3619–3621.
- Zhao, X.; Bermak, A.; Chigrinov, V.G. Photo-Aligned Liquid-Crystal Micropolarimeter Array and Its Manufacturing Method. Google Patents, US 8,525,970 B2, 3 September 2013.
- Smith, A.D.; Abbott, N.; Zavala, V.M. Convolutional network analysis of optical micrographs for liquid crystal sensors. J. Phys. Chem. C 2020, 124, 15152–15161.
- Deng, J.; Han, D.; Yang, J. Applications of microfluidics in liquid crystal-based biosensors. Biosensors 2021, 11, 385.
- Carlton, R.J.; Hunter, J.T.; Miller, D.S.; Abbasi, R.; Mushenheim, P.C.; Tan, L.N.; Abbott, N.L. Chemical and biological sensing using liquid crystals. Liq. Cryst. Rev. 2013, 1, 29–51.
- Li, Q.; Bisoyi, H.K. Light-directing self-organized 1D and 3D chiral liquid crystalline nanostructures. In Proceedings of the Emerging Liquid Crystal Technologies X, San Francisco, CA, USA, 11 March 2015; pp. 35–44.
- Lee, H.-G.; Munir, S.; Park, S.-Y. Cholesteric liquid crystal droplets for biosensors. ACS Appl. Mater. Interfaces 2016, 8, 26407–26417.
- Gangwar, L.K.; Choudhary, A.; Rewri, S.; Singh, G.; Biradar, A.M.; Sumana, G. Evidence of cholesterol crystallization along with smectic layers in ferroelectric liquid crystal. J. Mol. Liq. 2023, 369, 120830.
- Hou, D.-S.; Zheng, L.; Sun, D.-P.; Zhou, X.; Zhu, J.-L.; Han, W.-M. Polymer-stabilized blue phase liquid crystal sensor for sensitive and selective detection of organic vapors. Liq. Cryst. 2022, 49, 201–208.
- Sutarlie, L.; Qin, H.; Yang, K.-L. Polymer stabilized cholesteric liquid crystal arrays for detecting vaporous amines. Analyst 2010, 135, 1691–1696.
More
Information
Subjects:
Physics, Applied
Contributors
MDPI registered users' name will be linked to their SciProfiles pages. To register with us, please refer to https://encyclopedia.pub/register
:
View Times:
1.7K
Entry Collection:
Remote Sensing Data Fusion
Revisions:
2 times
(View History)
Update Date:
02 Jan 2024
Table of Contents


Notice
You are not a member of the advisory board for this topic. If you want to update advisory board member profile, please contact office@encyclopedia.pub.
OK
Confirm
Only members of the Encyclopedia advisory board for this topic are allowed to note entries. Would you like to become an advisory board member of the Encyclopedia?
Yes
No
${ textCharacter }/${ maxCharacter }
Submit
Cancel
Back
Comments
${ item }
|
${ item.createdUser.fullName }
${ item.createdAt }
${ item.vote }
${ item.reply }
Delete
${ reply.createdUser.fullName }
${ reply.createdAt }
${ reply.vote }
Delete
There is no reply to this comment~
${ item.replyTextCharacter }/${ item.replyMaxCharacter }
Submit
Cancel
More
No more~
There is no comment~
${ textCharacter }/${ maxCharacter }
Submit
Cancel
${ selectedItem.replyTextCharacter }/${ selectedItem.replyMaxCharacter }
Submit
Cancel
Confirm
Are you sure to Delete?
Yes
No