| Version | Summary | Created by | Modification | Content Size | Created at | Operation |
|---|---|---|---|---|---|---|
| 1 | Yeganeh Saffar | -- | 1856 | 2023-12-20 00:13:29 | | | |
| 2 | Jason Zhu | Meta information modification | 1856 | 2023-12-25 03:48:23 | | |
Video Upload Options
Microchannels with curved geometries have been employed for many applications in microfluidic devices in the past decades. The Dean vortices generated in such geometries have been manipulated using different methods to enhance the performance of devices in applications such as mixing, droplet sorting, and particle/cell separation. Understanding the effect of the manipulation method on the Dean vortices in different geometries can provide crucial information to be employed in designing high-efficiency microfluidic devices.
1. Introduction

where 𝜌 is fluid density, 𝑈 is the uniform velocity, 𝑑 is the hydraulic diameter of the channel, and 𝜇 is the dynamic viscosity, it was proposed that the radius of curvature is proportional to variations in the flow rate through the parameter, k, defined as:

2. The Dean Number
3. Dean Number Thresholds
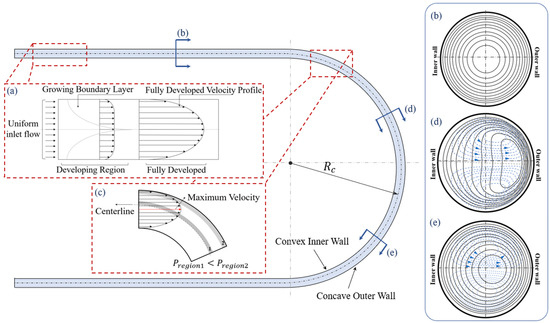
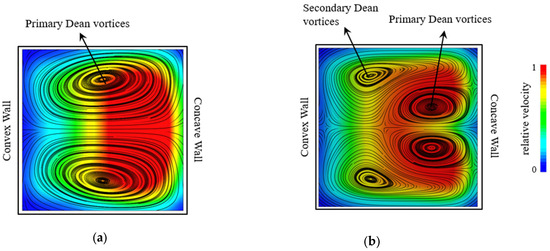
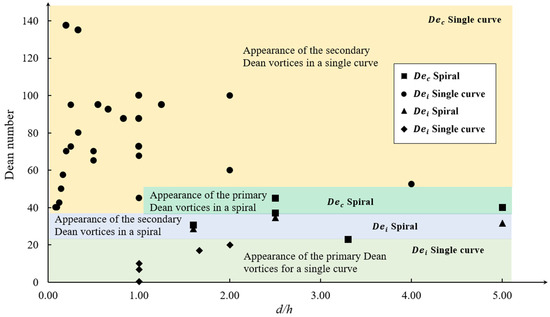
Increasing the Dean number such that 𝐷𝑒𝑖<𝐷𝑒 leads to an increase in the transverse velocity of the flow and the strength of the vortices generated. This can be achieved by increasing the flow rate such that the maximum velocity location moves further toward the concave wall, as is depicted in Figure 2b. As a result, the core of the Dean vortices shifts to the concave wall [11][12]. With further increasing of the Dean number, two secondary Dean vortices detach from the main vortices. These secondary vortices are smaller than the main/primary vortices. Figure 2b shows a flow configuration including primary and secondary Dean vortices. The Dean number at which the secondary Dean vortices start to form is called the critical Dean number, 𝐷𝑒𝑐[12][22][23].


References
- Cheng, K.C.; Lin, R.C. Fully Developed Laminar Flow in Curved Rectangular Channels. J. Fluids Eng. 1976, 98, 41–48.
- Cheng, K.C.; Akiyama, M. Laminar Forced Convection Heat Transfer in Curved Rectangular Channels. Int. J. Heat Mass Transf. 1970, 13, 471–490.
- Churchill, S.W. Comprehensive Correlating Equations for Heat, Mass and Momentum Transfer in Fully Developed Flow in Smooth Tubes. Ind. Eng. Chem. Fundam. 1977, 16, 109–116.
- Corcos, G.M.; Sellars, J.R. On the Stability of Fully Developed Flow in a Pipe. J. Fluid Mech. 1968, 5, 97–112.
- Berger, S.A.; Talbot, L.; Yao, L.-S. Flow in Curved Pipes. Annu. Rev. Fluid Mech. 1983, 15, 461–512.
- Williams, G.S.; Hubbell, C.W.; Fenkell, G.H. Experiments at Detroit, Mich., on the Effect of Curvature upon the Flow of Water in Pipes. Trans. Am. Soc. Civ. Eng. 1902, 1, 1–196.
- Eustice, J. Flow of Water in Curved Pipes. Proc. R. Soc. London. Ser. A 1910, 84, 107–118.
- Eustice, J. Experiments on Stream-Line Motion in Curved Pipes. Proc. R. Soc. London. Ser. A Contain. Pap. A Math. Phys. Character 1911, 85, 119–131.
- Dean, W.R. Fluid motion in a curved channel. Proc. R. Soc. Lond. 1928, 121, 402–420.
- Dean, W.R. The Stream-Line Motion of Fluid in a Curved Pipe (Second Paper). Lond. Edinb. Dublin Philos. Mag. J. Sci. 1928, 5, 673–695.
- Siggers, J.H.; Waters, S.L. Steady Flows in Pipes with Finite Curvature. Phys. Fluids 2005, 17, 077102.
- Nivedita, N.; Ligrani, P.; Papautsky, I. Dean Flow Dynamics in Low-Aspect Ratio Spiral Microchannels. Sci. Rep. 2017, 7, 44072.
- Bara, B.; Masliyah, J.H. An Experimental and Numerical Study of the Dean Problem: Flow Development towards Two-Dimensional Multiple Solutions. J. Fluid Mech. 1992, 244, 339–376.
- Mojola, O.O. On Secondary Flow in Streamwise Corners. J. Mec. Appl. 1980, 4, 177–196.
- Soh, W.Y.; Berger, S.A. Laminar Entrance Flow in a Curved Pipe. J. Fluid Mech. 1984, 148, 109–135.
- Srivastava, R.S.; McConalogue, D.J. Motion of a Fluid in a Curved Tube. Proc. R. Soc. London. Ser. A. Math. Phys. Sci. 1968, 307, 37–53.
- Harirchian, T.; Garimella, S.V. A Systematic Investigation of the Effects of Microchannel Width, Depth, and Aspect Ratio on Convective Boiling Heat Transfer and Flow Regimes in Parallel Microchannels. Heat Transf. Summer Conf. 2009, 43567, 907–916.
- Lee, P.S.; Garimella, S.V.; Liu, D. Investigation of Heat Transfer in Rectangular Microchannels. Int. J. Heat Mass Transf. 2005, 48, 1688–1704.
- Di Carlo, D. Inertial Microfluidics. Lab Chip 2009, 9, 3038–3046.
- Zheng, L.; Fang, M.; Chen, W.; Huo, D.; Li, H. Enhancement Mechanism of Fish-Scale Surface Texture on Flow Switching and Mixing Efficiency in Microfluidic Chips. Langmuir 2023, 39, 7396–7407.
- Fellouah, H.; Castelain, C.; Ould El Moctar, A.; Peerhossaini, H. A Criterion for Detection of the Onset of Dean Instability in Newtonian Fluids. Eur. J. Mech. B/Fluids 2006, 25, 505–531.
- Duryodhan, V.S.; Chatterjee, R.; Govind Singh, S.; Agrawal, A. Mixing in Planar Spiral Microchannel. Exp. Therm. Fluid Sci. 2017, 89, 119–127.
- Baheri Islami, S.; Khezerloo, M. Enhancement of Mixing Performance of Non-Newtonian Fluids Using Curving and Grooving of Microchannels. J. Appl. Fluid Mech. 2017, 10, 127–141.
- Norouzi, M.; Biglari, N. An Analytical Solution for Dean Flow in Curved Ducts with Rectangular Cross Section. Phys. Fluids 2013, 25, 053602.
- Kim, S.; Lee, S.J. Micro Holographic PTV Measurements of Dean Flows in a Curved Micro-Tube. In Proceedings of the The 12th Asian Congress of Fluid Mechanics, Daejeon, Korea, 18–21 August 2008; pp. 689–690.
- Ma, D.; Zhang, Y.; Chen, Y. Effects of Microchannel Cross-Section Shape on Particle Focusing. In Proceedings of the 2019 IEEE International Conference on Manipulation, Manufacturing and Measurement on the Nanoscale (3M-NANO), Zhenjiang, China, 4–8 August 2019; pp. 237–240.
- Altay, R.; Yetisgin, A.A.; Erdem, K.; Koşar, A. The Effect of Varying Radius of Curvature on Mixing in Elliptical Spiral Microchannels. Chem. Eng. Process.-Process Intensif. 2021, 164, 108401.
- Ookawara, S.; Street, D.; Ogawa, K. Numerical Study on Development of Particle Concentration Profiles in a Curved Microchannel. Chem. Eng. Sci. 2006, 61, 3714–3724.
- Johnston, I.D.; McDonnell, M.B.; Tan, C.K.L.; McCluskey, D.K.; Davies, M.J.; Tracey, M.C. Dean Flow Focusing and Separation of Small Microspheres within a Narrow Size Range. Microfluid. Nanofluidics 2014, 17, 509–518.
- Chung, K.Y.; Brewster, M.E.; Belfort, G. Dean Vortices with Wall Flux in a Curved Channel Membrane System: 2. The Velocity Field. AIChE J. 1996, 42, 347–358.
- Schönfeld, F.; Hardt, S. Simulation of Helical Flows in Microchannels. AIChE J. 2004, 50, 771–778.


