Submitted Successfully!
To reward your contribution, here is a gift for you: A free trial for our video production service.
Thank you for your contribution! You can also upload a video entry or images related to this topic.
Version Summary Created by Modification Content Size Created at Operation
1 -- 2673 2023-12-15 06:34:45 |
2 layout -1 word(s) 2672 2023-12-18 03:14:54 |

Video Upload Options

Do you have a full video?

Confirm

Are you sure to Delete?
Cite
If you have any further questions, please contact Encyclopedia Editorial Office.
Yao, D.; Xu, L.; Li, J.; Zhang, C. Bus Low-Fare Policy. Encyclopedia. Available online: https://encyclopedia.pub/entry/52789 (accessed on 02 July 2024).
Yao D, Xu L, Li J, Zhang C. Bus Low-Fare Policy. Encyclopedia. Available at: https://encyclopedia.pub/entry/52789. Accessed July 02, 2024.
Yao, Di, Liqun Xu, Jinpei Li, Chunqin Zhang. "Bus Low-Fare Policy" Encyclopedia, https://encyclopedia.pub/entry/52789 (accessed July 02, 2024).
Yao, D., Xu, L., Li, J., & Zhang, C. (2023, December 15). Bus Low-Fare Policy. In Encyclopedia. https://encyclopedia.pub/entry/52789
Yao, Di, et al. "Bus Low-Fare Policy." Encyclopedia. Web. 15 December, 2023.
Bus Low-Fare Policy
Edit

Sustainable development has reached a consensus in all fields of the world. Transport sustainability is the mainstream of sustainable development goals. As a key component of urban transportation systems, the role of public transport has been established as a critical element in promoting sustainable development due to its affordability, efficiency and convenience. From the description by the previous literature, public transport sustainability generally can be broadly and narrowly defined. In a broad sense, the development of public transport coordinates with the urban economy, society, and environmental resources. In a narrow sense, dynamic transit bus networks, smart technological support and effective fare policy are also related to the sustainable development of public transport. 

bus fare policy sustainability evaluation fiscal subsidy PSR model matter–element extension model

1. Introduction

According to the theory of public goods, the urban public bus is a kind of quasi-public goods, which has both public welfare and profitability [1]. From the total level of social welfare, the bus fare must take into account both fairness and efficiency by implementing price control. At the same time, in order to compensate for the policy losses of bus enterprises caused by the price control, the government generally provides fiscal subsidies to them to ensure their survival and development [2]. Therefore, “government pricing accompanied with subsidies” has become the practice of public bus development in many countries [3].
The Chinese government has offered the bus priority policy for more than ten years [4]. The bus low-fare policy is one of the main measures to support the priority policy since it can significantly reduce the travel costs of the public and play the role of price leverage to attract more riders to use buses [5][6][7]. However, there is an “unsustainable” risk in the implementation of the bus low-fare policy. Beijing is an example. In Beijing, the bus fare was reduced on 1 January 2007 across the board, with a low-fare scheme, starting with CNY 1, 40% off the bus cards and 20% off the student tickets. The actual average bus fare was CNY 0.58 per person per trip, becoming the lowest bus fare in China. Since then, the amount of bus subsidies has increased year after year, from more than CNY 4 billion to more than CNY 20 billion, a five-fold increase in seven years, which caused a great fiscal burden on the local government. Under this pressure, the Beijing government had to adjust the bus low-fare scheme in 2014. The average bus fare after the fare adjustment was about CNY 1.30 per person per trip. It was found that about 95% of the surveyed bus enterprises had operating losses due to the bus low-fare policy, and the government fiscal subsidies actually received by the enterprises can only cover about 35.9% of the operating costs [8].
The above example illustrates that although the bus low-fare policy can reduce the travel cost of the public and attract more people to use buses, excessively low fares will not only impose an excessive fiscal burden on the government but also harm the economic interests of bus enterprises, ultimately resulting in a mandatory change in or even termination of the policy. How to ensure the sustainable implementation of the bus low-fare policy should be the primary problem faced by policymakers and managers, as well as an important issue in the field of urban public transport. While abundant studies have theoretically established fare optimization models and regulation mechanisms from various perspectives [9][10][11], which provide many ideas for the better implementation of bus fare policy, the evaluation of bus low-fare policy from the perspective of sustainability is still necessary to identify its weaknesses and make improvements. According to Brundtland’s definition of sustainability, a sustainable public transport system is generally considered both meeting the current travel needs of residents and the future needs of future generations [12].

2. Transport Sustainability

Over the years, a large number of empirical studies have been conducted investigating the impact of public transport fare on ridership attraction [13][14][15][16][17][18][19]. Fare elasticity is defined as the percentage change in public transport demand after a one percent change in the fare, under the assumption that all other factors are kept constant [20]. The industry standard for fare elasticity is called the Simpson–Curtin rule: the demand for transit service declines by one-third for every one percent increase in fare, i.e., the fare elasticity is −0.33 [21]. In the absence of more effective information, many U.S. transit properties still rely on this rule when projecting the likely effects of a proposed fare policy [22]. Correspondingly, fare reduction is a significant factor in attracting bus users [23]. Given the 2017 public transport fare policy change introduced in South East Queensland, Australia, Liu et al. (2019) examined how the fare policy reform affects public transport ridership through a set of statistical analyses and spatial lag regression [19]. Their findings show that public transit ridership can be boosted by reducing the fare cost per journey. In summary, many researchers have provided evidence that a low fare can reduce the travel cost of the public and provide an initial motivation to encourage people to use buses more [24].
Public transport subsidies are justified for three factors: the existence of economies of scale and the Mohring effect in public transport services; price distortions or externalities in competitive modes; and distributional issues [25]. Fare revenues are the main source of income for public transport operators [26]. Meanwhile, it has proved to be extremely costly to provide high-quality bus services; thus, subsidies to public transport are also part of the costs covered by the government and offer incentives to improve service levels [27][28]. Due to the low-fare policy, fare revenues cover a lower proportion of costs, and public transport subsidies have to be greatly increased. Pucher and Kurth (1995) analyzed the reasons for the success of five metropolitan regions, namely Hamburg, Munich, the Rhein-Ruhr region, Vienna and Zurich, in attracting more public transport riders and increasing or at least stabilizing public transport’s share of modal split [29]. They found that the low fare made public transport operators unable to make ends meet and threatened the supply quality of the public transport service, but adequate government financial support is crucial to its continued improvement in service quality.
Regarding the interactions among fares, bus service quantity and quality, ridership attraction and fiscal subsidies, Jin et al. (2019) concluded that the ridership attraction depends on both the bus service and fare level, while higher fares allow bus operators to provide a better service [30]. A good but expensive bus service and a cheap but low-quality bus service seem to offer a choice. From the viewpoint of maximizing social welfare, lower fares are preferable. Therefore, to ensure bus service quantity and quality at lower fares, the government has to provide more subsidies for bus operators. In this regard, Figure 1 intuitively depicts the general relationships among bus fare, fiscal subsidy, bus service quantity and quality and ridership attraction. The relationships among these variables are very important for the subsequent policy evaluation.
Figure 1. The general relationships among bus fare, fiscal subsidy, service quality and ridership attraction.

3. Establishing the Sustainability Evaluation Index System

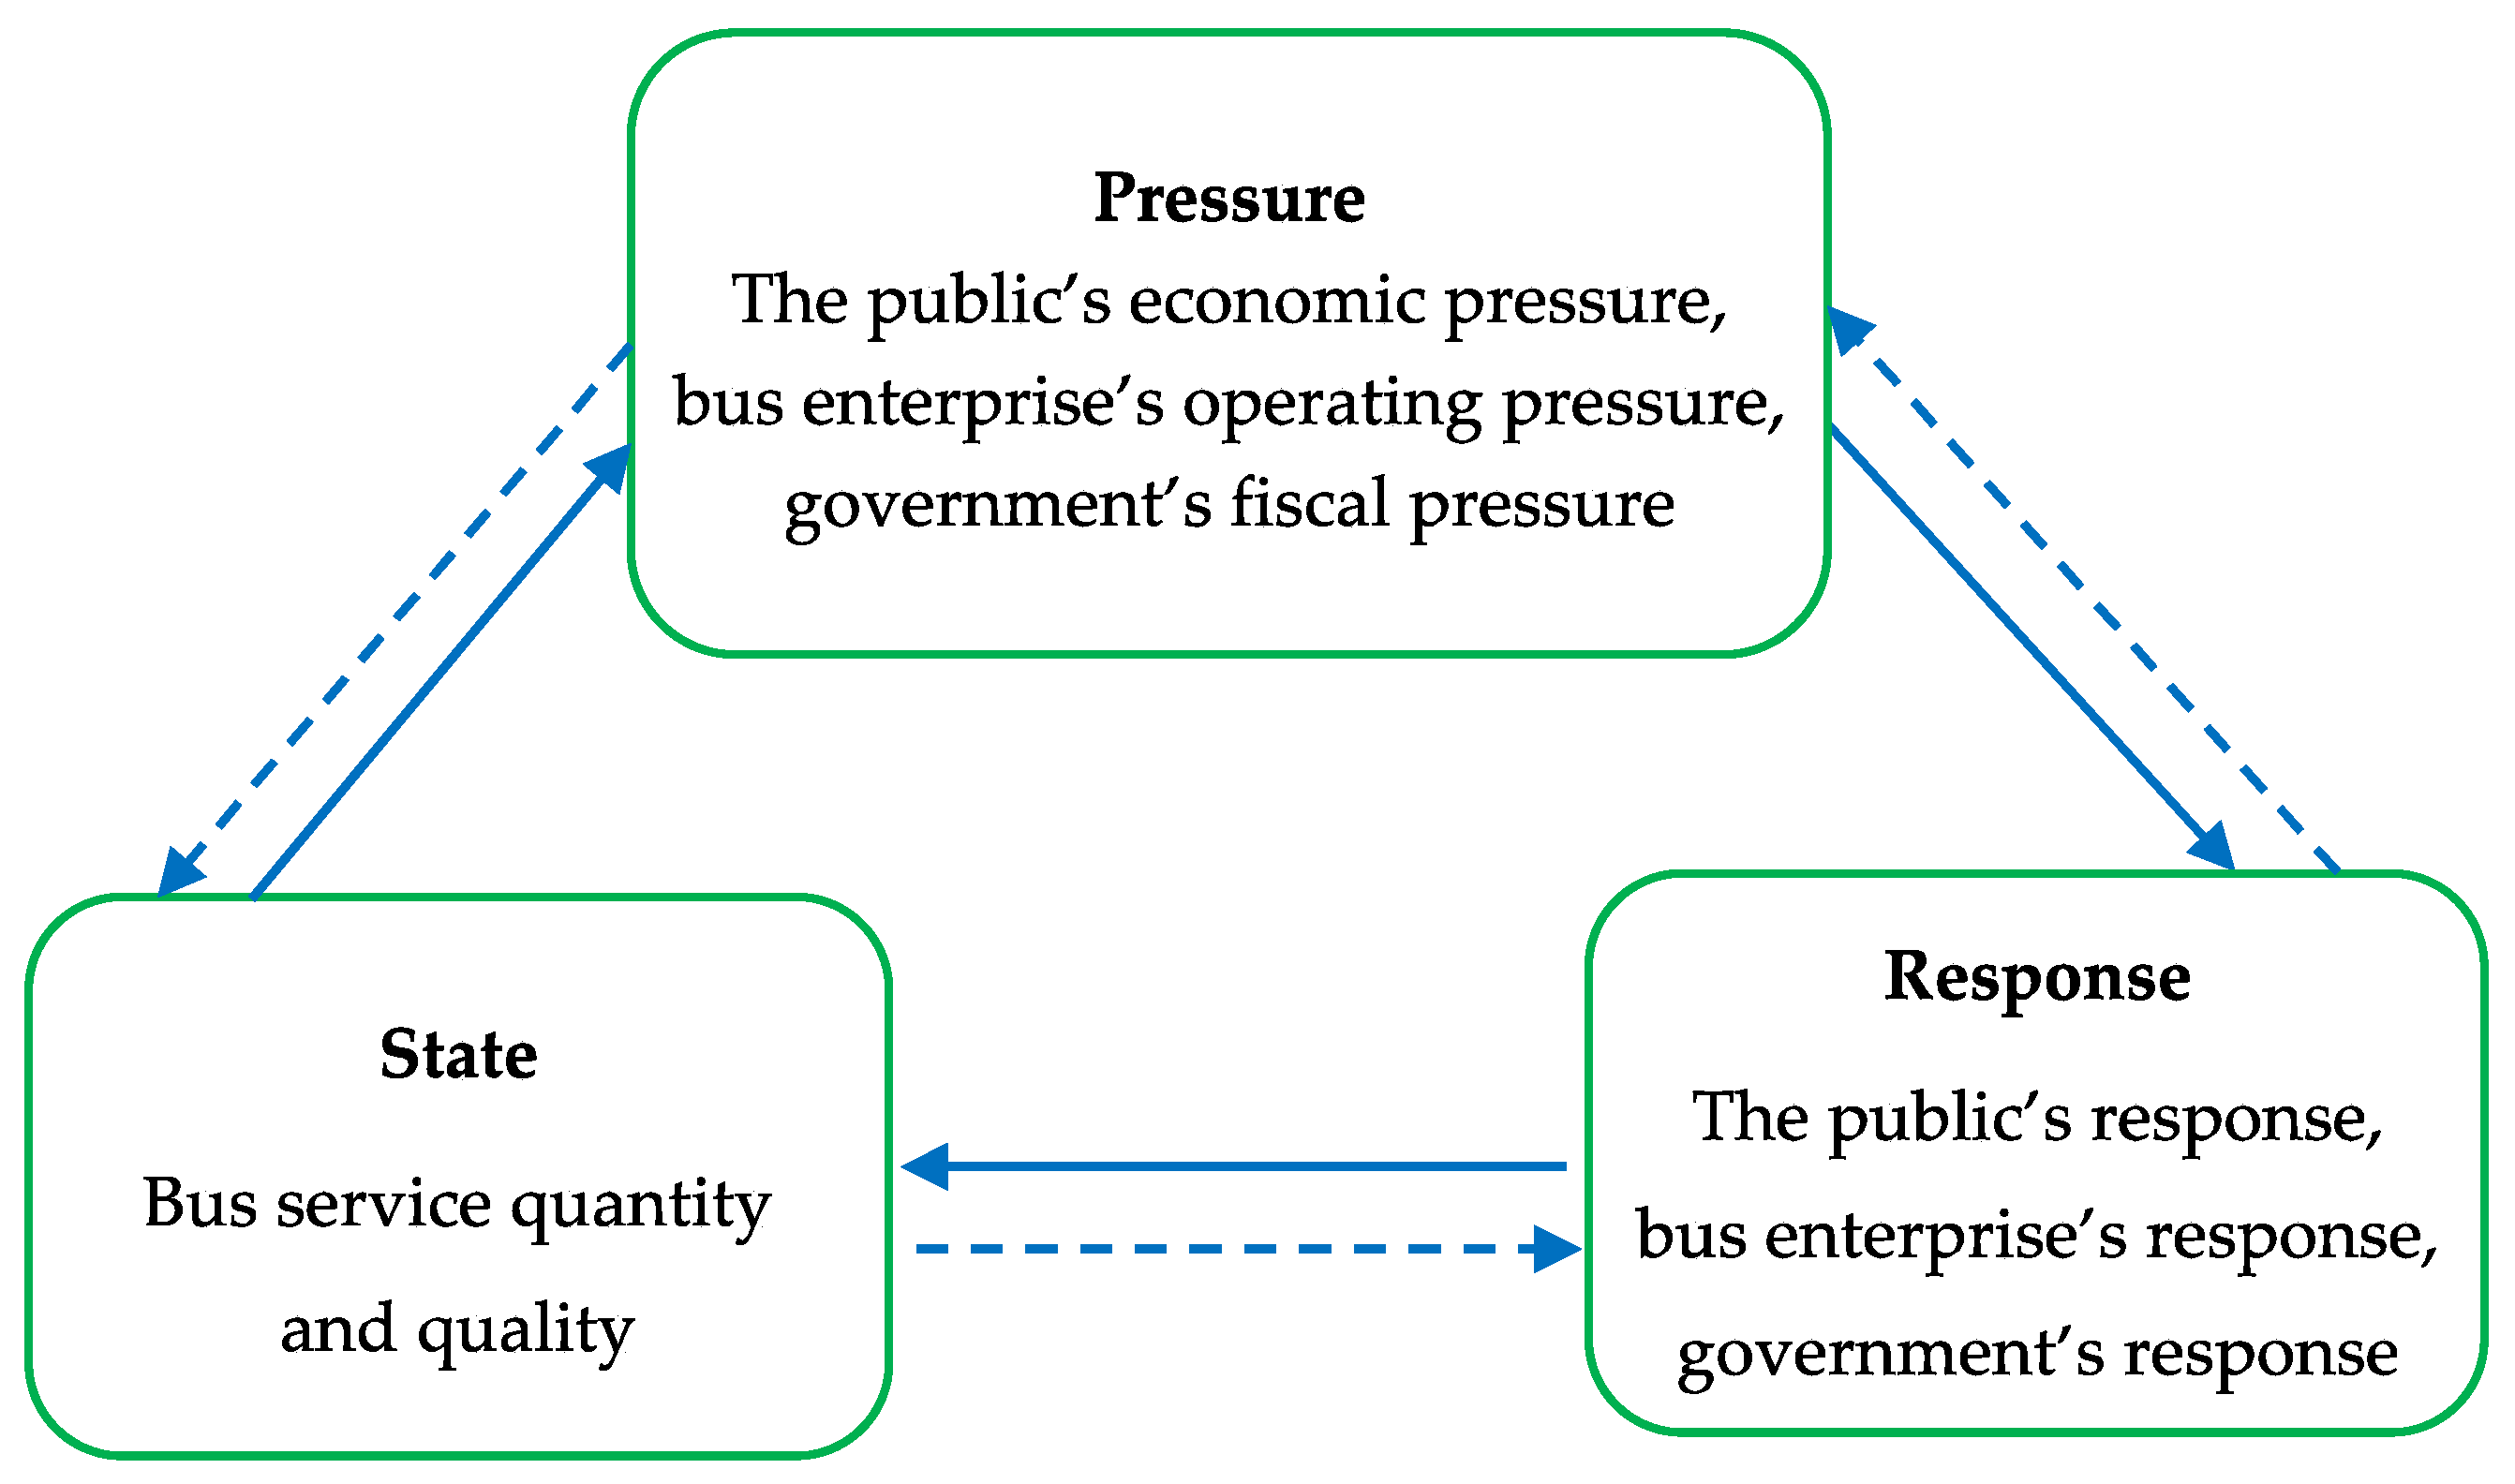
3.1. Application of PSR Model

The PSR model (Pressure–State–Response) was first proposed by David J. Rapport and Tony Friend in 1979, and was further refined, eventually forming a set of theoretical frameworks for studying environment, resources and sustainability. P (pressure) describes the impact of human and social activities on the environment; S (state) presents the state and changes of the environment under the influence of human factors; and R (response) describes the repair and remedial measures taken by human society in response to environmental destruction [31]. These three aspects show the changes and dynamic mechanism of things under the combined effect of multiple factors, and answer the three basic questions related to sustainable development: why, what happened, and how to do it. They are suitable for the study of sustainable development. Since the PSR model has the advantages of wide index coverage, the ability to reflect the dynamic creation mechanism of multiple subjects and clear causality, it has been applied to many research fields, such as the evaluation of urban entrepreneurship environment [32], the assessment of enterprise green innovation [33] and the evaluation of urban rail transit sustainable development [34]. These studies show that the PSR model is not limited to the evaluation of natural resources and the environment, but also can further expand its research scope.
The urban public bus system is similar to an ecosystem. The multiple stakeholders involved in the bus fare policy (i.e., the public, bus enterprises and the government) will interact with each other and are always in a dynamic equilibrium. Specifically, the bus low-fare policy has a negative or positive pressure on all stakeholders. Then, different stakeholders make different responses to cope with the pressure. These responses further have an impact on the performance of a bus system, which can be described by bus service quantity and quality [35]. The bus system forms an organic dynamic cycle under the effect of bus fare policy, as shown in Figure 2. It can be seen that the PSR model is applicable to the sustainability evaluation of bus low-fare policy.
Figure 2. PSR framework to bus low-fare policy sustainability.

3.2. Evaluation Indicator Selection

According to the PSR model, the sustainability evaluation indexes of bus low-fare policy contain three aspects: pressure indicators, state indicators and response indicators. Combined with theoretical research and practical difficulties, this research selects eleven indicators to evaluate the sustainability of bus low-fare policy, as shown in Table 1. It should be noted that the selection of these indicators follows three principles: (1) the selected indicator is affected by the bus fare policy, and there are interactions between indicators. (2) Considering the impact of external variables on the bus system (e.g., population, economic level, etc.), evaluation indicators prefer relative values rather than absolute values. For example, researchers choose mode split rate instead of ridership, service coverage instead of the length of lines and the number of stations, and the ownership ratio instead of the number of vehicles. (3) Avoid repetition between indicators. It is worth mentioning that there are competitive and complementary relationships between buses and rail transit, private cars, ridesourcing and other transportation modes [36][37][38]. The availability, travel costs and service level of these transportation modes collectively determine the travel behavior of urban residents, and further impact the service status of buses. Therefore, the sustainability of bus low-fare policy may be affected by all modes of transportation. Among the above indicators, the indicator of “bus modal share in motorized travel” represents the residents’ choice behavior under the combined effect of bus low-fare policy and all modes of transportation, and the indicators of bus service quantity and quality, such as “bus service coverage” “bus ownership ratio” and “departure frequency”, represent the service status of buses under the bus low-fare policy and the competition and cooperation of all transportation modes.

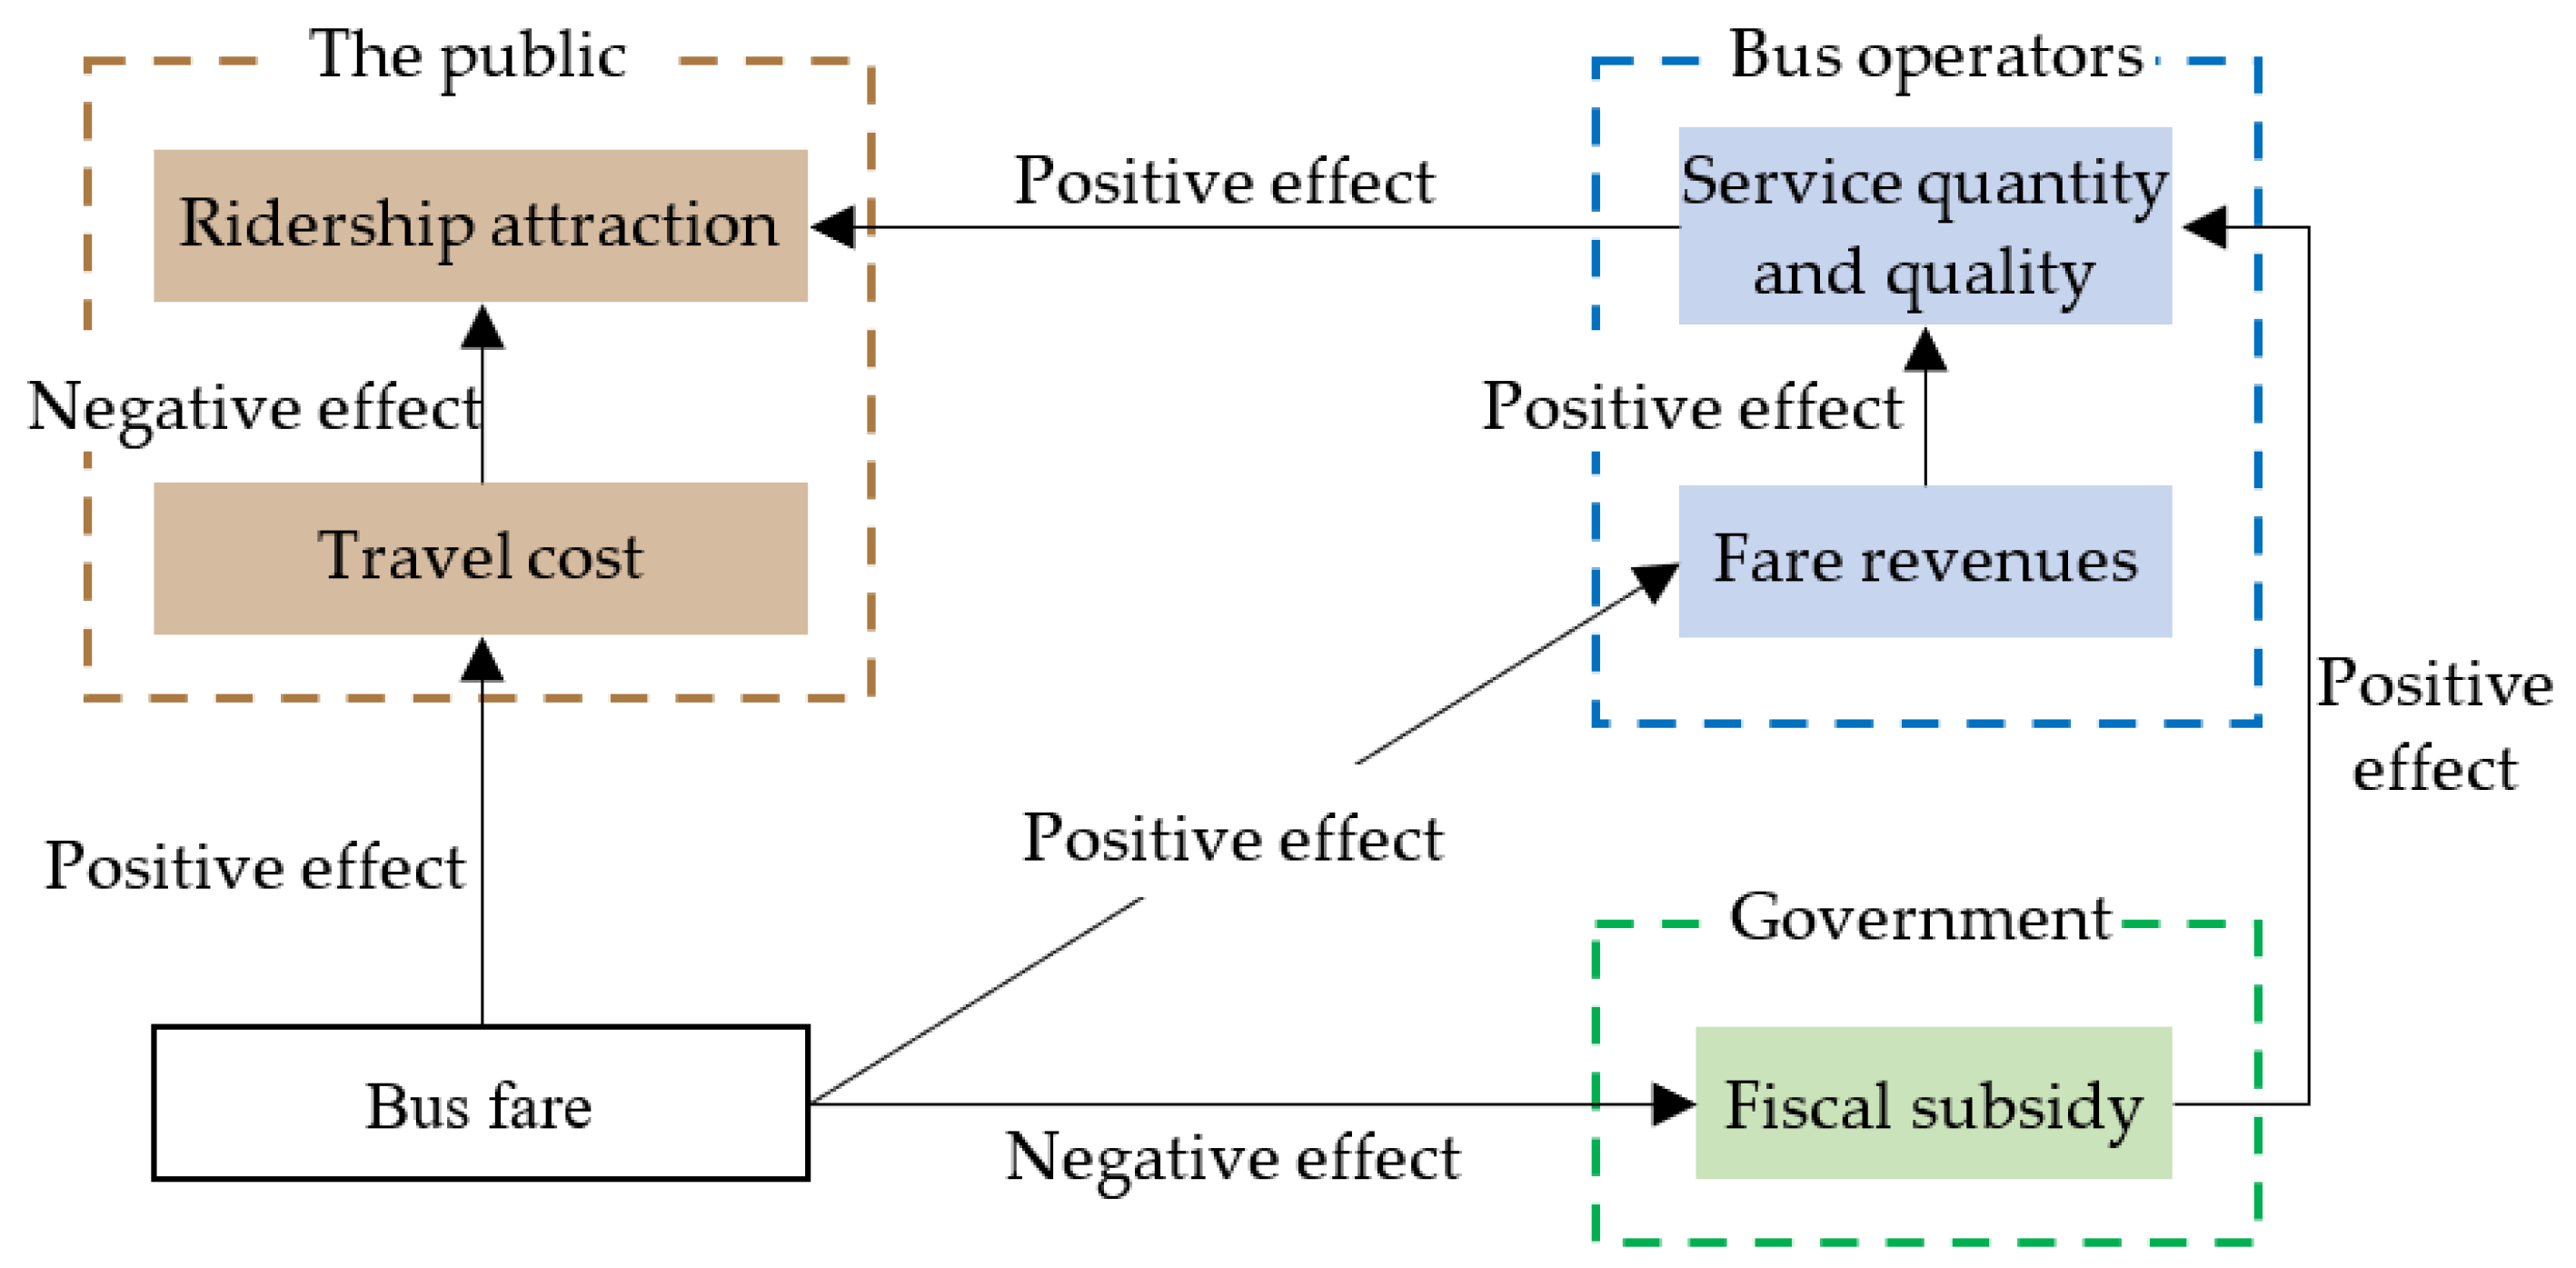
3.2.1. Pressure Indicators

Bus fares directly affect the public’s travel costs; thus, the main pressure on the public caused by bus fares is economic pressure. Hereto, researchers adopted the indicator of “bus costs as a percentage of disposable income” to represent the public pressure. The larger the value of this indicator, the greater the economic pressure of the public.
As the main operators of a public bus, the main pressure caused by the bus low-fare policy is the operating pressure due to the reduction in fare revenue. If the fare revenue is significantly reduced, the bus enterprises will suffer serious losses once the fiscal subsidies are insufficient or not available, which will affect the enterprises’ normal operation. In this regard, researhers chose the indicator of “passenger revenue as a percentage of operating costs” to represent the pressure of bus enterprise. The larger the value of this indicator, the lower the operating pressure of the bus enterprise.
The low-fare policy is inevitably accompanied by high fiscal subsidies. Generally speaking, the lower the fare is, the higher the amount of subsidy there tends to be. As the makers of the bus fare policy, the government hopes to achieve certain social benefits through the low-fare policy on the one hand, and on the other hand hopes that it does not pay excessive fiscal expenditures [39]. Therefore, the main pressure on the government caused by the bus low-fare policy is fiscal pressure. The indicator of “bus subsidy as a percentage of fiscal revenue” is selected to represent the pressure of the government. The larger the value of this indicator, the higher the fiscal pressure of the government.

3.2.2. State Indicators

The bus low-fare policy makes bus enterprises suffer from operating losses and threatens the supply quantity and quality of bus services [8][29]. Regarding the quantity of bus services, the scale of bus lines, stations and fleets have been recognized as being representative of the bus service quantity [4]. Hereto, researchers adopted the indicator of “the coverage rate within 500 m of bus stations (namely the bus service coverage)” and “the number of buses per 10,000 members of the population (namely the bus ownership ratio)” to represent the bus service quantity. The larger the value of the two indicators, the greater the bus service quantity.
The bus service quality is a complex multidimensional construct [40][41]. For a bus trip, attributes of bus service quality involve walking time to/from the station, waiting time for the vehicle, traveling time and comfort in the bus [42][43]. Among them, the waiting time, traveling time and comfort will be affected by the increase in bus demand caused by the low-fare policy [30]. Thus, the indicators of “departure frequency”, “average operating speed during morning and evening peak hours”, and “mean crowding during morning and evening peak hours” were selected. The larger the values of departure frequency and average operating speed, the better the bus service quality, while the smaller the values of mean crowding, the better the bus service quality.

3.2.3. Response Indicators

The attractiveness of a public bus compared to personal transport determines the demand for the bus system [44]. A number of empirical studies have demonstrated that the lower the fare, the more attractive the bus is to travelers [30][45]. This is exactly the main reason why many countries implement the bus low-fare policy to alleviate traffic congestion. Therefore, the main response of the public to the low-fare policy is the shift of travel mode choice behavior. In this research, researchers use the indicator of “bus modal share in motorized travel” (i.e., the proportion of bus travels to the total number of motorized travels) to represent the public’s response. The larger the value of this indicator, the more positive the public’s response.
Faced with the operating pressure brought by the low-fare policy, the most likely response of bus enterprises is to adjust their operating scheme to reduce their operating costs; or even to obtain as many fiscal subsidies as possible through speculative behavior, which eventually leads to the increase in operating costs and low operational efficiency [46][47]. Therefore, researchers selected the indicator of “operating cost per vehicle-kilometer” to represent the response of bus enterprises. The larger the value of this indicator, the more negative the response of bus enterprises.
In order to avoid the negative response of bus enterprises, and stimulate their market autonomies and the supply efficiency of bus services, the government’s usual response measure is to link the subsidy amount with incentives and their performance. In this regard, researchers selected the indicator of “proportion of subsidy linked to performance” (i.e., the subsidy amount linked to performance as a percentage of the total subsidy) to represent the government’s response. The larger the value of this indicator, the more positive the response of the government.

References

  1. Gwilliam, K. A review of issues in transit economics. Res. Transp. Econ. 2008, 23, 4–22.
  2. Fei, S. Parking versus public transport subsidies: Case study of Nanjing, China. Transp. Lett. 2016, 8, 90–97.
  3. Li, R.; Yang, X.; Shi, Q. Study of urban public transportation finance subsidy policy abroad. Urban Stud. 2002, 3, 62–65+70.
  4. Yao, D.; Xu, L.; Li, J. Does technical efficiency play a mediating role between bus facility scale and ridership attraction? Evidence from bus practices in China. Transp. Res. Policy Pract. 2020, 132, 77–96.
  5. McLeod, M.; Flannelly, K.; Flannelly, L.; Behnke, R. Multivariate time-series model of transit ridership based on historical, aggregate data: The past, present, and future of Honolulu. Transp. Res. Rec. 1991, 1297, 76–84.
  6. Borndörfer, R.; Karbstein, M.; Pfetsch, M.E. Models for fare planning in public transport. Discret. Appl. Math. 2012, 160, 2591–2605.
  7. Lee, M.T.; Yeh, C.F. Causal effects between bus revenue vehicle-kilometers and bus ridership. Transp. Res. Policy Pract. 2019, 130, 54–64.
  8. Chen, J.; Lin, C.; Liu, X. Microscopic Analysis on Current Situation of Public Transport Enterprises-Based on The Survey Data. Urban Public Transp. 2013, 6, 28–31.
  9. Kamel, I.; Shalaby, A.; Abdulhai, B. A modelling platform for optimizing time-dependent transit fares in large-scale multimodal networks. Transp. Policy 2020, 92, 38–54.
  10. Guo, Q.; Sun, Y.; Schonfeld, P.; Li, Z. Time-dependent transit fare optimization with elastic and spatially distributed demand. Transp. Res. Policy Pract. 2021, 148, 353–378.
  11. Asplund, D.; Pyddoke, R. Optimal fares and frequencies for bus services in a small city. Res. Transp. Econ. 2020, 80, 100796.
  12. Schipper, L. Sustainable urban transport in the 21st century: A new agenda. Transp. Res. Rec. 2002, 1792, 12–19.
  13. Thøgersen, J. Promoting public transport as a subscription service: Effects of a free month travel card. Transp. Policy 2009, 16, 335–343.
  14. Taylor, B.D.; Miller, D.; Iseki, H.; Fink, C. Nature and/or nurture? Analyzing the determinants of transit ridership across US urbanized areas. Transp. Res. Policy Pract. 2009, 43, 60–77.
  15. Chen, C.; Varley, D.; Chen, J. What affects transit ridership? A dynamic analysis involving multiple factors, lags and asymmetric behaviour. Urban Stud. 2011, 48, 1893–1908.
  16. Gkritza, K.; Karlaftis, M.G.; Mannering, F.L. Estimating multimodal transit ridership with a varying fare structure. Transp. Res. Policy Pract. 2011, 45, 148–160.
  17. Frondel, M.; Vance, C. Rarely enjoyed? A count data analysis of ridership in Germany’s public transport. Transp. Policy 2011, 18, 425–433.
  18. Wang, Z.; Li, X.; Chen, F. Impact evaluation of a mass transit fare change on demand and revenue utilizing smart card data. Transp. Res. Policy Pract. 2015, 77, 213–224.
  19. Liu, Y.; Wang, S.; Xie, B. Evaluating the effects of public transport fare policy change and built and non-built environment features on ridership: The case in South East Queensland, Australia. Transp. Policy 2019, 76, 78–89.
  20. Kholodov, Y.; Jenelius, E.; Cats, O.; van Oort, N.; Mouter, N.; Cebecauer, M.; Vermeulen, A. Public transport fare elasticities from smartcard data: Evidence from a natural experimen. Transp. Policy 2021, 105, 35–43.
  21. Curtin, J.F. Effects of fares on transit riding. Highw. Res. Rec. 1968, 213, 8–20.
  22. Cervero, R. Transit pricing research. Transportation 1990, 17, 117–139.
  23. Sharaby, N.; Shiftan, Y. The impact of fare integration on travel behavior and transit ridership. Transp. Policy 2012, 21, 63–70.
  24. Redman, L.; Friman, M.; Gärling, T.; Hartig, T. Quality attributes of public transport that attract car users: A research review. Transp. Policy 2013, 25, 119–127.
  25. Batarce, M.; Galilea, P. Cost and fare estimation for the bus transit system of Santiago. Transp. Policy 2018, 64, 92–101.
  26. Rye, T.; Carreno, M. Concessionary fares and bus operator reimbursement in Scotland and Wales: No better or no worse off? Transp. Policy 2008, 15, 242–250.
  27. Zhang, C.; Juan, Z.; Luo, Q.; Xiao, G. Performance evaluation of public transit systems using a combined evaluation method. Transp. Policy 2016, 45, 156–167.
  28. Ling, S.; Jia, N.; Ma, S.; Lan, Y.; Hu, W. An incentive mechanism design for bus subsidy based on the route service level. Transp. Res. Policy Pract. 2019, 119, 271–283.
  29. Pucher, J.; Kurth, S. Verkehrsverbund: The success of regional public transport in Germany, Austria and Switzerland. Transp. Policy 1995, 2, 279–291.
  30. Jin, Z.; Schmöcker, J.D.; Maadi, S. On the interaction between public transport demand, service quality and fare for social welfare optimisation. Res. Transp. Econ. 2019, 76, 100732.
  31. Wang, Q.; Li, S.; Li, R. Evaluating water resource sustainability in Beijing, China: Combining PSR model and matter-element extension method. J. Clean. Prod. 2019, 206, 171–179.
  32. Xie, X.; Huang, J. An Evaluation Analysis of Urban Entrepreneurship Environment Based on PSR Model: Case of Wuhan. China Soft Sci. 2017, 2017, 172–182.
  33. Peng, D.; Dong, T. Driving Force-State-Response Evaluation Method of Enterprise Green Innovation. Soft Sci. 2023, 37, 31–39. Available online: https://kns.cnki.net/kcms/detail/51.1268.G3.20220725.1840.013.html (accessed on 13 November 2023).
  34. Yang, Z.; Chen, X. Evaluation of urban rail transit sustainable development based on the PSR model. In Proceedings of the 16th COTA International Conference of Transportation Shanghai, 1941–1950, Shanghai, China, 6–9 July 2016.
  35. Kang, C.; Feng, C.; Liao, B.; Khan, A.H. Accounting for air pollution emissions and transport policy in the measurement of the efficiency and effectiveness of bus transits. Transp. Lett. 2019, 12, 349–361.
  36. Yang, C.; Yu, C.; Dong, W.; Yuan, Q. Substitutes or complements? Examining effects of urban rail transit on bus ridership using longitudinal city-level data. Transp. Res. Policy Pract. 2023, 174, 103728.
  37. Hall, J.D.; Palsson, C.; Price, J. Is Uber a substitute or complement for public transit? J. Urban Econ. 2018, 108, 36–50.
  38. Shi, K.; Shao, R.; Vos, J.D.; Cheng, L.; Witlox, F. The influence of ride-hailing on travel frequency and mode choice. Transp. Res. Transp. Environ. 2021, 101, 103125.
  39. Sakai, H.; Shoji, K. The effect of governmental subsidies and the contractual model on the publicly-owned bus sector in Japan. Res. Transp. Econ. 2010, 29, 60–71.
  40. Hensher, D.A. The Relationship between Bus Contract Costs, User Perceived Service Quality and Performance Assessment. Int. J. Sustain. Transp. 2014, 8, 5–27.
  41. Guirao, B.; García-Pastor, A.; López-Lambas, M.E. The importance of service quality attributes in public transportation: Narrowing the gap between scientific research and practitioners’ needs. Transp. Policy 2016, 49, 68–77.
  42. Ojo, K.T. Quality of public transport service: An integrative review and research agenda. Transp. Lett. 2019, 11, 104–116.
  43. Yao, D.; Xu, L.; Zhang, C.; Li, J. Revisiting the interactions between bus service quality, car ownership and mode use: A case study in Changzhou, China. Transp. Res. Policy Pract. 2021, 154, 329–344.
  44. Norouzian-Maleki, P.; Izadbakhsh, H.; Saberi, M.; Hussain, O.; Rezaee, J.M.; GhanbarTehrani, N. An integrated approach to system dynamics and data envelopment analysis for determining efficient policies and forecasting travel demand in an urban transport system. Transp. Lett. 2022, 14, 157–173.
  45. Thøgersen, J. Understanding repetitive travel mode choices in a stable context: A panel study approach. Transp. Res. Policy Pract. 2006, 40, 621–638.
  46. Bly, P.H.; Webster, F.V.; Pounds, S. Effects of subsidies on urban public transport. Transportation 1980, 9, 311–331.
  47. Lave, C. Measuring the Decline in Transit Productivity in the U.S. Transp. Plan. Technol. 1991, 15, 115–124.
More
Information
Contributors MDPI registered users' name will be linked to their SciProfiles pages. To register with us, please refer to https://encyclopedia.pub/register : , , ,
View Times: 150
Revisions: 2 times (View History)
Update Date: 18 Dec 2023
1000/1000
Video Production Service