Over the years, a large number of empirical studies have been conducted investigating the impact of public transport fare on ridership attraction [
20,
21,
22,
23,
24,
25,
26]. Fare elasticity is defined as the percentage change in public transport demand after a one percent change in the fare, under the assumption that all other factors are kept constant [
27]. The industry standard for fare elasticity is called the Simpson–Curtin rule: the demand for transit service declines by one-third for every one percent increase in fare, i.e., the fare elasticity is −0.33 [
28]. In the absence of more effective information, many U.S. transit properties still rely on this rule when projecting the likely effects of a proposed fare policy [
29]. Correspondingly, fare reduction is a significant factor in attracting bus users [
30]. Given the 2017 public transport fare policy change introduced in South East Queensland, Australia, Liu et al. (2019) examined how the fare policy reform affects public transport ridership through a set of statistical analyses and spatial lag regression [
26]. Their findings show that public transit ridership can be boosted by reducing the fare cost per journey. In summary, many researchers have provided evidence that a low fare can reduce the travel cost of the public and provide an initial motivation to encourage people to use buses more [
31].
Public transport subsidies are justified for three factors: the existence of economies of scale and the Mohring effect in public transport services; price distortions or externalities in competitive modes; and distributional issues [
32]. Fare revenues are the main source of income for public transport operators [
33]. Meanwhile, it has proved to be extremely costly to provide high-quality bus services; thus, subsidies to public transport are also part of the costs covered by the government and offer incentives to improve service levels [
34,
35]. Due to the low-fare policy, fare revenues cover a lower proportion of costs, and public transport subsidies have to be greatly increased. Pucher and Kurth (1995) analyzed the reasons for the success of five metropolitan regions, namely Hamburg, Munich, the Rhein-Ruhr region, Vienna and Zurich, in attracting more public transport riders and increasing or at least stabilizing public transport’s share of modal split [
36]. They found that the low fare made public transport operators unable to make ends meet and threatened the supply quality of the public transport service, but adequate government financial support is crucial to its continued improvement in service quality.
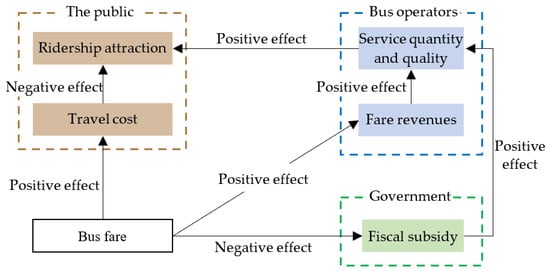
Regarding the interactions among fares, bus service quantity and quality, ridership attraction and fiscal subsidies, Jin et al. (2019) concluded that the ridership attraction depends on both the bus service and fare level, while higher fares allow bus operators to provide a better service [
37]. A good but expensive bus service and a cheap but low-quality bus service seem to offer a choice. From the viewpoint of maximizing social welfare, lower fares are preferable. Therefore, to ensure bus service quantity and quality at lower fares, the government has to provide more subsidies for bus operators. In this regard,
Figure 1 intuitively depicts the general relationships among bus fare, fiscal subsidy, bus service quantity and quality and ridership attraction. The relationships among these variables are very important for the subsequent policy evaluation.
Figure 1. The general relationships among bus fare, fiscal subsidy, service quality and ridership attraction.
3. Establishing the Sustainability Evaluation Index System
3.1. Application of PSR Model
The PSR model (Pressure–State–Response) was first proposed by David J. Rapport and Tony Friend in 1979, and was further refined, eventually forming a set of theoretical frameworks for studying environment, resources and sustainability. P (pressure) describes the impact of human and social activities on the environment; S (state) presents the state and changes of the environment under the influence of human factors; and R (response) describes the repair and remedial measures taken by human society in response to environmental destruction [
38]. These three aspects show the changes and dynamic mechanism of things under the combined effect of multiple factors, and answer the three basic questions related to sustainable development: why, what happened, and how to do it. They are suitable for the study of sustainable development. Since the PSR model has the advantages of wide index coverage, the ability to reflect the dynamic creation mechanism of multiple subjects and clear causality, it has been applied to many research fields, such as the evaluation of urban entrepreneurship environment [
39], the assessment of enterprise green innovation [
40] and the evaluation of urban rail transit sustainable development [
41]. These studies show that the PSR model is not limited to the evaluation of natural resources and the environment, but also can further expand its research scope.
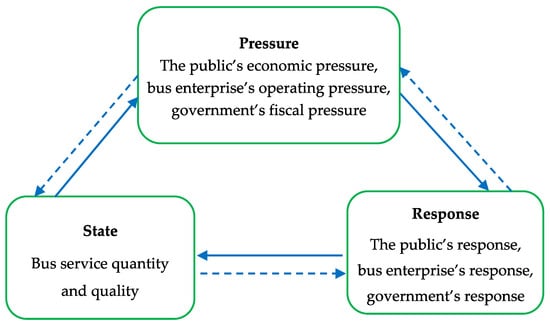
The urban public bus system is similar to an ecosystem. The multiple stakeholders involved in the bus fare policy (i.e., the public, bus enterprises and the government) will interact with each other and are always in a dynamic equilibrium. Specifically, the bus low-fare policy has a negative or positive pressure on all stakeholders. Then, different stakeholders make different responses to cope with the pressure. These responses further have an impact on the performance of a bus system, which can be described by bus service quantity and quality [
42]. The bus system forms an organic dynamic cycle under the effect of bus fare policy, as shown in
Figure 2. It can be seen that the PSR model is applicable to the sustainability evaluation of bus low-fare policy.
Figure 2. PSR framework to bus low-fare policy sustainability.
3.2. Evaluation Indicator Selection
According to the PSR model, the sustainability evaluation indexes of bus low-fare policy contain three aspects: pressure indicators, state indicators and response indicators. Combined with theoretical research and practical difficulties, this study selects eleven indicators to evaluate the sustainability of bus low-fare policy, as shown in
Table 1. It should be noted that the selection of these indicators follows three principles: (1) the selected indicator is affected by the bus fare policy, and there are interactions between indicators. (2) Considering the impact of external variables on the bus system (e.g., population, economic level, etc.), evaluation indicators prefer relative values rather than absolute values. For example, we choose mode split rate instead of ridership, service coverage instead of the length of lines and the number of stations, and the ownership ratio instead of the number of vehicles. (3) Avoid repetition between indicators. It is worth mentioning that there are competitive and complementary relationships between buses and rail transit, private cars, ridesourcing and other transportation modes [
43,
44,
45]. The availability, travel costs and service level of these transportation modes collectively determine the travel behavior of urban residents, and further impact the service status of buses. Therefore, the sustainability of bus low-fare policy may be affected by all modes of transportation. Among the above indicators, the indicator of “bus modal share in motorized travel” represents the residents’ choice behavior under the combined effect of bus low-fare policy and all modes of transportation, and the indicators of bus service quantity and quality, such as “bus service coverage” “bus ownership ratio” and “departure frequency”, represent the service status of buses under the bus low-fare policy and the competition and cooperation of all transportation modes.
3.2.1. Pressure Indicators
Bus fares directly affect the public’s travel costs; thus, the main pressure on the public caused by bus fares is economic pressure. Hereto, we adopted the indicator of “bus costs as a percentage of disposable income” to represent the public pressure. The larger the value of this indicator, the greater the economic pressure of the public.
As the main operators of a public bus, the main pressure caused by the bus low-fare policy is the operating pressure due to the reduction in fare revenue. If the fare revenue is significantly reduced, the bus enterprises will suffer serious losses once the fiscal subsidies are insufficient or not available, which will affect the enterprises’ normal operation. In this regard, we chose the indicator of “passenger revenue as a percentage of operating costs” to represent the pressure of bus enterprise. The larger the value of this indicator, the lower the operating pressure of the bus enterprise.
The low-fare policy is inevitably accompanied by high fiscal subsidies. Generally speaking, the lower the fare is, the higher the amount of subsidy there tends to be. As the makers of the bus fare policy, the government hopes to achieve certain social benefits through the low-fare policy on the one hand, and on the other hand hopes that it does not pay excessive fiscal expenditures [
46]. Therefore, the main pressure on the government caused by the bus low-fare policy is fiscal pressure. The indicator of “bus subsidy as a percentage of fiscal revenue” is selected to represent the pressure of the government. The larger the value of this indicator, the higher the fiscal pressure of the government.
3.2.2. State Indicators
The bus low-fare policy makes bus enterprises suffer from operating losses and threatens the supply quantity and quality of bus services [
8,
36]. Regarding the quantity of bus services, the scale of bus lines, stations and fleets have been recognized as being representative of the bus service quantity [
4]. Hereto, we adopted the indicator of “the coverage rate within 500 m of bus stations (namely the bus service coverage)” and “the number of buses per 10,000 members of the population (namely the bus ownership ratio)” to represent the bus service quantity. The larger the value of the two indicators, the greater the bus service quantity.
The bus service quality is a complex multidimensional construct [
47,
48]. For a bus trip, attributes of bus service quality involve walking time to/from the station, waiting time for the vehicle, traveling time and comfort in the bus [
49,
50]. Among them, the waiting time, traveling time and comfort will be affected by the increase in bus demand caused by the low-fare policy [
37]. Thus, the indicators of “departure frequency”, “average operating speed during morning and evening peak hours”, and “mean crowding during morning and evening peak hours” were selected. The larger the values of departure frequency and average operating speed, the better the bus service quality, while the smaller the values of mean crowding, the better the bus service quality.
3.2.3. Response Indicators
The attractiveness of a public bus compared to personal transport determines the demand for the bus system [
51]. A number of empirical studies have demonstrated that the lower the fare, the more attractive the bus is to travelers [
37,
52]. This is exactly the main reason why many countries implement the bus low-fare policy to alleviate traffic congestion. Therefore, the main response of the public to the low-fare policy is the shift of travel mode choice behavior. In this study, we use the indicator of “bus modal share in motorized travel” (i.e., the proportion of bus travels to the total number of motorized travels) to represent the public’s response. The larger the value of this indicator, the more positive the public’s response.
Faced with the operating pressure brought by the low-fare policy, the most likely response of bus enterprises is to adjust their operating scheme to reduce their operating costs; or even to obtain as many fiscal subsidies as possible through speculative behavior, which eventually leads to the increase in operating costs and low operational efficiency [
53,
54]. Therefore, we selected the indicator of “operating cost per vehicle-kilometer” to represent the response of bus enterprises. The larger the value of this indicator, the more negative the response of bus enterprises.
In order to avoid the negative response of bus enterprises, and stimulate their market autonomies and the supply efficiency of bus services, the government’s usual response measure is to link the subsidy amount with incentives and their performance. In this regard, we selected the indicator of “proportion of subsidy linked to performance” (i.e., the subsidy amount linked to performance as a percentage of the total subsidy) to represent the government’s response. The larger the value of this indicator, the more positive the response of the government.