Submitted Successfully!
To reward your contribution, here is a gift for you: A free trial for our video production service.
Thank you for your contribution! You can also upload a video entry or images related to this topic.
Version Summary Created by Modification Content Size Created at Operation
1 -- 5085 2023-12-07 14:08:23 |
2 format correct Meta information modification 5085 2023-12-11 09:42:49 | |
3 format correct -4 word(s) 5081 2023-12-29 04:47:01 |

Video Upload Options

Do you have a full video?

Confirm

Are you sure to Delete?
Cite
If you have any further questions, please contact Encyclopedia Editorial Office.
Ali, A.; Zhang, N.; Santos, R.M. Mineral Characterization Using Scanning Electron Microscopy (SEM). Encyclopedia. Available online: https://encyclopedia.pub/entry/52492 (accessed on 29 April 2024).
Ali A, Zhang N, Santos RM. Mineral Characterization Using Scanning Electron Microscopy (SEM). Encyclopedia. Available at: https://encyclopedia.pub/entry/52492. Accessed April 29, 2024.
Ali, Asif, Ning Zhang, Rafael M. Santos. "Mineral Characterization Using Scanning Electron Microscopy (SEM)" Encyclopedia, https://encyclopedia.pub/entry/52492 (accessed April 29, 2024).
Ali, A., Zhang, N., & Santos, R.M. (2023, December 07). Mineral Characterization Using Scanning Electron Microscopy (SEM). In Encyclopedia. https://encyclopedia.pub/entry/52492
Ali, Asif, et al. "Mineral Characterization Using Scanning Electron Microscopy (SEM)." Encyclopedia. Web. 07 December, 2023.
Mineral Characterization Using Scanning Electron Microscopy (SEM)
Edit

Scanning electron microscopy (SEM) is a powerful tool in the domains of materials science, mining, and geology owing to its enormous potential to provide unique insight into micro and nanoscale worlds. The rapid pace of technological development requires a detailed study of minerals to a further extent to meet the unprecedented material demands of the evolving world. There are more than 5956 species of minerals known today, and the number of new identifications is evolving, with as many as 50 new types identified each year. Quantitative measurements and qualitative analyses of mineral compositions within mining ores and reservoirs have valuable importance with practical applications. Comprehensive and accurate information can be gathered for the identification of rocks and minerals, including structural characteristics and mineral composition, which can provide worthy information about pore structure and reservoir heterogeneity.

scanning electron microscopy minerals artificial intelligence machine learning energy-dispersive spectrometer secondary electron imaging

1. Scanning Electron Microscopy and Mineral Characterization

SEM makes use of secondary electron imaging to analyze the surface topology and morphology of micron/nanometer-scale minerals [1]. For a comprehensive understanding of the microstructure and mineral components, SEM is usually combined with X-ray techniques to complement the acquired information [2][3][4][5]. The infrared spectroscopy method is helpful in identifying chemical species and determining the molecular structure of minerals. This technique has been widely used in mineral characterization [6][7][8][9].
One of the major quantitative analysis methods in mineral analysis is X-ray diffraction (XRD). It correlates the content of minerals with diffraction density, which helps in identifying and quantifying the minerals present in the sample [10][11]. For example, XRD can be used to analyze calcite and nahcolite in saline brine [12], evaluate deposits by identifying minerals in phyllite [13], examine the order degree of dolomite [14], and study the content of calcite and dolomite in carbonate rocks [15]. XRD is a rapid and accurate method for quantitative mineral analysis; however, some mineral compositional structures could lead to errors in analytical results [10].
Combining qualitative analysis with quantification assessment methods can provide a better understanding of the investigated minerals. Such methods include SEM energy-dispersive spectroscopy (SEM–EDS) [15][16][17][18][19], automated SEM mineral liberation analysis (SEM-MLA) [20][21][22], and quantitative evaluation of minerals by scanning electron microscopy (QEMSCAN) [23][24][25]. These methods incorporate a mineral quantitative analysis system by using an energy spectrometer and SEM. For accurate identification of minerals, backscattered electron (BSE) images are used, which can reflect the difference between the X-ray energy spectrum and mineral phase composition [26][27][28]. The quantitative analysis of rare earth minerals is a challenging task with conventional identification methods, and the abovementioned techniques have attained rare earth mineral identification. The problems associated with the usage of these methods pertain to difficulties in application, promotion, and high measurement costs.

1.1. SEM Energy-Dispersive X-ray Spectroscopy (SEM–EDS)

When the electron beam emitted from the gun penetrates and interacts with the volume beneath the sample surface, X-rays are generated. This is a well-established principle in physics: the deceleration of electrons due to their entrance into the Coulomb field of the specimen results in a loss of electron energy and emits photons. In SEM analysis, similar X-ray photons are emitted, which are characteristic of the sample under investigation [26].
The quantification scheme is achieved by measuring the X-ray intensity. This was illustrated by Heinrich and Yakowitz in 1968 in their publication, Quantitative Electron Probe Microanalysis [29], which later became the standard for developing X-ray fields. At that time, X-ray absorption, determination of correction factors at the instant of electron penetration and scattering, and conversion of X-ray intensity to the relative concentration were missing. Many problems pertaining to the electron probe field were solved with the development of energy-dispersive spectrometry (EDS). At present, various studies have incorporated SEM–EDS for qualitative and semiquantitative analysis in a variety of subject areas [30][31][32][33][34][35][36].
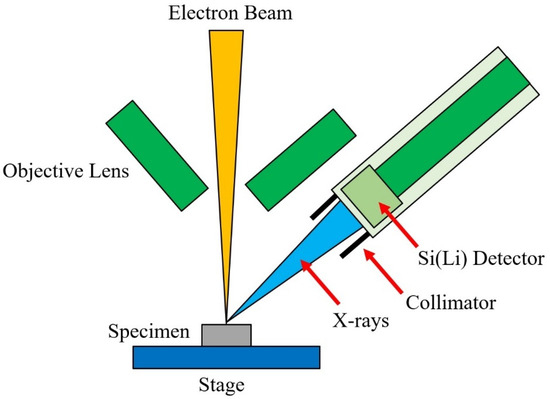
A schematic diagram of an energy-dispersive spectrometer is shown in Figure 1. The X-ray detection system (which is a solid-state detector) separates the characteristic X-rays of various elements present in the sample. Then, the EDS system software analyzes the energy spectrum to determine the amplitudes of particular elements, and electrical signals are generated from the respective photon energies. This results in qualitative and quantitative determination of a chemical composition map of the elements present in the sample [26]. SEM–EDS has been used in a variety of fields for mineral characterization [37][38][39][40][41][42][43].
Figure 1. Schematic diagram of an energy-dispersive spectrometer.

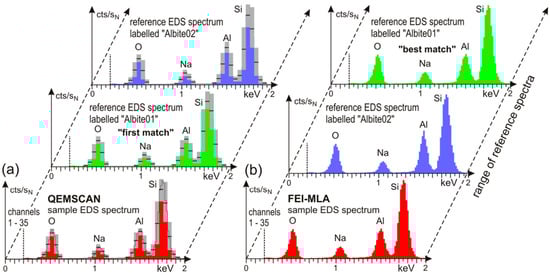
1.2. SEM-Based Automated Mineralogy (SEM-AM)

SEM-AM is a tool that was initially designed to characterize mineral processing products and ores. The measurement process starts with collecting backscattered electron (BSE) images, which are analyzed using image analysis software procedures. Based on BSE image adjustments, the energy-dispersive X-ray spectra (EDS) are obtained at selected points. The EDS spectra of the sample are then classified based on the list of approved reference EDS spectra. Relevant software providers offer services such as particle analysis, EDS spectral mapping, sparse phase search, and point counting modal analysis using four principal SEM-AM measurement routines and different classification algorithms, which can be used based on the analysis requirements. The main challenges associated with the process are materials with very different hardnesses, polishing relief surfaces of particles, electron beam stability, and appropriate nonevaporating epoxy resin mixtures [21].
SEM-based automated mineralogy (SEM-AM) is still underutilized, although SEM instruments are widely distributed in industry, geosciences, and materials research. SEM-AM can produce valuable results for a variety of major applications by characterizing the primary ores and optimizing mineral concentration, flotation, comminution, and metallurgical processes in the mining industry through the generation of quantified reliable data [44][45][46][47][48]. Beyond the classical fields, the potential of SEM-AM has gained further interest on scientific and economic grounds. Some closely related topics are ore fingerprinting, metallurgy, and applications in petrology [49][50][51].
SEM-AM systems are a combination of hardware platforms, processing software, and specific image analysis. Any SEM with minor adjustments can be used as a hardware tool for SEM-AM. These adjustments include a high vacuum operation mode and additional internal mainboards. A vacuum pressure of 10−5 to 10−7 Pa is needed for its operation. Electron sources of tungsten cathodes and field emission guns can be employed. Tungsten cathodes can be used for economical operation; however, field emission guns are recommended for the long-term stability of electron beams for automated measurements. The speed of analysis and X-ray count rate are increased in SEM-AM by employing two or more EDS spectrometers in the SEM hardware. Multiple samples can be accommodated in a large sample chamber for simultaneous analysis in a single measurement session. A very accurate stage movement of SEM allows precise positioning using small intervals. For valuable analysis results, a fine-quality backscattered electron (BSE) detector is needed. In SEM-AM analysis, BSE image quality and stability are important factors, as the resultant image (in combination with the EDS spectrum) is used for phase or mineral discrimination. Prior to measurement, fixed working distances must be set to keep the BSE image gray levels constant [21].
Keeping the image calibration constant ensures that a specific phase or mineral always possesses the same BSE image gray level. The calibration process can be conducted with various BSE image gray levels of reference materials such as quartz (dark gray), copper (intermediate), and gold (very bright) 
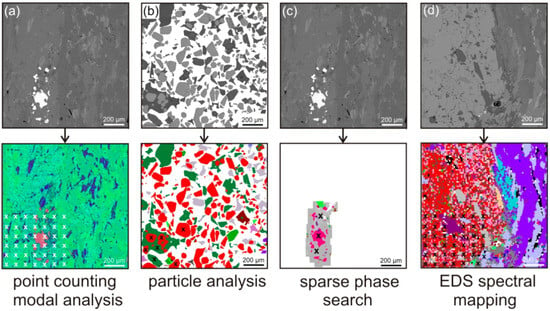
[21]. The choice of calibration reference material should be made based on the sample material to be investigated. For example, many slags, industrial ash, or particulate materials are investigated using SEM-AM, and quartz or copper are used for calibration with dark gray to intermediate BSE image gray levels. This results in SEM images with better resolution and quality. For SEM-AM technology, four principal measurement routines can be outlined, which starts with collecting BSE gray-level images with respect to the calibrated gray level, as shown in Figure 2. The upper row represents the BSE images, while the bottom row indicates the EDS images of SEM-AM of one measurement frame. White or black crosses denote the points of X-ray analyses (only some points are shown). Figure 2 presents the EDS point counting technique used for the quantification of modal composition. Figure 2 shows particle analysis by EDS, which has been developed for fast automated characterization of grain mounts with up to 106 particles, such as milled products from mineral processing and mining. Figure 2 illustrates the sparse phase search method, which combines single spot EDS spectral analysis of grains with a BSE gray tone value trigger. It is valuable in massive rock applications, such as drill cores and thin sections. Figure 2 demonstrates EDS spectral mapping, which combines BSE image levels with mapping of the EDS spectrum. This method is helpful, especially in cases where fine details of mineral intergrowth are considered. In summary, SEM-AM is a powerful tool for mineral characterization and has actively been used in recent literature [52][53][54][55].
Figure 2. SEM-AM methods of one measurement frame showing BSE (upper row, ad) and EDS (lower row) images. Numerous single EDS analysis points map each grain with a distinguishable BSE gray level and are visualized as color-coded pixels, such as the garnet grain, which is indicated by red-colored pixels [21]. CC-BY.

1.3. Automated SEM Mineral Liberation Analysis (SEM-MLA)

Recent software developments in SEM have incited dominant growth in its application in solid matter investigations. One of the economic solutions is the use of mineral liberation analysis (MLA) for optimizing the mineral processing methodology of metallic ores. SEM-MLA has been an important driver in transforming numerous software versions for SEM applications [21]. SEM-MLA was designed to quantify the mineralogy of ores. After the mining process, the ore is processed to increase the concentration of minerals of interest (and value). The processing of ores is also important for removing minerals of no value or those with detrimental effects on the needed mineral products. This processing of grinding the ores and liberating the minerals of interest provided rapid automated analysis of target minerals and extensively improved the process.
A mineral liberation analyzer (MLA) based on SEM was developed in the late 1990s by the JKRMC (Julius Kruttschnitt Mineral Research Centre, Australia), and it is currently commercially available [55]. In MLA, minerals are differentiated by attaining and combining the information gathered from EDS and BSE. Depending on the size range of the particles in the sample, size fractions from the sample are produced. Then, liberation is measured in each size fraction, followed by liberation reconstruction of the whole sample. The measurement of mineral liberation is usually carried out through one of two methods, i.e., either the area method or the linear intercept method. Liberation by area measurement has shown lower stereological error compared to linear measurement.
It is important to note that liberation measurements by the linear intercept method are known as one-dimensional, while area method measurements are called two-dimensional liberations. Both of the measured liberations are lower dimensional projections of the true volumetric liberation, which is three-dimensional. Stereological correction is based on stereological transformation and prediction of liberation measurements. This stereological correction can be based on entropy regularization [56]. Correction of the apparent liberation and production of three-dimensional liberations have also been described in several other investigations [57][58][59]. Various operating modes for the MLA system are available, i.e., X-ray modal analysis (XMOD), particle X-ray mapping (PXMAP), selected particle X-ray mapping (SXMAP), sparse phase liberation analysis (SPL), standard BSE liberation analysis (BSE), extended BSE liberation analysis (XBSE), and rare phase search (RPS) 
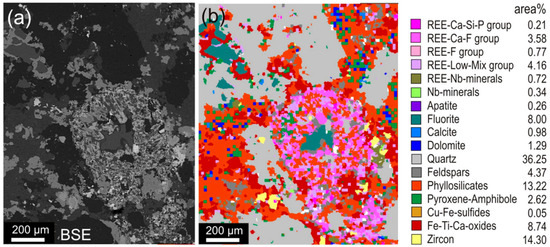
[60]. The use of SEM-MLA is shown in Figure 3 for quantifying the mineralogy of a hydrothermally overprinted alkali plutonite [22].
Figure 3. (a) SEM-MLA measurement of a hydrothermally overprinted alkali plutonite showing the backscattered electron (BSE) image and (b) color-coded, grouped, and classified presentation of the frame presented in (a) [22]. CC-BY.

1.4. Quantitative Evaluation of Minerals by Scanning Electron Microscopy (QEMSCAN)

Traditional mineral analysis based on microscopy cannot provide the needed data because of the absence of quantitative information and the very small size of the particles of interest. QEMSCAN technology, initially termed QEM*SEM, demonstrated the potential to revolutionize automated mineralogy [61]. In a mold, the particulate mineral sample is mixed with epoxy resin, and the sample surface is prepared using cutting, polishing, and carbon coating. The sample is scanned using SEM in backscatter mode, enabling the differentiation of particles from the background. After the identification of particles on the resin block, their composition is systematically mapped using EDS. In contrast to the most modern SEMs coupled with single EDX, QEMSCAN possesses the attribute of having multiple EDXs at the same time, enabling rapid quantitative mineralogy. The acquired EDX signals are then compared with reference known materials in the database and assigned a mineral name or to a chemical compositional grouping. With this process, the mineralogy of the sample can be determined by particle-by-particle analysis [61]. QEMSCAN locates the particles using a BSE signal, while identifying the mineral by an EDS signal. It can be compared to SEM-MLA, which makes more use of the BSE signal than EDS for identifying the mineral. SEM-MLA works very well for bright phases (such as platinum group element minerals).
Among SEM–EDS techniques, QEMSCAN is one of the most widely used and offers quantitative characterization of minerals, ores, and other mineralogical compounds [62][63][64][65][66]. QEMSCAN is usually used in conjunction with other analytical techniques, such as electron probe microanalysis (EPMA) and X-ray diffraction (XRD), as shown in Table 1 [67]. 
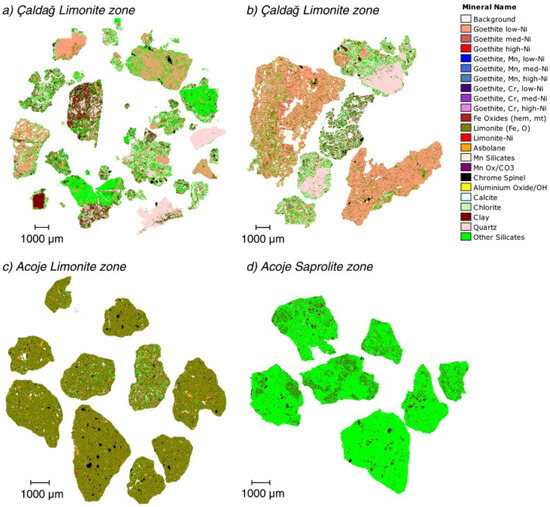
Figure 4 indicates the use of QEMSCAN for identifying the mineral distribution of four samples [67]. It shows the presence of geothite, quartz, clay, limonite, and other silicate minerals.
Figure 4. QEMSCAN analysis indicating mineral distribution in four different zones [67]. CC-BY.
Table 1. Techniques used for investigating mineralogy and their comparison. ✔ indicates good, ● represents poor, while ▲ suggests it is possible but not recommended [67].
Investigation Electron Microprobe XRD QEMSCAN
Mineral texture ✔✔✔
Mineral distribution and associations ✔✔
Mineral-specific particle size information ✔✔
Mineral abundance ✔✔✔ ✔✔✔
Amorphous minerals (geothite, silica) ✔✔✔ ✔✔✔
Distribution of minor metals within minerals ✔✔✔
Crystallinity (clay, silica, geothite, and limonite) ✔✔✔

References

  1. Li, C.; Wang, D.; Kong, L. Application of Machine Learning Techniques in Mineral Classification for Scanning Electron Microscopy—Energy Dispersive X-Ray Spectroscopy (SEM-EDS) Images. J. Pet. Sci. Eng. 2020, 200, 108178.
  2. Wen, Y.; Cheng, Y.; Liu, Z.; Liu, C.; Nie, Q. Application of SEM and EDS for mineral composition of shale gas reservoir. IOP Conf. Ser. Mater. Sci. Eng. 2020, 780, 042055.
  3. Nikonow, W.; Rammlmair, D. Automated mineralogy based on micro-energy-dispersive X-ray fluorescence microscopy (µ-EDXRF) applied to plutonic rock thin sections in comparison to a mineral liberation analyzer. Geosci. Instrum. Methods Data Syst. 2017, 6, 429–437.
  4. Chalouati, S.; Yoosefdoost, A.; Chiang, Y.W.; Santos, R.M. Intensified mineral carbonation of natural Canadian silicates using simultaneous ball milling. Int. J. Coal Geol. 2023, 277, 104332.
  5. Santos, R.M.; Knops, P.C.M.; Rijnsburger, K.L.; Chiang, Y.W. CO2 Energy Reactor—Integrated Mineral Carbonation: Perspectives on Lab-Scale Investigation and Products Valorization. Front. Energy Res. 2016, 4.
  6. Lammers, K.; Murphy, R.; Riendeau, A.; Smirnov, A.; Schoonen, M.A.A.; Strongin, D.R. CO2 Sequestration through Mineral Carbonation of Iron Oxyhydroxides. Environ. Sci. Technol. 2011, 45, 10422–10428.
  7. Haque, F.; Santos, R.M.; Chiang, Y.W. Using nondestructive techniques in mineral carbonation for understanding reaction fundamentals. Powder Technol. 2019, 357, 134–138.
  8. Zarandi, A.E.; Larachi, F.; Beaudoin, G.; Plante, B.; Sciortino, M. Nesquehonite as a carbon sink in ambient mineral carbonation of ultramafic mining wastes. Chem. Eng. J. 2017, 314, 160–168.
  9. Fantucci, H.; Sidhu, J.S.; Santos, R.M. Mineral Carbonation as an Educational Investigation of Green Chemical Engineering Design. Sustainability 2019, 11, 4156.
  10. Ali, A.; Chiang, Y.W.; Santos, R.M. X-ray Diffraction Techniques for Mineral Characterization: A Review for Engineers of the Fundamentals, Applications, and Research Directions. Minerals 2022, 12, 205.
  11. Klug, H.P.; Alexander, L.E. X-ray Diffraction Procedures: For Polycrystalline and Amorphous Materials, 2nd ed.; Wiley: Hoboken, NJ, USA, 1974; ISBN 978-0-471-49369-3.
  12. Ali, A.; Mendes, C.E.; de Melo, L.G.T.C.; Wang, J.; Santos, R.M. Production of Sodium Bicarbonate with Saline Brine and CO2 Co-Utilization: Comparing Modified Solvay Approaches. Crystals 2023, 13, 470.
  13. Chi, G.C.; Xiao, G.; Chen, Y.L.; Wu, Y.; Hu, J.-F.; Wang, H.-J.; Yue, M.-X.; Wang, X. Application of X-ray powder diffractometer in the identification and classification of phyllite. Geol. Resour. 2013, 22, 409–414.
  14. Zhang, X.-h. Controlling factors of order degree of dolomite in carbonate rocks: A case study from lower palezoic in Tahe oilfield and Triassic in northeastern Sichuan basin. Lithol. Reserv. 2009, 21, 50–55.
  15. Trindade, M.; Dias, M.; Coroado, J.; Rocha, F. Mineralogical transformations of calcareous rich clays with firing: A comparative study between calcite and dolomite rich clays from Algarve, Portugal. Appl. Clay Sci. 2009, 42, 345–355.
  16. Dri, M.; Sanna, A.; Maroto-Valer, M.M. Mineral carbonation from metal wastes: Effect of solid to liquid ratio on the efficiency and characterization of carbonated products. Appl. Energy 2014, 113, 515–523.
  17. Reynolds, B.; Reddy, K.J.; Argyle, M.D. Field Application of Accelerated Mineral Carbonation. Minerals 2014, 4, 191–207.
  18. Newbury, D.E.; Ritchie, N.W.M. Is Scanning Electron Microscopy/Energy Dispersive X-ray Spectrometry (SEM/EDS) Quantitative? Scanning 2013, 35, 141–168.
  19. Mandal, S.; Kumar, C.J.D.; Kumar, D.; Syed, K.; Van Ende, M.; Jung, I.; Finkeldei, S.C.; Bowman, W.J. Designing environment-friendly chromium-free Spinel-Periclase-Zirconia refractories for Ruhrstahl Heraeus degasser. J. Am. Ceram. Soc. 2020, 103, 7095–7114.
  20. Warlo, M.; Wanhainen, C.; Bark, G.; Butcher, A.R.; McElroy, I.; Brising, D.; Rollinson, G.K. Automated Quantitative Mineralogy Optimized for Simultaneous Detection of (Precious/Critical) Rare Metals and Base Metals in A Production-Focused Environment. Minerals 2019, 9, 440.
  21. Schulz, B.; Sandmann, D.; Gilbricht, S. SEM-Based Automated Mineralogy and its Application in Geo- and Material Sciences. Minerals 2020, 10, 1004.
  22. Schulz, B.; Merker, G.; Gutzmer, J. Automated SEM Mineral Liberation Analysis (MLA) with Generically Labelled EDX Spectra in the Mineral Processing of Rare Earth Element Ores. Minerals 2019, 9, 527.
  23. Smythe, D.M.; Lombard, A.; Coetzee, L.L. Rare Earth Element deportment studies utilising QEMSCAN technology. Miner. Eng. 2013, 52, 52–61.
  24. Rollinson, G.K.; Andersen, J.C.Ø.; Stickland, R.J.; Boni, M.; Fairhurst, R. Characterisation of non-sulphide zinc deposits using QEMSCAN®. Miner. Eng. 2011, 24, 778–787.
  25. Knappett, C.; Pirrie, D.; Power, M.; Nikolakopoulou, I.; Hilditch, J.; Rollinson, G. Mineralogical analysis and provenancing of ancient ceramics using automated SEM-EDS analysis (QEMSCAN®): A pilot study on LB I pottery from Akrotiri, Thera. J. Archaeol. Sci. 2011, 38, 219–232.
  26. Saghiri, M.A.; Asgar, K.; Lotfi, M.; Karamifar, K.; Saghiri, A.M.; Neelakantan, P.; Gutmann, J.L.; Sheibaninia, A. Back-scattered and secondary electron images of scanning electron microscopy in dentistry: A new method for surface analysis. Acta Odontol. Scand. 2012, 70, 603–609.
  27. Kjellsen, K.; Monsøy, A.; Isachsen, K.; Detwiler, R. Preparation of flat-polished specimens for SEM-backscattered electron imaging and X-ray microanalysis—Importance of epoxy impregnation. Cem. Concr. Res. 2003, 33, 611–616.
  28. Santos, R.M.; Ling, D.; Sarvaramini, A.; Guo, M.; Elsen, J.; Larachi, F.; Beaudoin, G.; Blanpain, B.; Van Gerven, T. Stabilization of basic oxygen furnace slag by hot-stage carbonation treatment. Chem. Eng. J. 2012, 203, 239–250.
  29. Heinrich, K.F.J.; Yakowitz, H. Quantitative electron probe microanalysis: Fluorescence correction uncertainty. Microchim. Acta 1968, 56, 905–916.
  30. Duma, Z.-S.; Sihvonen, T.; Havukainen, J.; Reinikainen, V.; Reinikainen, S.-P. Optimizing energy dispersive X-Ray Spectroscopy (EDS) image fusion to Scanning Electron Microscopy (SEM) images. Micron 2022, 163, 103361.
  31. Scimeca, M.; Bischetti, S.; Lamsira, H.K.; Bonfiglio, R.; Bonanno, E. Energy Dispersive X-ray (EDX) microanalysis: A powerful tool in biomedical research and diagnosis. Eur. J. Histochem. 2018, 62, 2841.
  32. Kutchko, B.G.; Kim, A.G. Fly ash characterization by SEM–EDS. Fuel 2006, 85, 2537–2544.
  33. Georget, F.; Wilson, W.; Scrivener, K.L. edxia: Microstructure characterisation from quantified SEM-EDS hypermaps. Cem. Concr. Res. 2020, 141, 106327.
  34. Vermeij, E.; Zoon, P.; Chang, S.; Keereweer, I.; Pieterman, R.; Gerretsen, R. Analysis of microtraces in invasive traumas using SEM/EDS. Forensic Sci. Int. 2012, 214, 96–104.
  35. Girao, A.V.; Caputo, G.; Ferro, M.C. Application of scanning electron microscopy-energy dispersive X-ray spectroscopy (SEM-EDS). Compr. Anal. Chem. 2017, 75, 153–168.
  36. Avula, A.; Galor, A.; Blackwelder, P.; Carballosa-Gautam, M.; Hackam, A.S.; Jeng, B.; Kumar, N. Application of Scanning Electron Microscopy With Energy-Dispersive X-Ray Spectroscopy for Analyzing Ocular Surface Particles on Schirmer Strips. Cornea 2017, 36, 752–756.
  37. Han, S.; Löhr, S.C.; Abbott, A.N.; Baldermann, A.; Farkaš, J.; McMahon, W.; Milliken, K.L.; Rafiei, M.; Wheeler, C.; Owen, M. Earth system science applications of next-generation SEM-EDS automated mineral mapping. Front. Earth Sci. 2022, 10, 956912.
  38. Haque, F.; Santos, R.M.; Chiang, Y.W. Optimizing inorganic carbon sequestration and crop yield with wollastonite soil amendment in a microplot study. Front. Plant Sci. 2020, 11, 1012.
  39. Butera, A.; Pascadopoli, M.; Gallo, S.; Lelli, M.; Tarterini, F.; Giglia, F.; Scribante, A. SEM/EDS Evaluation of the Mineral Deposition on a Polymeric Composite Resin of a Toothpaste Containing Biomimetic Zn-Carbonate Hydroxyapatite (microRepair®) in Oral Environment: A Randomized Clinical Trial. Polymers 2021, 13, 2740.
  40. Santos, R.M.; Van Bouwel, J.; Vandevelde, E.; Mertens, G.; Elsen, J.; Van Gerven, T. Accelerated mineral carbonation of stainless steel slags for CO2 storage and waste valorization: Effect of process parameters on geochemical properties. Int. J. Greenh. Gas Control 2013, 17, 32–45.
  41. Sukmara, S.; Suyanti; Adi, W.A.; Manaf, A.; Gunanto, Y.; Sitompul, H.; Izaak, M.; Jobiliong, E.; Sarwanto, Y. Mineral analysis and its extraction process of ilmenite rocks in titanium-rich cumulates from Pandeglang Banten Indonesia. J. Mater. Res. Technol. 2022, 17, 3384–3393.
  42. Weerakoon, A.T.; Cooper, C.; Meyers, I.A.; Condon, N.; Sexton, C.; Thomson, D.; Ford, P.J.; Symons, A.L. Does dentine mineral change with anatomical location, microscopic site and patient age? J. Struct. Biol. X 2022, 6, 100060.
  43. Jiang, Y.; Li, Y.; Liao, S.; Yin, Z.; Hsu, W. Mineral chemistry and 3D tomography of a Chang’E 5 high-Ti basalt: Implication for the lunar thermal evolution history. Sci. Bull. 2021, 67, 755–761.
  44. Lastra, R. Seven practical application cases of liberation analysis. Int. J. Miner. Process. 2007, 84, 337–347.
  45. Hoal, K.; Stammer, J.; Appleby, S.; Botha, J.; Ross, J.; Botha, P. Research in quantitative mineralogy: Examples from diverse applications. Miner. Eng. 2009, 22, 402–408.
  46. Ford, F.D.; Wercholaz, C.R.; Lee, A. Predicting process outcomes for Sudbury platinum-group minerals using grade-recovery modeling from mineral liberation analyzer (MLA) data. Can. Mineral. 2012, 49, 1627.
  47. Macdonald, M.; Adair, B.; Bradshaw, D.; Dunn, M.; Latti, D. Learnings From Five Years of On-Site Mla at Kennecott Utah Copper Corporation: (Myth Busters Through Quantitative Evidence…). In Proceedings of the 10th International Congress for Applied Mineralogy (ICAM); Springer: Berlin/Heidelberg, Germany, 2012; pp. 419–426.
  48. Anderson, K.F.; Wall, F.; Rollinson, G.K.; Moon, C.J. Quantitative mineralogical and chemical assessment of the Nkout iron ore deposit, Southern Cameroon. Ore Geol. Rev. 2014, 62, 25–39.
  49. Gäbler, H.-E.; Melcher, F.; Graupner, T.; Bahr, A.; Sitnikova, M.A.; Henjes-Kunst, F.; Oberthür, T.; Brätz, H.; Gerdes, A. Speeding Up the Analytical Workflow for Coltan Fingerprinting by an Integrated Mineral Liberation Analysis/LA-ICP-MS Approach. Geostand. Geoanalytical Res. 2011, 35, 431–448.
  50. Lund, C.; Lamberg, P.; Lindberg, T. Practical way to quantify minerals from chemical assays at Malmberget iron ore operations—An important tool for the geometallurgical program. Miner. Eng. 2013, 49, 7–16.
  51. Schulz, B. Polymetamorphism in garnet micaschists of the Saualpe Eclogite Unit (Eastern Alps, Austria), resolved by automated SEM methods and EMP–Th–U–Pb monazite dating. J. Metamorph. Geol. 2016, 35, 141–163.
  52. Pszonka, J.; Schulz, B. SEM Automated Mineralogy applied for the quantification of mineral and textural sorting in submarine sediment gravity flows. Gospod. Surowcami Miner. Miner. Resour. Manag. 2023, 38, 105–131.
  53. Wessels, R.; Kok, T.; van Melick, H.; Drury, M. Constraining P-T conditions using a SEM automated mineralogy based work-flow—An example from Cap de Creus, NE Spain. In Proceedings of the EGU General Assembly Conference 2022, Vienna, Austria, 23–27 May 2022.
  54. Ranta, J.-P.; Cook, N.; Gilbricht, S. SEM-based automated mineralogy (SEM-AM) and unsupervised machine learning studying the textural setting and elemental association of gold in the Rajapalot Au-Co area, northern Finland. Bull. Geol. Soc. Finl. 2021, 93, 129–154.
  55. Gu, Y. Automated scanning electron microscope based mineral liberation analysis. J. Miner. Mater. Charact. Eng. 2003, 2, 33–41.
  56. King, R.; Schneider, C. Stereological correction of linear grade distributions for mineral liberation. Powder Technol. 1998, 98, 21–37.
  57. Chiaruttini, C.; Piga, L.; Schena, G. An assessment of the efficiency of a stereological correction for recovering the volumetric grade of particles from measures on polished sections. Int. J. Miner. Process. 1999, 57, 303–322.
  58. Fandrichi, R.; Schneider, C.; Gay, S. Two stereological correction methods: Allocation method and kernel transformation method. Miner. Eng. 1998, 11, 707–715.
  59. Leigh, G.; Lyman, G.; Gottlieb, P. Stereological estimates of liberation from mineral section measurements: A rederivation of Barbery’s formulae with extensions. Powder Technol. 1996, 87, 141–152.
  60. Goodall, W.R.; Scales, P.J. An overview of the advantages and disadvantages of the determination of gold mineralogy by automated mineralogy. Miner. Eng. 2007, 20, 506–517.
  61. Pirrie, D.; Rollinson, G.K. Unlocking the applications of automated mineral analysis. Geol. Today 2011, 27, 226–235.
  62. Li, B.; Nie, X.; Cai, J.; Zhou, X.; Wang, C.; Han, D. U-Net model for multi-component digital rock modeling of shales based on CT and QEMSCAN images. J. Pet. Sci. Eng. 2022, 216, 110734.
  63. Liu, Z.; Liu, D.; Cai, Y.; Qiu, Y. Permeability, mineral and pore characteristics of coals response to acid treatment by NMR and QEMSCAN: Insights into acid sensitivity mechanism. J. Pet. Sci. Eng. 2020, 198, 108205.
  64. Lin, S.; Hou, L.; Luo, X. Shale Mineralogy Analysis Method: Quantitative Correction of Minerals Using QEMSCAN Based on MAPS Technology. Appl. Sci. 2022, 12, 5013.
  65. Mason, J.; Lin, E.; Grono, E.; Denham, T. QEMSCAN® analysis of clay-rich stratigraphy associated with early agricultural contexts at Kuk Swamp, Papua New Guinea. J. Archaeol. Sci. Rep. 2022, 42, 103356.
  66. Vickery, K.; Eckardt, F. A closer look at mineral aerosol emissions from the Makgadikgadi Pans, Botswana, using automated SEM-EDS (QEMSCAN®). South Afr. Geogr. J. 2020, 103, 7–21.
  67. Andersen, J.C.; Rollinson, G.K.; Snook, B.; Herrington, R.; Fairhurst, R.J. Use of QEMSCAN® for the characterization of Ni-rich and Ni-poor goethite in laterite ores. Miner. Eng. 2009, 22, 1119–1129.
  68. Blannin, R.; Frenzel, M.; Tuşa, L.; Birtel, S.; Ivăşcanu, P.; Baker, T.; Gutzmer, J. Uncertainties in quantitative mineralogical studies using scanning electron microscope-based image analysis. Miner. Eng. 2021, 167, 106836.
  69. Benvie, B.; Chapman, N.M.; Robinson, D.J.; Kuhar, L.L. A robust statistical method for mineralogical analysis in geometallurgical diagnostic leaching. Miner. Eng. 2013, 52, 178–183.
  70. Lastra, R.; Paktunc, D. An estimation of the variability in automated quantitative mineralogy measurements through inter-laboratory testing. Miner. Eng. 2016, 95, 138–145.
  71. Guseva, O.; Opitz, A.K.; Broadhurst, J.L.; Harrison, S.T.; Becker, M. Characterisation and prediction of acid rock drainage potential in waste rock: Value of integrating quantitative mineralogical and textural measurements. Miner. Eng. 2021, 163, 106750.
  72. Leigh, G.; Sutherland, D.; Gottlieb, P. Confidence limits for liberation measurements. Miner. Eng. 1993, 6, 155–161.
  73. Evans, C.L.; Napier-Munn, T.J. Estimating error in measurements of mineral grain size distribution. Miner. Eng. 2013, 52, 198–203.
  74. Mariano, R.A.; Evans, C.L. Error analysis in ore particle composition distribution measurements. Miner. Eng. 2015, 82, 36–44.
  75. Leißnar, T.; Bachmann, K.; Gutzmer, J.; Peuker, U.A. MLA-based partition curves for magnetic separation. Miner. Eng. 2016, 94, 94–103.
  76. Buchmann, M.; Schach, E.; Tolosana-Delgado, R.; Leißner, T.; Astoveza, J.; Kern, M.; Möckel, R.; Ebert, D.; Rudolph, M.; van den Boogaart, K.G.; et al. Evaluation of Magnetic Separation Efficiency on a Cassiterite-Bearing Skarn Ore by Means of Integrative SEM-Based Image and XRF–XRD Data Analysis. Minerals 2018, 8, 390.
  77. Schach, E.; Buchmann, M.; Tolosana-Delgado, R.; Leißner, T.; Kern, M.; van den Boogaart, K.G.; Rudolph, M.; Peuker, U.A. Multidimensional characterization of separation processes—Part 1: Introducing kernel methods and entropy in the context of mineral processing using SEM-based image analysis. Miner. Eng. 2019, 137, 78–86.
  78. Hannula, J.; Kern, M.; Luukkanen, S.; Roine, A.; Boogaart, K.v.D.; Reuter, M. Property-based modelling and simulation of mechanical separation processes using dynamic binning and neural networks. Miner. Eng. 2018, 126, 52–63.
  79. Efron, B. Bootstrap Methods: Another Look at the Jackknife. Ann. Stat. 1979, 7, 1–26.
  80. Chernick, M.R. Bootstrap Methods: A Guide for Practitioners and Researchers; Applied Probability and Statistics; Wiley: Hoboken, NJ, USA, 1999.
  81. Chayes, F.A. Petrographic analysis by fragment counting; Part 1, The counting error. Econ. Geol. 1944, 39, 484–505.
  82. Chayes, F. Petrographic analysis by fragment counting; Part II, Precision of microsampling and the combined error of sampling and counting. Econ. Geol. 1945, 40, 517–525.
  83. Plas, L.V.D.; Tobi, A.C. A chart for judging the reliability of point counting results. Am. J. Sci. 1965, 263, 87–90.
  84. Parian, M.; Lamberg, P.; Mockel, R.; Rosenkranz, J. Analysis of mineral grades for geometallurgy: Combined element-to-mineral conversion and quantitative X-ray diffraction. Miner. Eng. 2015, 82, 25–35.
  85. Jackson, B.R.; Reid, A.F.; Wittenberg, J.C. Rapid production of high quality polished sections for automated image analysis of minerals. Proc. Aust. Inst. Min. Metall. 1984, 289, 93–97.
  86. Rahfeld, A.; Gutzmer, J. MLA-Based Detection of Organic Matter with Iodized Epoxy Resin—An Alternative to Carnauba. J. Miner. Mater. Charact. Eng. 2017, 5, 198–208.
  87. O’brien, G.; Gu, Y.; Adair, B.; Firth, B. The use of optical reflected light and SEM imaging systems to provide quantitative coal characterisation. Miner. Eng. 2011, 24, 1299–1304.
  88. Gomez, C.O.; Strickler, D.W.; Austin, L.G. An iodized mounting medium for coal particles. J. Electron Microsc. Tech. 1984, 1, 285–287.
  89. Alim, A.; Abdullah, M.Z.; Aziz, M.S.A.; Kamarudin, R.; Gunnasegaran, P. Recent Advances on Thermally Conductive Adhesive in Electronic Packaging: A Review. Polymers 2021, 13, 3337.
  90. Yuan, W.; Xiao, Q.; Li, L.; Xu, T. Thermal conductivity of epoxy adhesive enhanced by hybrid graphene oxide/AlN particles. Appl. Therm. Eng. 2016, 106, 1067–1074.
  91. Grundmann, G.; Scholz, H. Preparation Methods in Mineralogy and Geology: The Preparation of Thin Sections, Polished Sections, Acetate Foil Prints, Preparation for Elutriation Analysis and Staining Tests for the Optical and Electron Microscopy; Technical University of Munich: Munich, Germany, 2015.
  92. Rodríguez, J.-R.; Turégano-López, M.; DeFelipe, J.; Merchán-Pérez, A. Neuroanatomy from Mesoscopic to Nanoscopic Scales: An Improved Method for the Observation of Semithin Sections by High-Resolution Scanning Electron Microscopy. Front. Neuroanat. 2018, 12, 14.
  93. Ren, H.; Zhang, X.; Li, Y.; Zhang, D.; Huang, F.; Zhang, Z. Preparation of Cross-Sectional Membrane Samples for Scanning Electron Microscopy Characterizations Using a New Frozen Section Technique. Membranes 2023, 13, 634.
More
Information
Contributors MDPI registered users' name will be linked to their SciProfiles pages. To register with us, please refer to https://encyclopedia.pub/register : , ,
View Times: 261
Revisions: 3 times (View History)
Update Date: 29 Dec 2023
1000/1000