Submitted Successfully!
To reward your contribution, here is a gift for you: A free trial for our video production service.
Thank you for your contribution! You can also upload a video entry or images related to this topic.
Version Summary Created by Modification Content Size Created at Operation
1 -- 2821 2023-11-06 10:47:30 |
2 format change Meta information modification 2821 2023-11-07 04:54:54 |

Video Upload Options

Do you have a full video?

Confirm

Are you sure to Delete?
Cite
If you have any further questions, please contact Encyclopedia Editorial Office.
Ma, J.; Ma, R.; Pan, Q.; Liang, X.; Wang, J.; Ni, X. Remote Sensing and Monitoring of Marine Pollution. Encyclopedia. Available online: https://encyclopedia.pub/entry/51184 (accessed on 23 June 2024).
Ma J, Ma R, Pan Q, Liang X, Wang J, Ni X. Remote Sensing and Monitoring of Marine Pollution. Encyclopedia. Available at: https://encyclopedia.pub/entry/51184. Accessed June 23, 2024.
Ma, Jingwu, Renfeng Ma, Qi Pan, Xianjun Liang, Jianqing Wang, Xinxin Ni. "Remote Sensing and Monitoring of Marine Pollution" Encyclopedia, https://encyclopedia.pub/entry/51184 (accessed June 23, 2024).
Ma, J., Ma, R., Pan, Q., Liang, X., Wang, J., & Ni, X. (2023, November 06). Remote Sensing and Monitoring of Marine Pollution. In Encyclopedia. https://encyclopedia.pub/entry/51184
Ma, Jingwu, et al. "Remote Sensing and Monitoring of Marine Pollution." Encyclopedia. Web. 06 November, 2023.
Remote Sensing and Monitoring of Marine Pollution
Edit

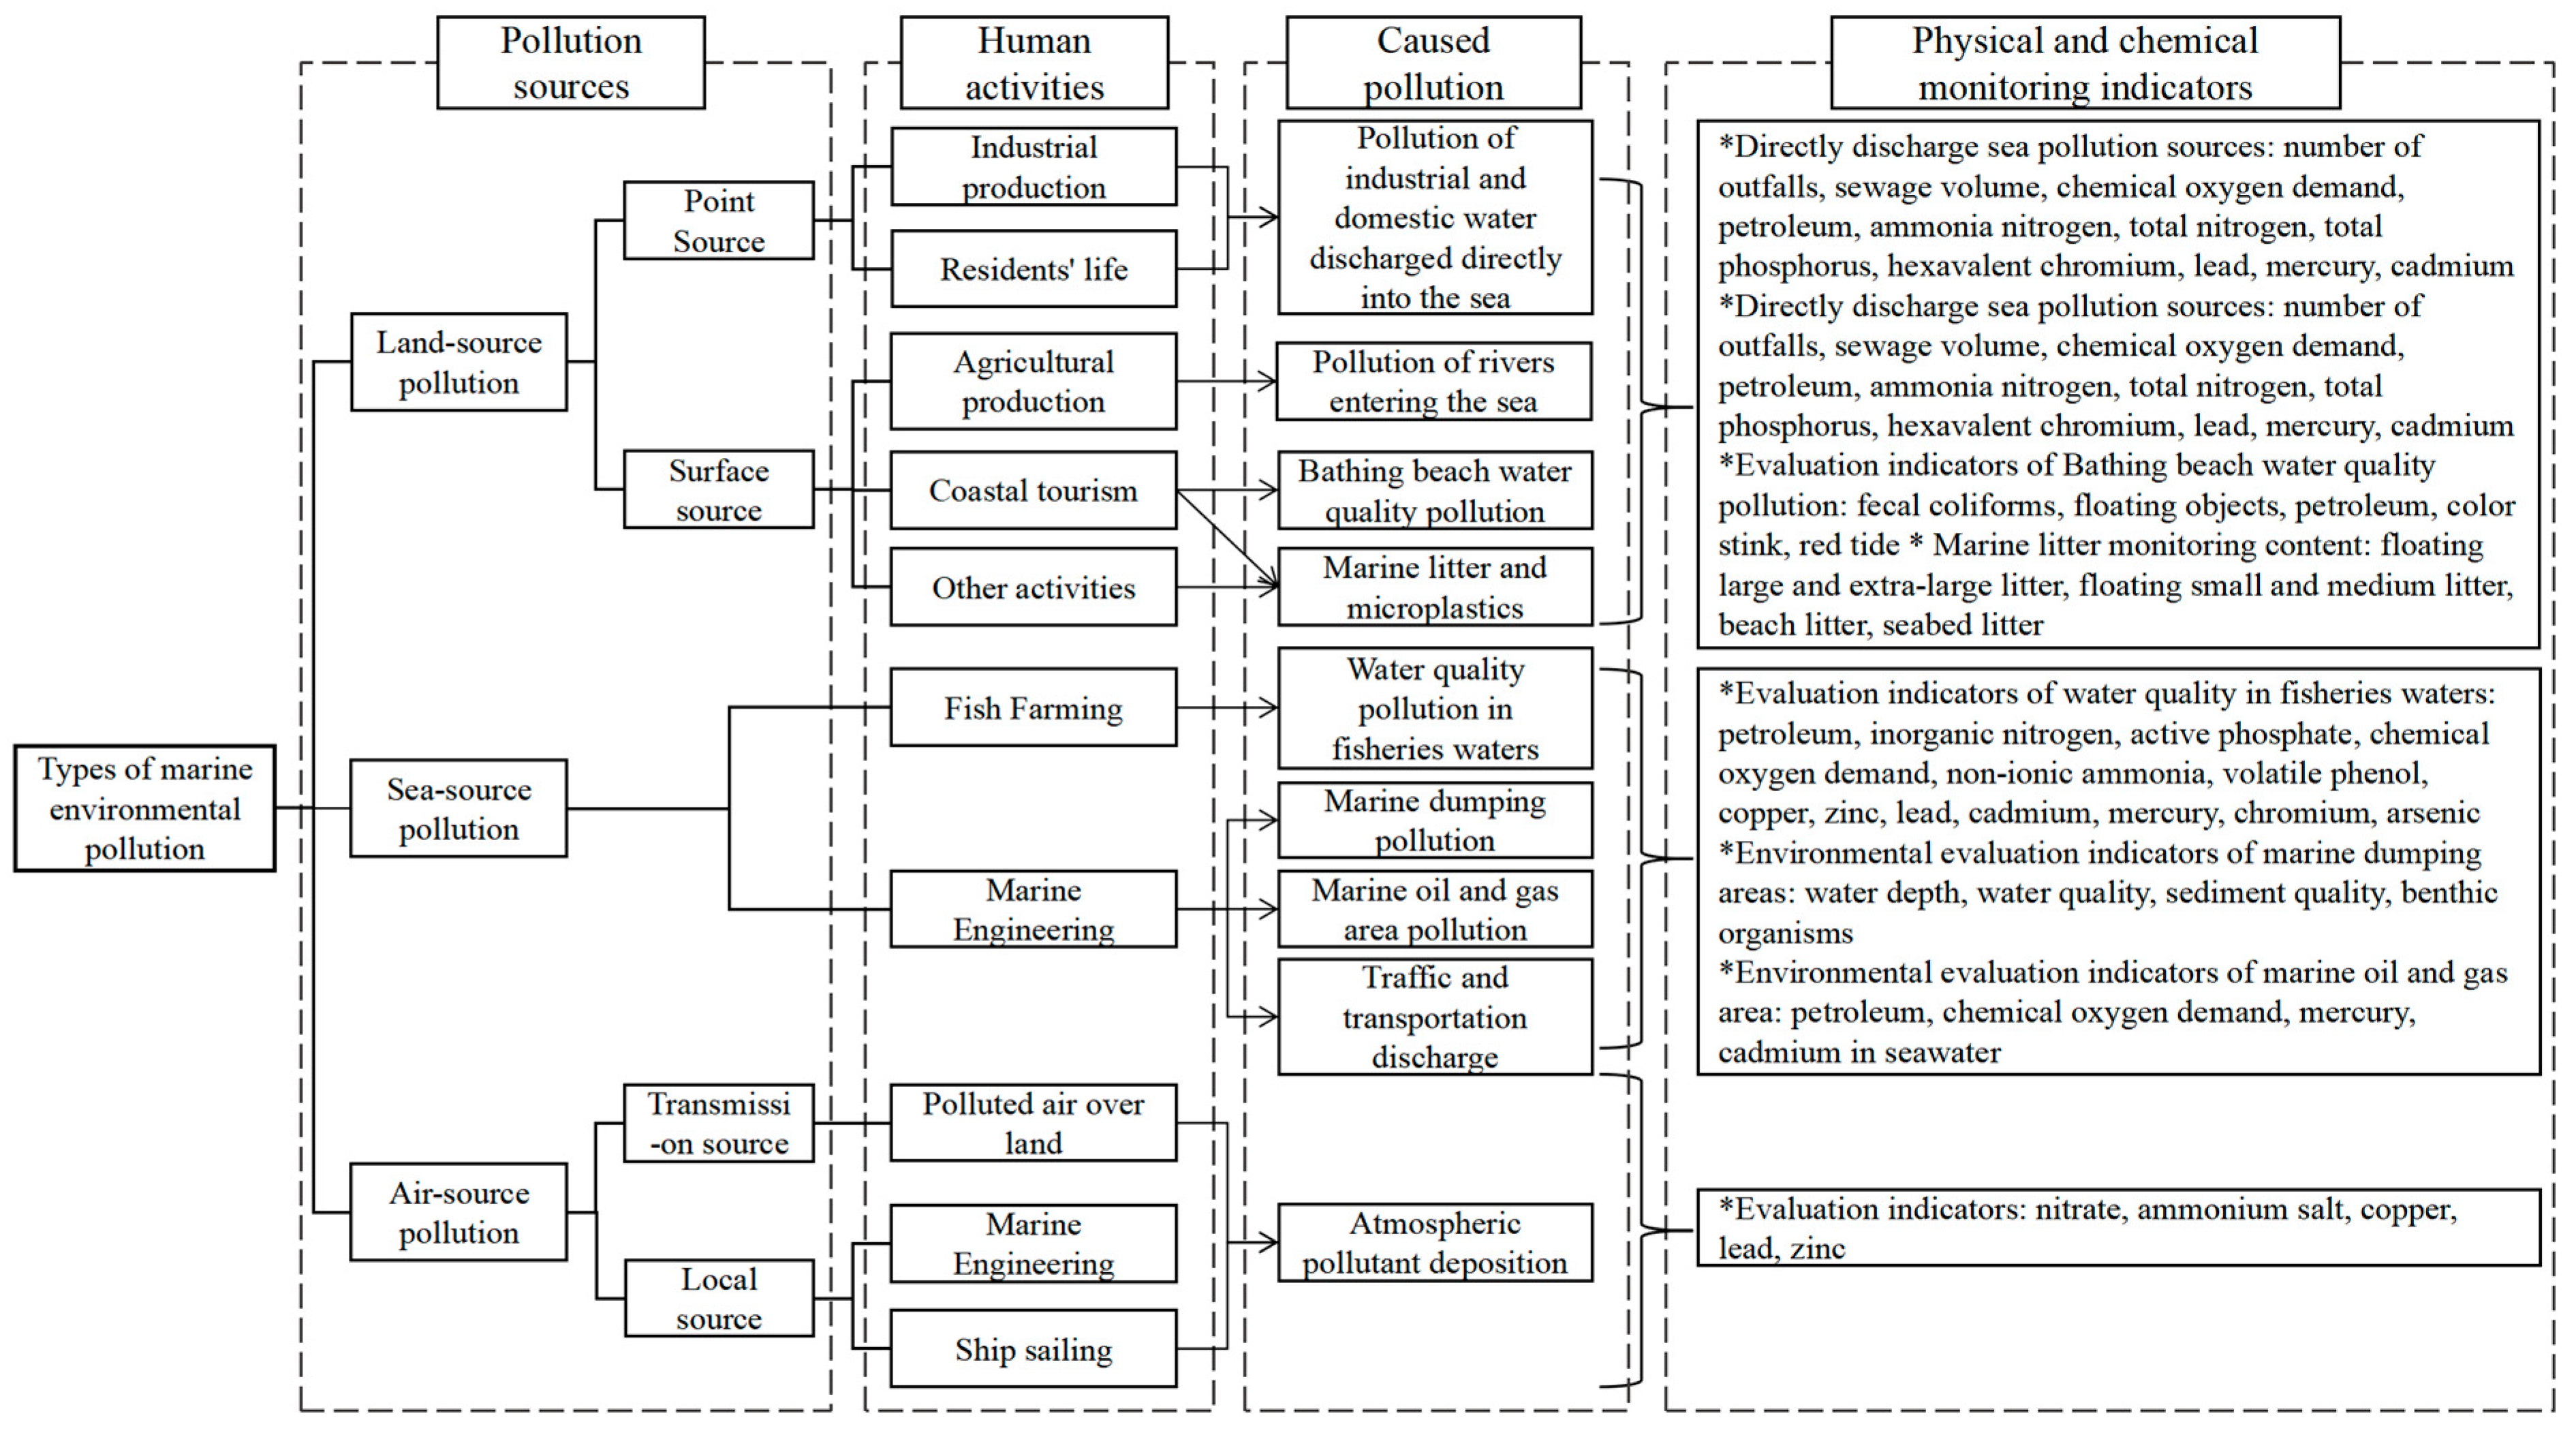
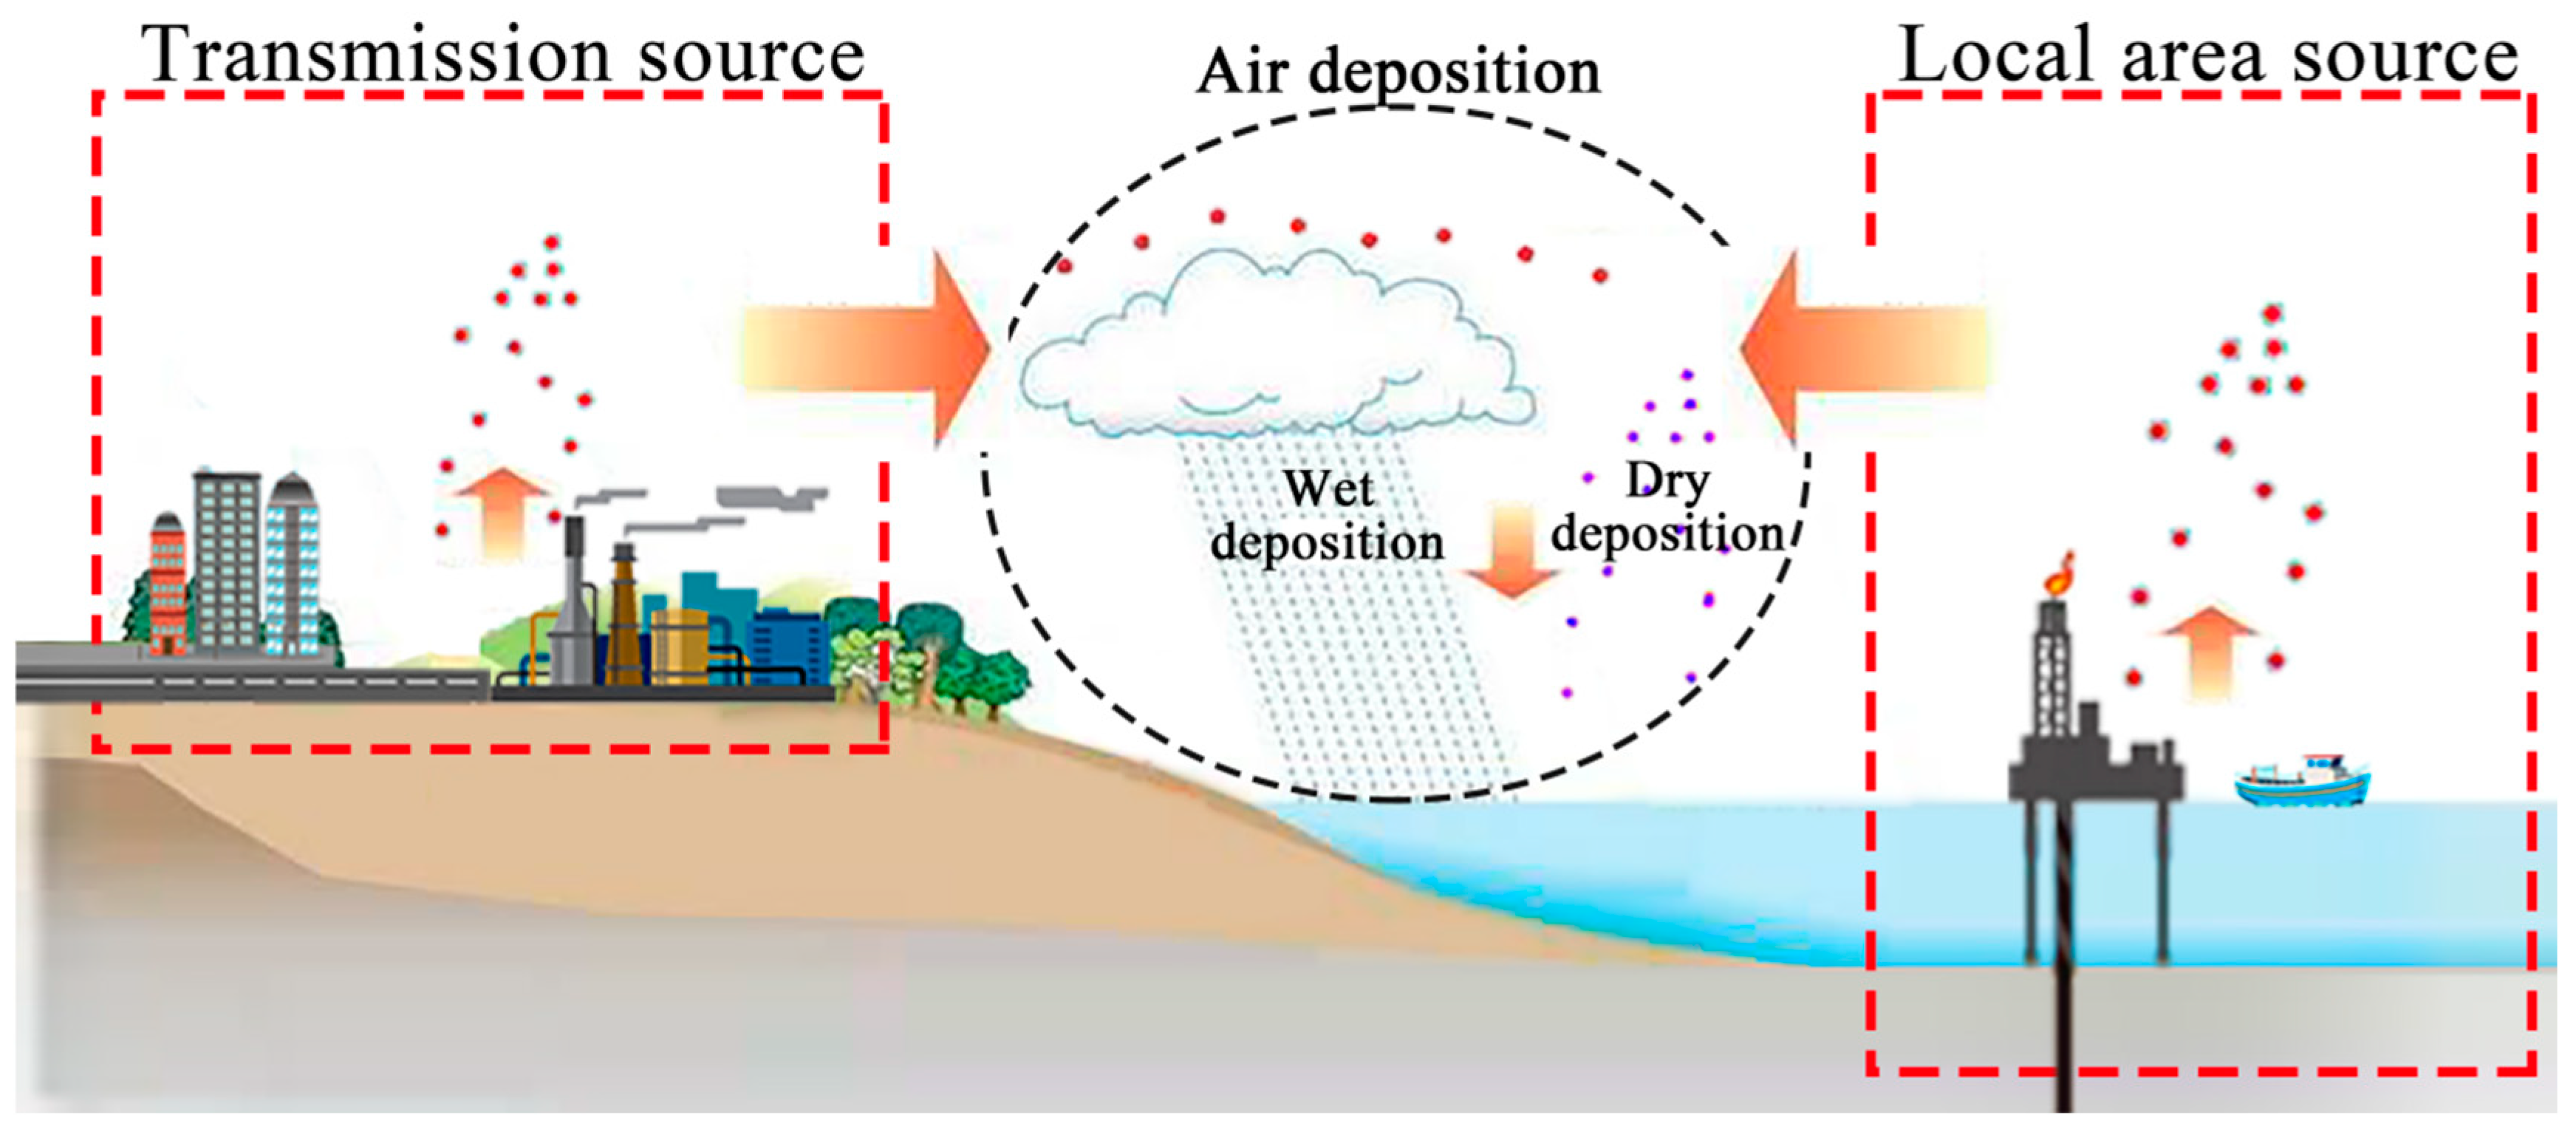
With the rapid development of urbanization and industrialization, human activities have caused marine pollution in three ways: land source, air source, and sea source, leading to the problem of marine environments. Remote sensing, with its wide coverage and fast and accurate monitoring capability, continues to be an important tool for marine environment monitoring and evaluation research.

marine environmental monitoring governance marine pollution coastal zone management

1. Introduction

The ocean is an important environment for humans, and its various types and scales of currents result in the distribution of liquid and three-dimensional resources, which form an important and unique system of marine resources and environment. The ocean is abundant in biological resources, mineral resources, energy, and other resources, and it is attracting increasing attention from the academic circle and industry. The rapid development of industrialization and urbanization has led to a concentration of human activities along coastlines, resulting in the degradation of coastal bays, marine resources, and the environment [1]. Generally, the coastal natural shoreline and coastal mudflat wetlands have been continuously reduced, the area of mangroves and coral reefs has been greatly reduced, and the marine ecological environment has been polluted. The situation is becoming increasingly serious, with increasing eutrophication of seawater and frequent occurrences of marine ecological disasters such as brown tides, green tides, and red tides posing a serious threat to migratory waterfowl and marine biodiversity. Meanwhile, the above environmental pollution, biological extinction, and natural disasters have posed a threat to the sustainable development of the coastal and marine environment. Dissolved organic matter from sewage treatment plants, humus from farmland, anthropogenic shoreline erosion, and the removal of native vegetation can cause significant increases in turbidity in coastal waters [2]. For example, NASA satellite imagery has shown that the water quality of Florida’s Tampa Bay decreases in the winter months compared to the summer. More particles suspended in the water, a measure called turbidity, show up as yellow, orange, and red in December (a) than in July (b) due to seasonal freshwater discharge from nearby rivers and runoff into the bay, which carry nutrients (Figure 1). Hence, marine pollution monitoring is of great significance in terms of both theoretical and practical value [3][4][5]. Marine environment monitoring is an essential step in maintaining the quality of the marine environment and securing its ecology, and it is crucial for achieving sustainable marine development.
Figure 1. Water quality of Florida’s Tampa Bay decreases (Picture source NASA/USF).
Remote sensing plays a crucial role in marine monitoring, including the ecological monitoring of wetland, mangrove, coral reefs, and other key organisms (Figure 2 and Figure 3), the environmental disaster monitoring of oil spills and red tides, the mapping of mesoscale coastlines, the measurement of chlorophyll-a, suspended sediment concentration, seawater temperature in offshore areas, and the automatic recognition of key targets such as dams, breeding areas, buildings, ports, bridges, and ships [6][7][8].
Based on a search of the Web of Science core collection from 2000 by using the keyword “marine remote sensing," it can be seen that marine remote sensing monitoring is a crucial aspect of marine ecological monitoring (Table 1). Remote sensing monitoring has been of interest to scholars from institutions that have published a number of important papers in this field, such as the Woods Hole Oceanographic Institution, the University of Washington, the University of California, San Diego, Oregon State University, the Plymouth Marine Laboratory, the First, Second, and Third Institutes of Oceanography, the Marine Environmental Monitoring Center, the Marine Technology Center, the Tianjin Marine Environmental Monitoring Center Station, the Ocean University of China, and Xiamen University in China. Meanwhile, government agencies around the world, such as NASA, NOAA, CNRS, and the Canadian Department of Fisheries and Oceans, invest heavily in research in this field. Meanwhile, NASA, NOAA, and other institutes have established specific research directions in marine remote sensing technology for marine research and also collaborate with universities, whose research not only focuses on marine pollution monitoring, oil spills, dissolved organic carbon, coral issues, and thermal pollution [9][10][11][12][13], but also large-scale marine currents and air-sea interactions. For example, Chinese relevant institutes have specially established a research department in the field of marine remote sensing. The Second Institute of Oceanography of the Ministry of Natural Resources has taken the lead in conducting research on seawater color remote sensing in China and has achieved fruitful results in the mechanism and algorithm of seawater color remote sensing monitoring, as well as the development of domestically produced software system platforms. Relevant units such as the National Satellite Ocean Response Center and the North China Sea Administration of the Ministry of Natural Resources have all implemented operational monitoring applications for offshore oil spills. Furthermore, the Copernicus program also made a lot of contributions, whose program is the Earth observation component of the European Union’s Space program, which offers information services that draw from satellite Earth observation and in-situ (non-space) data. Amounts of global data from satellites and ground-based, airborne, and seaborne measurement systems provide information to help service providers, public authorities, and other international organizations improve European citizens’ quality of life and beyond. And organizations such as USEPA and US IOOS are monitoring exhaust from ships. University of Delaware professors have used remote sensing technology to monitor exhaust from ships.
Table 1. The top 10 related institutes of marine remote sensing monitoring and their research directions.
Figure 2. The polyedra algal bloom and oil spill of remote sensing images. (a) Landsat-8 RGB (bands 4-3-2) composite in this research region on 16 July 2019; (b) chl-a concentration (mg/m3) after atmospheric correction with ACOLITE for the same scene [15]. (A) MODIS; (B) MERIS showing the site of the DWH oil spill in blue arrow [16].
Figure 3. The LiDAR and MSI remote sensing images (a) show the spatial distribution of Chl-a (conc_chl) C2RCC in the Kneiss Archipelago, Gulf of Gabes, Tunisia [17]. (b) the floating plastic litter from space using Sentinel-2 imagery [18].

2. Sources and Monitoring Indices of Marine Pollution

The overexploitation of marine resources results in the degradation of the marine ecosystem and causes pollution, which damages the marine environment. The overexploitation, including major river conservation projects, land reclamation projects, coastal mining, offshore drilling, and mariculture, also leads to a shortage of marine resources and has negative impacts on coastal marine resources and environments. The utilization of marine resources varies in different regions due to differences in distribution, resulting in different types of pollution, such as land source, sea source and air source (Figure 4).
Figure 4. Source and monitoring index of marine pollution. Note: monitoring indices and methods from the Bulletin of China’s Marine Ecological Environment in 2020.
Land-source pollution has the widest distribution and largest quantity, accounting for 80% of the total marine pollution and having the most serious effect. Land-source pollution can be divided into two types: point-source and area-source. Point-source pollution is primarily composed of industrial waste water and domestic sewage that is collected and treated through sewage networks and discharged into the sea through designated discharge points [19][20]. Area-source pollution comes from agricultural runoff and livestock breeding activities, which flow into the ocean through runoff [20]. The root cause of land source pollution is human economic and social activity, which contributes to the negative impacts of such activities on the marine environment [21]. This type of pollution is not limited to coastal areas but is influenced by economic and social activities and is more pronounced in offshore regions with intensive secondary industries and rapid economic development [22]. Additionally, human activities on land can cause eutrophication and biotoxicity in sea areas through river dams and water storage projects and reduce river sediment discharge, leading to coastal erosion and changes in river water and groundwater quality [23][24]. Coastal tourism, being a popular form of tourism, also contributes to marine pollution through the construction of tourist resorts, docks, and breakwaters, which fragment coastal habitats and harm biodiversity, and through the pollution of seawater quality and the flow of beach litter into the ocean from bathing beaches [25]. The water quality of direct discharge into the sea is the main evaluation index for monitoring point-source land source pollution, while the water quality of seaport rivers, beach water, marine debris, and microplastics is the main evaluation index for monitoring area-source land source pollution. Water quality is primarily evaluated according to the “Standard for Seawater Quality” (GB 3097-1997) [26], the “Standard for Surface Water Environmental Quality” (GB 3838-2002) [27] for rivers flowing into the ocean, and the “Guide for Monitoring and Evaluation of Bathing Beaches” (HY/T 0276-2019) for bathing beaches.
Sea-source pollution mainly refers to the pollution caused by human utilization of the sea. Marine pollution offshore is primarily caused by fishing and aquaculture practices. Overfishing has resulted in a reduction of fish resources, leading to the implementation of non-standard practices such as beach aquaculture, offshore cage aquaculture, and pelagic fishing, which negatively impact the marine environment by releasing nutrients and drugs into the water [28]. This can also pose a threat to coastal biodiversity, affecting beaches and mangroves [29]. Another significant source of marine pollution is marine engineering activities, such as oil and gas field exploitation, which can result in oil spills, sewage discharge, and seepage from eroded oil-bearing rocks. Additionally, the unregulated discharge of waste water from cruise ships and cargo ships in coastal tourism contributes to marine pollution [30]. Monitoring marine pollution includes monitoring the water quality of fishery waters and the discharge of waste water from marine engineering activities. The quality of fishery waters is evaluated according to the “Fishery Water Quality Standard” (GB 11607-1989) [31], while monitoring of marine engineering pollution in dumping areas and oil and gas fields should be based on the “Technical Regulations for Monitoring of Marine Dumping Areas” and “Technical Guidelines for Environmental Impact Assessment of Marine Engineering” (GB/T 17108-2006) [32].
Air-source pollution can be divided into transmission sources and local sources (Figure 5). Transmission sources refer to the pollution in the air that is transported from the land to the sea due to the influence of monsoons. Local sources refer to the pollutants that are emitted directly into the sea, such as oil and gas field exploitation, marine transportation, and fishing. The pollutants include SO2, NOx, CO, particulate matter, and VOCs. Atmospheric pollutants fall onto the marine surface through dry deposition and wet deposition processes [33]. Dry deposition involves the physical, chemical, and biological processes by which atmospheric pollutants fall onto the marine surface, while wet deposition involves ionic pollutants and soluble pollutants from the air falling onto the marine surface through precipitation or water vapor condensation [34]. The evaluation of marine atmospheric pollution deposition is mainly conducted based on the “Technical Regulations for the Assessment of the Flux of Atmospheric Pollutants Deposition into the Sea (Trial)” and includes the observation of the elements nitrate, NH4Cl, Cu, Pb, and Zn.
Figure 5. Mechanisms of marine atmospheric pollution transfer.

3. The Utilization of Remote Sensing Monitoring in Marine Pollution

3.1. An Overview of the Development History and Present Situation

In 1960, the United States launched the world’s first meteorological satellite, TIROS-1, and used it to collect data on the marine surface temperature field from an altitude of approximately 700 km [35]. In 1978, the United States took the lead in the field of marine observation with the launch of Seasat-1, the first satellite dedicated to observing coastal seawater color [36], which marked the beginning of marine remote sensing monitoring. As the importance of marine resources continues to be recognized, more and more countries are investing in marine remote sensing technology to support monitoring efforts in the fields of shipping, environment, military, and economics [36][37][38].
The sensors commonly used in marine research include seawater color sensors, infrared sensors, microwave altimeters, microwave scatterometers, synthetic aperture radars, and microwave radiometers. These sensors are capable of monitoring elements from the marine surface to the upper, lower, and bottom topography and can be used to monitor the seawater color and environment, as well as the marine dynamic environment (such as the marine surface wind field, marine surface height, effective wave height, and surface temperature) [39][40][41]. The sensors play a crucial role in monitoring islands, coastal zones, and other targets, including the marine wave field, storm surge floodplain, internal waves, sea ice, and oil spills. With the progress in microwave, infrared, and hyperspectral remote sensing technologies and their wider applications in the water, ecological, and air environments, the types of sensors available have become more diverse and specialized, and the spectral bands more refined. For example, China has launched a series of marine satellites, including HY-1C/D and HY-2B/C/D, equipped with new ultraviolet imagers, onboard calibration spectrometers, automatic ship identification systems (Figure 6), and other loads, providing a wealth of data for monitoring the global seawater color and dynamics [42]. The spectral bands of remote sensing images are getting finer and finer, forming multispectral, hyperspectral, and ultraspectral. At present, the spectral resolution in the 100 nm order is called multispectral, such as a remote sensor in the visible light and near-infrared spectral region only a few bands, such as the United States LandsatMSS, TM, SPOT in France, etc. The spectral resolution is in the 10 nm order, which is called HyPerspectral remote sensing. With the further improvement of the spectral resolution of remote sensing, remote sensing enters the ultraspectral stage when the spectral resolution reaches 1 nm. Hyperspectral and ultraspectral remote sensing are the frontier fields of remote sensing technology. It uses many very narrow electromagnetic wave bands to obtain relevant data from objects of interest so that substances that are not detectable in wide-band remote sensing can be detected. Chuanpeng Zhao et al. [43] proposed a new approach with solid improvements in dual-temporal image construction, misclassification processing, and tacit knowledge analysis, generated an accurate coastal salt marsh map at a national scale, and provided a classification mechanism for dual-temporal image-based coastal salt marsh identification and mapping. Remote sensing technology has huge advantages in obtaining real-time, large-scale, wide-area, and multi-period comparisons of basic coastal zone data. However, due to the indirect reflection of the characteristics of each observation object through the radiation and reflection characteristics of electromagnetic waves, the resolution is lower than that of conventional ground or ship observation methods. In addition, the presence of the phenomenon of homologous objects with different spectra and foreign objects with the same spectrum makes it difficult to recognize and interpret images.
Figure 6. Image observed by PALSAR-2, synthetic aperture radar onboard ALOS-2, at 10:23 (UTC) on March 26 (a) around the Suez Canal; (b) extended image around the stranded ship (Picture source: Earth Observation Research Center).

3.2. The Monitoring Data and Methods

Marine remote sensing has the unique advantages of all-weather, wide-range, and long-term observation and is widely used in marine ecology and resources monitoring, marine disaster monitoring, marine rights and interests maintenance, marine environmental prediction and security assurance, and other fields. Therefore, marine pollution can be monitored and reversed based on marine remote sensing data. Marine pollution monitoring can be classified into three aspects: seawater quality, marine debris and microplastic pollution, and atmospheric deposition pollution. According to the application focus of remote sensing, the remote sensing data products and research methods for monitoring the pollution of these marine areas are analyzed.

References

  1. Sankar, T.K.; Kumar, A.; Mahto, D.K.; Das, K.C.; Narayan, P.; Fukate, M.; Awachat, P.; Padghan, D.; Mohammad, F.; Al-Lohedan, H.A.; et al. The Health Risk and Source Assessment of Polycyclic Aromatic Hydrocarbons (PAHs) in the Soil of Industrial Cities in India. Toxics 2023, 11, 515.
  2. Meshram, S.G.; Kahya, E.; Meshram, C.; Ghorbani, M.A.; Ambade, B.; Mirabbasi, R. Long-term temperature trend analysis associated with agriculture crops. Theor. Appl. Clim. 2020, 140, 1139–1159.
  3. Henrique, M.P.; Paul, W.L.; Vânia, P.; Rob, A.; Jörn, P.W.S.; Juan, J.F.M.; Araújo, M.B.; Patricia, B.; Reinette, B.; William, W.L.C.; et al. Scenarios for global biodiversity in the 21st century. Science 2010, 330, 1496–1501.
  4. Ma, R.F.; Dou, S.M.; Gong, H.B. China’s East China Sea Sustainable Development Study: A Volume on Cross-Regional Governance of Coastal Zone Ecology and Environment; Ocean Press: Beijing, China, 2019.
  5. Sala, E.; Knowlton, N. Global Marine Biodiversity Trends. Annu. Rev. Environ. Resour. 2006, 31, 93–122.
  6. Lin, M.S.; Zhang, Y.G.; Yuan, X.Z. The development course and trend of ocean remote sensing satellite. Acta Oceanol. Sin. 2015, 37, 1–10.
  7. Sun, F.Z. Remote Sensing Assessment of Coastal Zones; Science Press: Beijing, China, 2015.
  8. Zou, B.; Lin, M.S.; Shi, L.J.; Zou, Y.R.; Jia, Y.J.; Zeng, T. Application of Remote Sensing Technology in Ocean Disaster. City Disaster Reduct. 2018, 123, 61–65.
  9. Eck, T.F.; Holben, B.N.; Kim, J.; Beyersdorf, A.J.; Choi, M.; Lee, S.; Koo, J.-H.; Giles, D.M.; Schafer, J.S.; Sinyuk, A.; et al. Influence of cloud, fog, and high relative humidity during pollution transport events in South Korea: Aerosol properties and PM2.5 variability. Atmos. Environ. 2020, 232, 117530.
  10. Fichot, C.G.; Tzortziou, M.; Mannino, A. Remote sensing of dissolved organic carbon (DOC) stocks, fluxes and transformations along the land-ocean aquatic continuum: Advances, challenges, and opportunities. Earth-Sci. Rev. 2023, 242, 104446.
  11. Leifer, I.; Lehr, W.J.; Simecek-Beatty, D.; Bradley, E.; Clark, R.; Dennison, P.; Hu, Y.; Matheson, S.; Jones, C.E.; Holt, B.; et al. State of the art satellite and airborne marine oil spill remote sensing: Application to the BP Deepwater Horizon oil spill. Remote Sens. Environ. 2012, 124, 185–209.
  12. Mace, T.H. At-sea detection of marine debris: Overview of technologies, processes, issues, and options. Mar. Pollut. Bull. 2012, 65, 23–27.
  13. Moreno-Madriñán, M.J.; Rickman, D.L.; Ogashawara, I.; Irwin, D.E.; Ye, J.; Al-Hamdan, M.Z. Using remote sensing to monitor the influence of river discharge on watershed outlets and adjacent coral Reefs: Magdalena River and Rosario Is-lands, Colombia. Int. J. Appl. Earth Obs. Geoinf. 2015, 38, 204–215.
  14. Nellemann, C.; Hain, S.; Alde, R.J. Dead Water: Merging of Climate Change with Pollution, Over-Harvest, and Infestations in the World’s Fishing Grounds; United Nations Environment Programme: Arendal, Norway, 2008.
  15. Caballero, I.; Fernández, R.; Escalante, O.M.; Mamán, L.; Navarro, G. New capabilities of Sentinel-2A/B satellites com-bined with in situ data for monitoring small harmful algal blooms in complex coastal waters. Sci. Rep. 2020, 10, 8743.
  16. Shamsudeen, T.Y. Advances in remote sensing technology, machine learning and deep learning for marine oil spill de-tection, prediction and vulnerability assessment. Remote Sens. 2020, 12, 3416.
  17. Katlane, R.; Dupouy, C.; El Kilani, B.; Berges, J.C. Estimation of Chlorophyll and Turbidity Using Sentinel 2A and EO1 Data in Kneiss Archipelago Gulf of Gabes, Tunisia. Int. J. Geosci. 2020, 11, 708–728.
  18. Themistocleous, K.; Papoutsa, C.; Michaelides, S.; Hadjimitsis, D. Investigating Detection of Floating Plastic Litter from Space Using Sentinel-2 Imagery. Remote Sens. 2020, 12, 2648.
  19. Ambade, B.; Sethi, S.S.; Chintalacheruvu, M.R. Distribution, risk assessment, and source apportionment of polycyclic aromatic hydrocarbons (PAHs) using positive matrix factorization (PMF) in urban soils of East India. Environ. Geochem. Health 2022, 45, 491–505.
  20. Liu, H.L.; Nie, H.T.; Wang, Y.L.; Sun, X.; Wei, H. Estimation method of pollutant load into sea using statistical data—Tianjin city. Mar. Environ. Sci. 2019, 38, 968–976.
  21. Kurwadkar, S.; Sankar, T.K.; Kumar, A.; Ambade, B.; Gautam, S.; Gautam, A.S.; Biswas, J.K.; Salam, M.A. Emissions of black carbon and polycyclic aromatic hydrocarbons: Potential implications of cultural practices during the Covid-19 pandemic. Gondwana Res. 2023, 114, 4–14.
  22. Ge, H.Q.; Lan, N. Causes and Prevention Mode on Marine Pollution from the Land-based Activities or Sources (MPLBA) in China. China Soft Sci. 2014, 2, 22–31.
  23. Ma, X.D.; Mu, J.L.; Lin, Z.S.; Wang, L.J.; Yu, L.M.; Wang, Y.; Zhang, Z.; Zhang, Z.F. The Impact of Sewage from Typical Land-based Sources on the Adjacent Marine Eutrophication and Biological Toxicity. Environ. Monitor. China 2014, 30, 25–30.
  24. Xu, L.H.; Li, J.L.; Li, W.F.; Zhao, S.; Yuan, Q.X.; Wang, M.Y.; Yang, L.; Lu, X.S. Progress in Impact of Human Activities on Coastal Resource and Environment. J. Nanjing Univ. Nat. Sci. Ed. 2014, 37, 124–131.
  25. Davenport, J.; Davenport, J.L. The impact of tourism and personal leisure transport on coastal environments: A review. Estuar. Coast. Shelf Sci. 2006, 67, 280–292.
  26. GB 3097-1997; Marine Water Quality Standard. State Environmental Protection Administration: Beijing, China, 1997.
  27. GB 3838-2002; Environmental Quality Standards for Surface Water. State Environmental Protection Administration (SEPA): Beijing, China; General Administration of Quality Supervision, Inspection and Quarantine (AQSIQ) of the People’s Republic of China: Beijing, China, 2002.
  28. Chen, Y.B.; Song, G.B.; Zhao, W.X.; Chen, J.W. Estimating pollutant loadings from mariculture in China. Mar. Environ. Sci. 2016, 35, 1–6.
  29. Liu, J.L.; Chen, X.J. Research Progress and Hotspots of Marine Biodiversity: Based on Bibliometrics and Knowledge Mapping Analysis. Prog. Fish. Sci. 2021, 42, 201–213.
  30. Wang, C.Y.; He, S.J.; Li, Y.T.; Hou, X.Y.; Yang, C.Y. Study on the state and ecological effect of spilled oil pollution in Chinese Coastal Waters. Mar. Sci. 2009, 33, 57–60.
  31. GB 11607-1989; Water Quality Standard for Fisheries. State Environmental Protection Administration: Beijing, China, 1989.
  32. GB/T 17108-2006; Technical Directives for the Division of Marine Functional Zonation. General Administration of Quality Supervision, Inspection and Quarantine (AQSIQ): Beijing, China; Standardization Administration of the People’s Republic of China (SAC): Beijing, China, 2006.
  33. Kumar, A.; Ambade, B.; Sankar, T.K.; Sethi, S.S.; Kurwadkar, S. Source identification and health risk assessment of atmospheric PM2.5-bound polycyclic aromatic hydrocarbons in Jamshedpur, India. Sustain. Cities Soc. 2019, 52, 101801.
  34. Ambade, B.; Kumar, A.; Latif, M. Emission sources, Characteristics and risk assessment of particulate bound Polycyclic Aromatic Hydrocarbons (PAHs) from traffic sites. 2021; preprint.
  35. Lin, M.S.; He, X.Q.; Jia, Y.J.; Bai, Y.; Ye, X.M.; Gong, F. Advances in marine satellite remote sensing technology in China. Acta Oceanol. Sin. 2019, 41, 99–112.
  36. Wang, W.J.; Jia, D.N.; Xu, J.L.; Chu, H.K.; Dong, X.R. Review of the development of global marine remote sensing satellite. Bull. Surv. Mapp. 2020, 5, 1–6.
  37. Baig, M.H.A.; Zhang, L.; Shuai, T.; Tong, Q. Derivation of a tasselled cap transformation based on Landsat 8 at-satellite reflectance. Remote Sens. Lett. 2014, 5, 423–431.
  38. Blix, K.; Pálffy, K.; Tóth, V.R.; Eltoft, T. Remote sensing of water quality parameters over Lake Balaton by using sentinel-3 OLCI. Water 2018, 10, 1428.
  39. Atlas, R.; Hoffman, R.N.; Ardizzone, J.; Leidner, S.M.; Jusem, J.C.; Smith, D.K.; Gombos, D. A cross-calibrated multi-plat-form ocean surface wind velocity product for meteorological oceanographic applications. Bull. Am. Meteorol. Soc. 2011, 92, 157–174.
  40. Su, H.; Li, W.; Yan, X. Retrieving temperature anomaly in the global subsurface deeper ocean from satellite observations. J. Geophys. Res. Ocean. 2018, 123, 399–410.
  41. Sun, W.W.; Yang, G.; Chen, C.; Chang, M.H.; Huang, K.; Meng, X.Z.; Liu, L.Y. Development status literature analysis of China’s earth observation remote sensing satellites. J. Remote Sens. 2020, 24, 479–510.
  42. Jiang, X.W.; Lin, M.S.; Liu, J.Q.; Zhang, Y.Q.; Xie, X.T.; Peng, H.L.; Zhou, W. The HY-2 satellite its preliminary assessment. Int. J. Digit. Earth 2012, 5, 266–281.
  43. Zhao, C.; Jia, M.; Wang, Z.; Mao, D.; Wang, Y. Toward a better understanding of coastal salt marsh mapping: A case from China using dual-temporal images. Remote Sens. Environ. 2023, 295, 113664.
More
Information
Subjects: Oceanography
Contributors MDPI registered users' name will be linked to their SciProfiles pages. To register with us, please refer to https://encyclopedia.pub/register : , , , , ,
View Times: 240
Revisions: 2 times (View History)
Update Date: 07 Nov 2023
1000/1000
Video Production Service