Your browser does not fully support modern features. Please upgrade for a smoother experience.
Submitted Successfully!
 +1 credit
Thank you for your contribution! You can also upload a video entry or images related to this topic.
For video creation, please contact our Academic Video Service.
| Version | Summary | Created by | Modification | Content Size | Created at | Operation |
|---|---|---|---|---|---|---|
| 1 | Ligang Zhang | -- | 1331 | 2023-11-03 02:35:14 | | | |
| 2 | Catherine Yang | + 1 word(s) | 1332 | 2023-11-03 04:04:11 | | |
Video Upload Options
We provide professional Academic Video Service to translate complex research into visually appealing presentations. Would you like to try it?
Cite
If you have any further questions, please contact Encyclopedia Editorial Office.
Song, Q.; Li, C.; Deng, Z.; Zhang, L.; Liu, L. Ternary Al–Ni–Er System. Encyclopedia. Available online: https://encyclopedia.pub/entry/51120 (accessed on 21 June 2026).
Song Q, Li C, Deng Z, Zhang L, Liu L. Ternary Al–Ni–Er System. Encyclopedia. Available at: https://encyclopedia.pub/entry/51120. Accessed June 21, 2026.
Song, Qian, Chenbo Li, Zixuan Deng, Ligang Zhang, Libin Liu. "Ternary Al–Ni–Er System" Encyclopedia, https://encyclopedia.pub/entry/51120 (accessed June 21, 2026).
Song, Q., Li, C., Deng, Z., Zhang, L., & Liu, L. (2023, November 03). Ternary Al–Ni–Er System. In Encyclopedia. https://encyclopedia.pub/entry/51120
Song, Qian, et al. "Ternary Al–Ni–Er System." Encyclopedia. Web. 03 November, 2023.
Copy Citation
Al–Ni–Er is an essential system in heat-resistant Al alloys. The aluminum-rich corner of this system, which has the most practical application significance. The phase equilibria of the Al–Ni–Er system are investigated via experiments and thermodynamic modeling. The isothermal sections of the Al-rich corner of this ternary system at 600 and 700 °C were determined through equilibrated alloys combined with scanning electron microscopy (SEM), electron probe microanalysis (EPMA) and X-ray diffractometry (XRD).
Al–Ni–Er system
equilibrated alloys
isothermal sections
1. Introduction
Aluminum alloys have a history of nearly a century, but they have developed rapidly. The addition of nickel in aluminum alloys offers higher tensile strength and hardness, greatly improves corrosion resistance [1], and has high specific strength that could effectively reduce the weight of products, lower fuel consumption, and save energy in industrial production [2][3]. It can also promote a reduction in carbon emissions and help in achieving carbon neutrality [4]. The amorphous aluminum alloy has better properties than those of ordinary aluminum alloys. The glass-forming ability (GFA) of Al alloys could be promoted with the addition of rare earth metals (REs) [5][6][7]. Through a comprehensive consideration of cost and performance, the researchers chose the Al–Ni–Er system as the research object.
Phase diagrams and thermodynamics are powerful tools applied to material design [8][9][10][11]. CALPHAD is a more efficient method than experimental research because an experiment cannot cover all points in a 3D phase diagram model, and CALPHAD can obtain comprehensive information that can guide the experiment. Al–Ni–Er is an essential system in heat-resistant Al alloys. Studying its thermodynamics can not only guide the design of Al–Ni–Er alloys, but also supplement the database of Al-based alloys.
2. Binary Al–Ni System
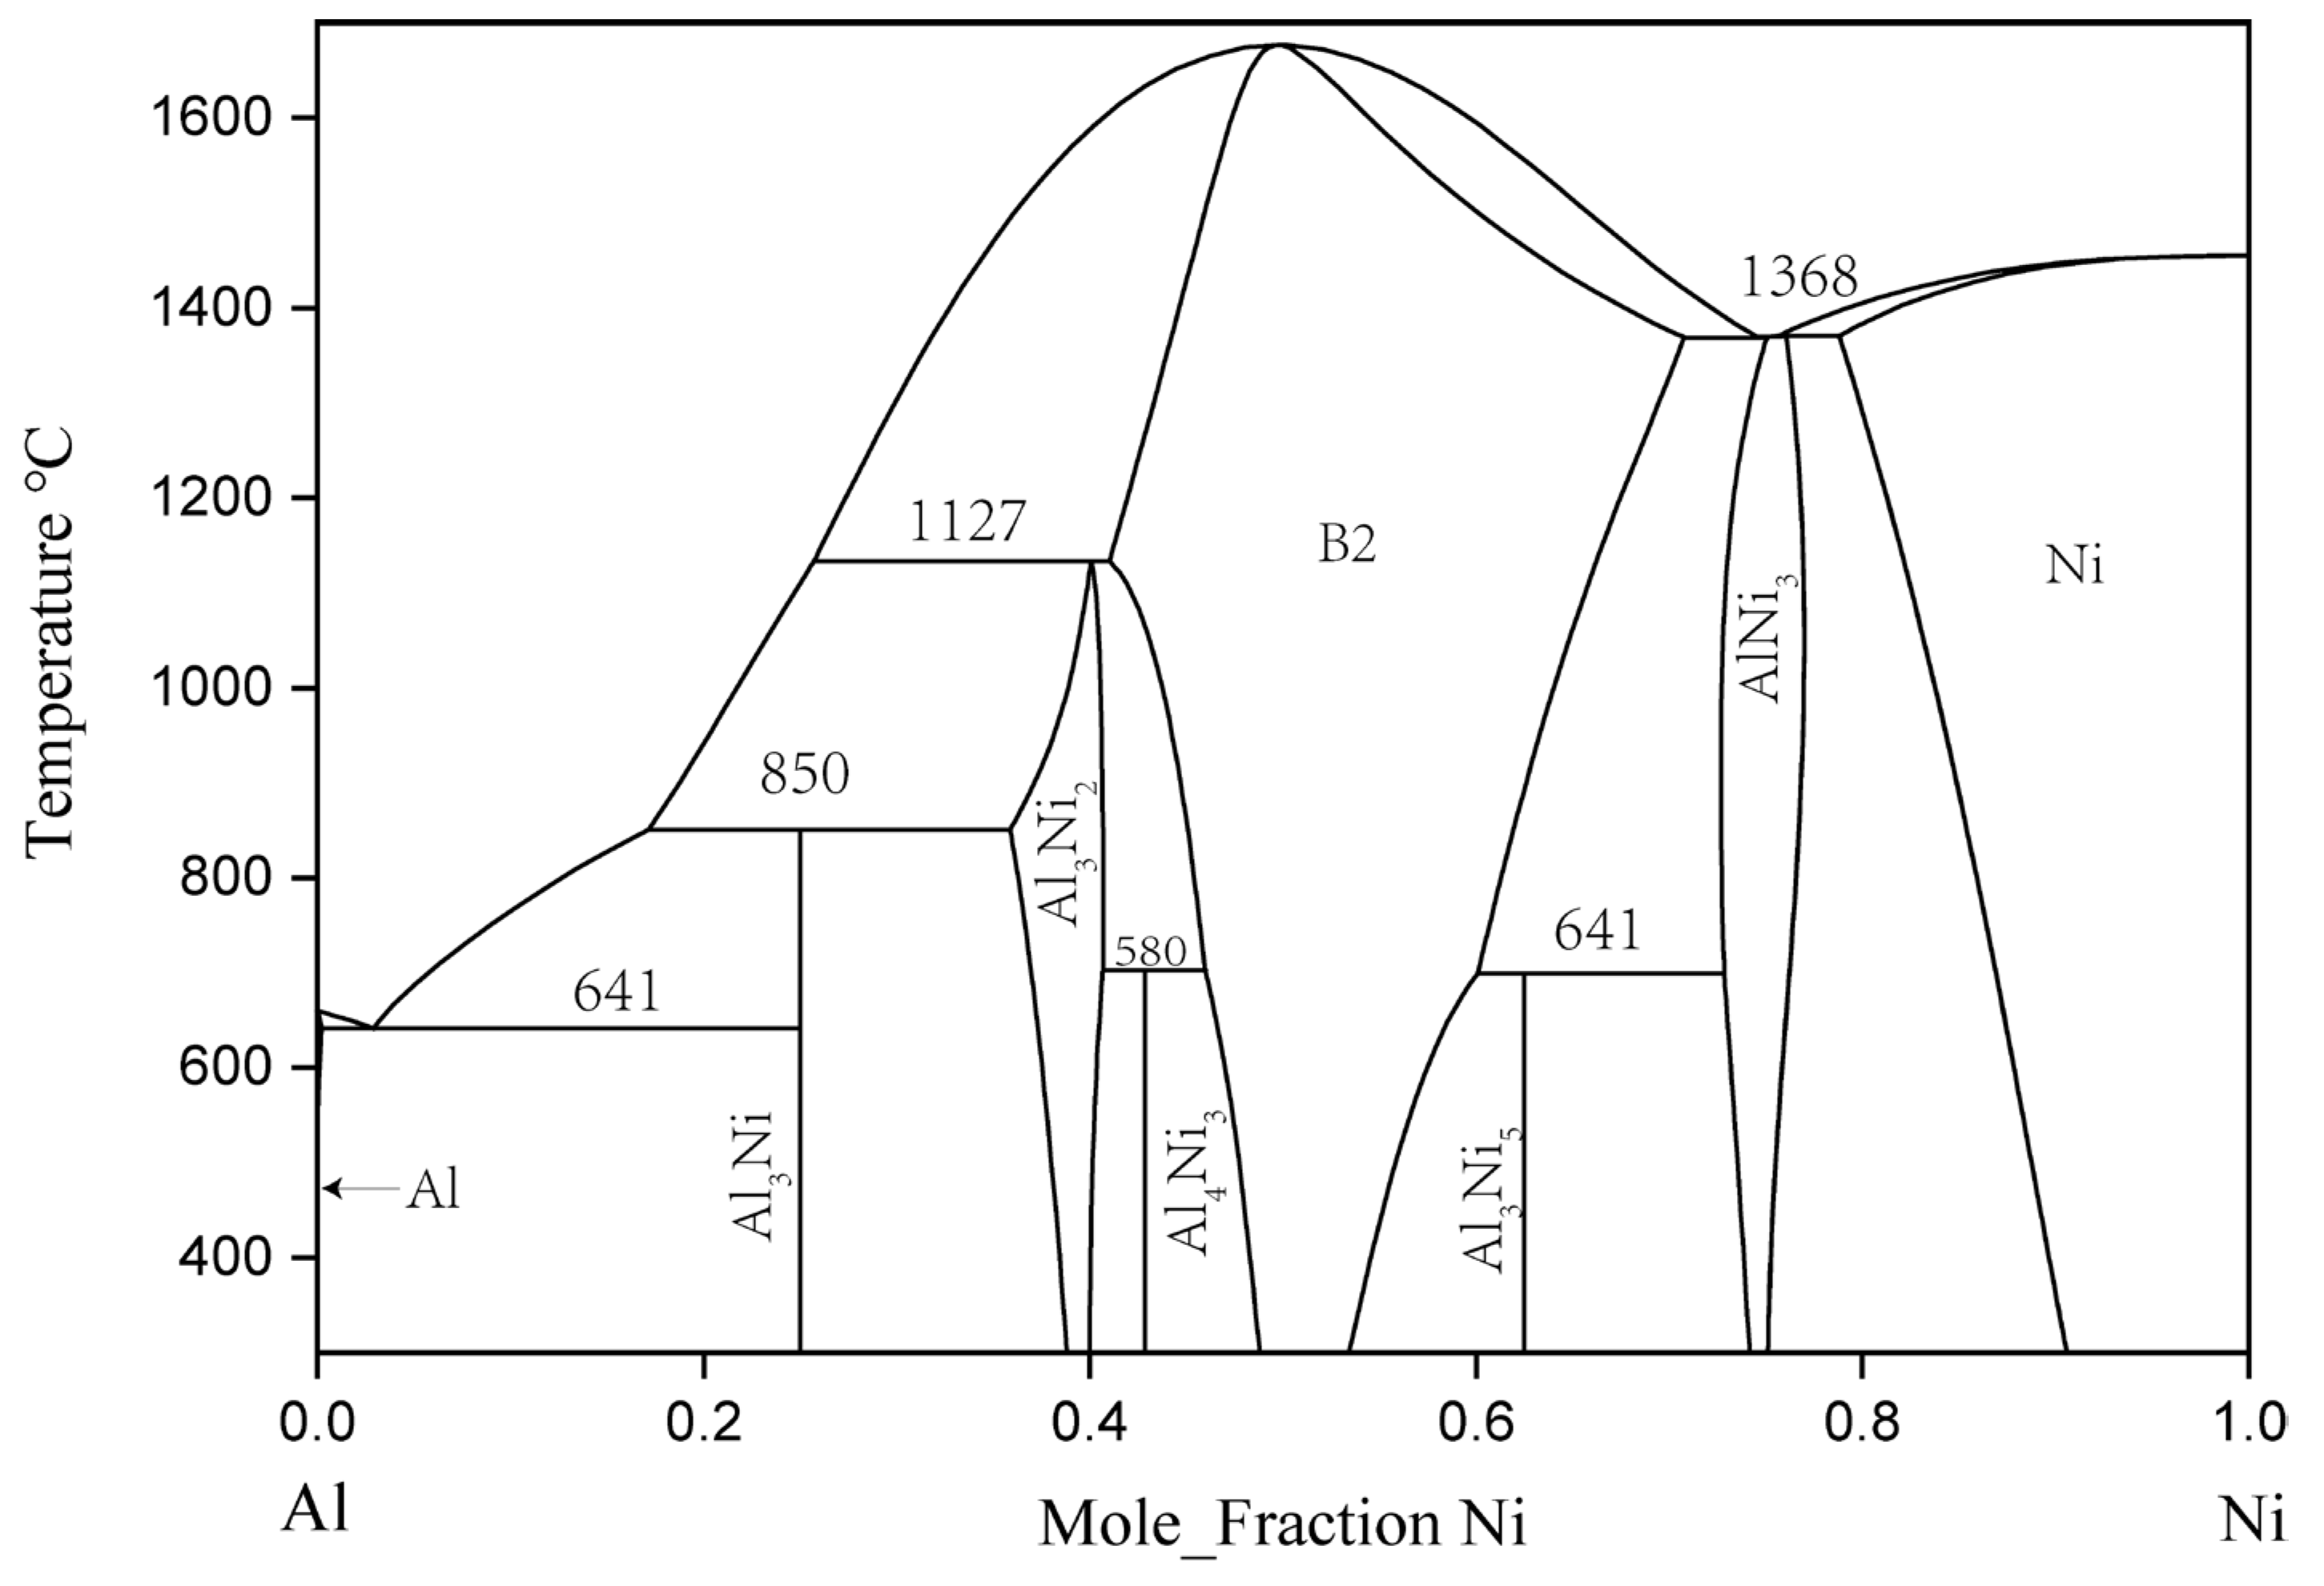
In 1993, Okamoto [12] revised Nash’s [13] evaluation of the binary Al–Ni system, and rereported the experimental phase diagram of the system. The binary Al–Ni phase diagram evaluated by Okamoto is the generally accepted version. In the binary Al–Ni system, there are two terminal solid solutions with an FCC structure, the three intermetallic compounds of NiAl3, Ni2Al3, and Ni5Al3, and an NiAl phase with a B2-ordered structure and an Ni3Al phase with an L12-ordered structure. AlNi, Al3Ni2, and AlNi3 had a certain range of solid solubility at 600 and 700 °C [14].
Since Gwyer [15] initiated his work, many experiments have been carried out to determine the phase equilibrium and thermodynamic quantities of the Al–Ni system. Kaufman, and Nesor and Ansara et al. [16] produced a thermodynamic model of the whole system through phase diagram calculation. Then, Du [17], Ansara [16], Huang [18], Dupin [19], Lu [20], and Chen [21] used different models to optimize this system. The calculated phase diagram and thermodynamic description of Al–Ni were also constantly updated. The final thermodynamic model and parameters of Al–Ni binary system can be found in the thermodynamic simulation of the ternary Al–Cr–Ni system by Dupin et al. [19]. Figure 1 is the Al–Ni binary phase diagram drawn according to the thermodynamic parameters in the literature.
3. Binary Er–Ni System
The phase equilibrium relation of the binary Er–Ni system was first studied by Buschow [23] in 1968. In total, 11 intermetallic compounds were identified: ErNi3, Er2Ni7, ErNi4, Er4Ni17, Er5Ni22, ErNi5, Er2Ni17, Er3Ni, Er5Ni3, ErNi, and ErNi2. In 1974, Moreau et al. [24] studied the Er3Ni2 compound and found that Er5Ni3 should be replaced by Er3Ni2. Subsequently, in 1999, Du et al. [25] used the CALPHAD method to assess thermodynamic parameters and established a comprehensive thermodynamic database of this binary system. The phase diagram of the Er–Ni binary system calculated by Du et al. is shown in Figure 2 [25].
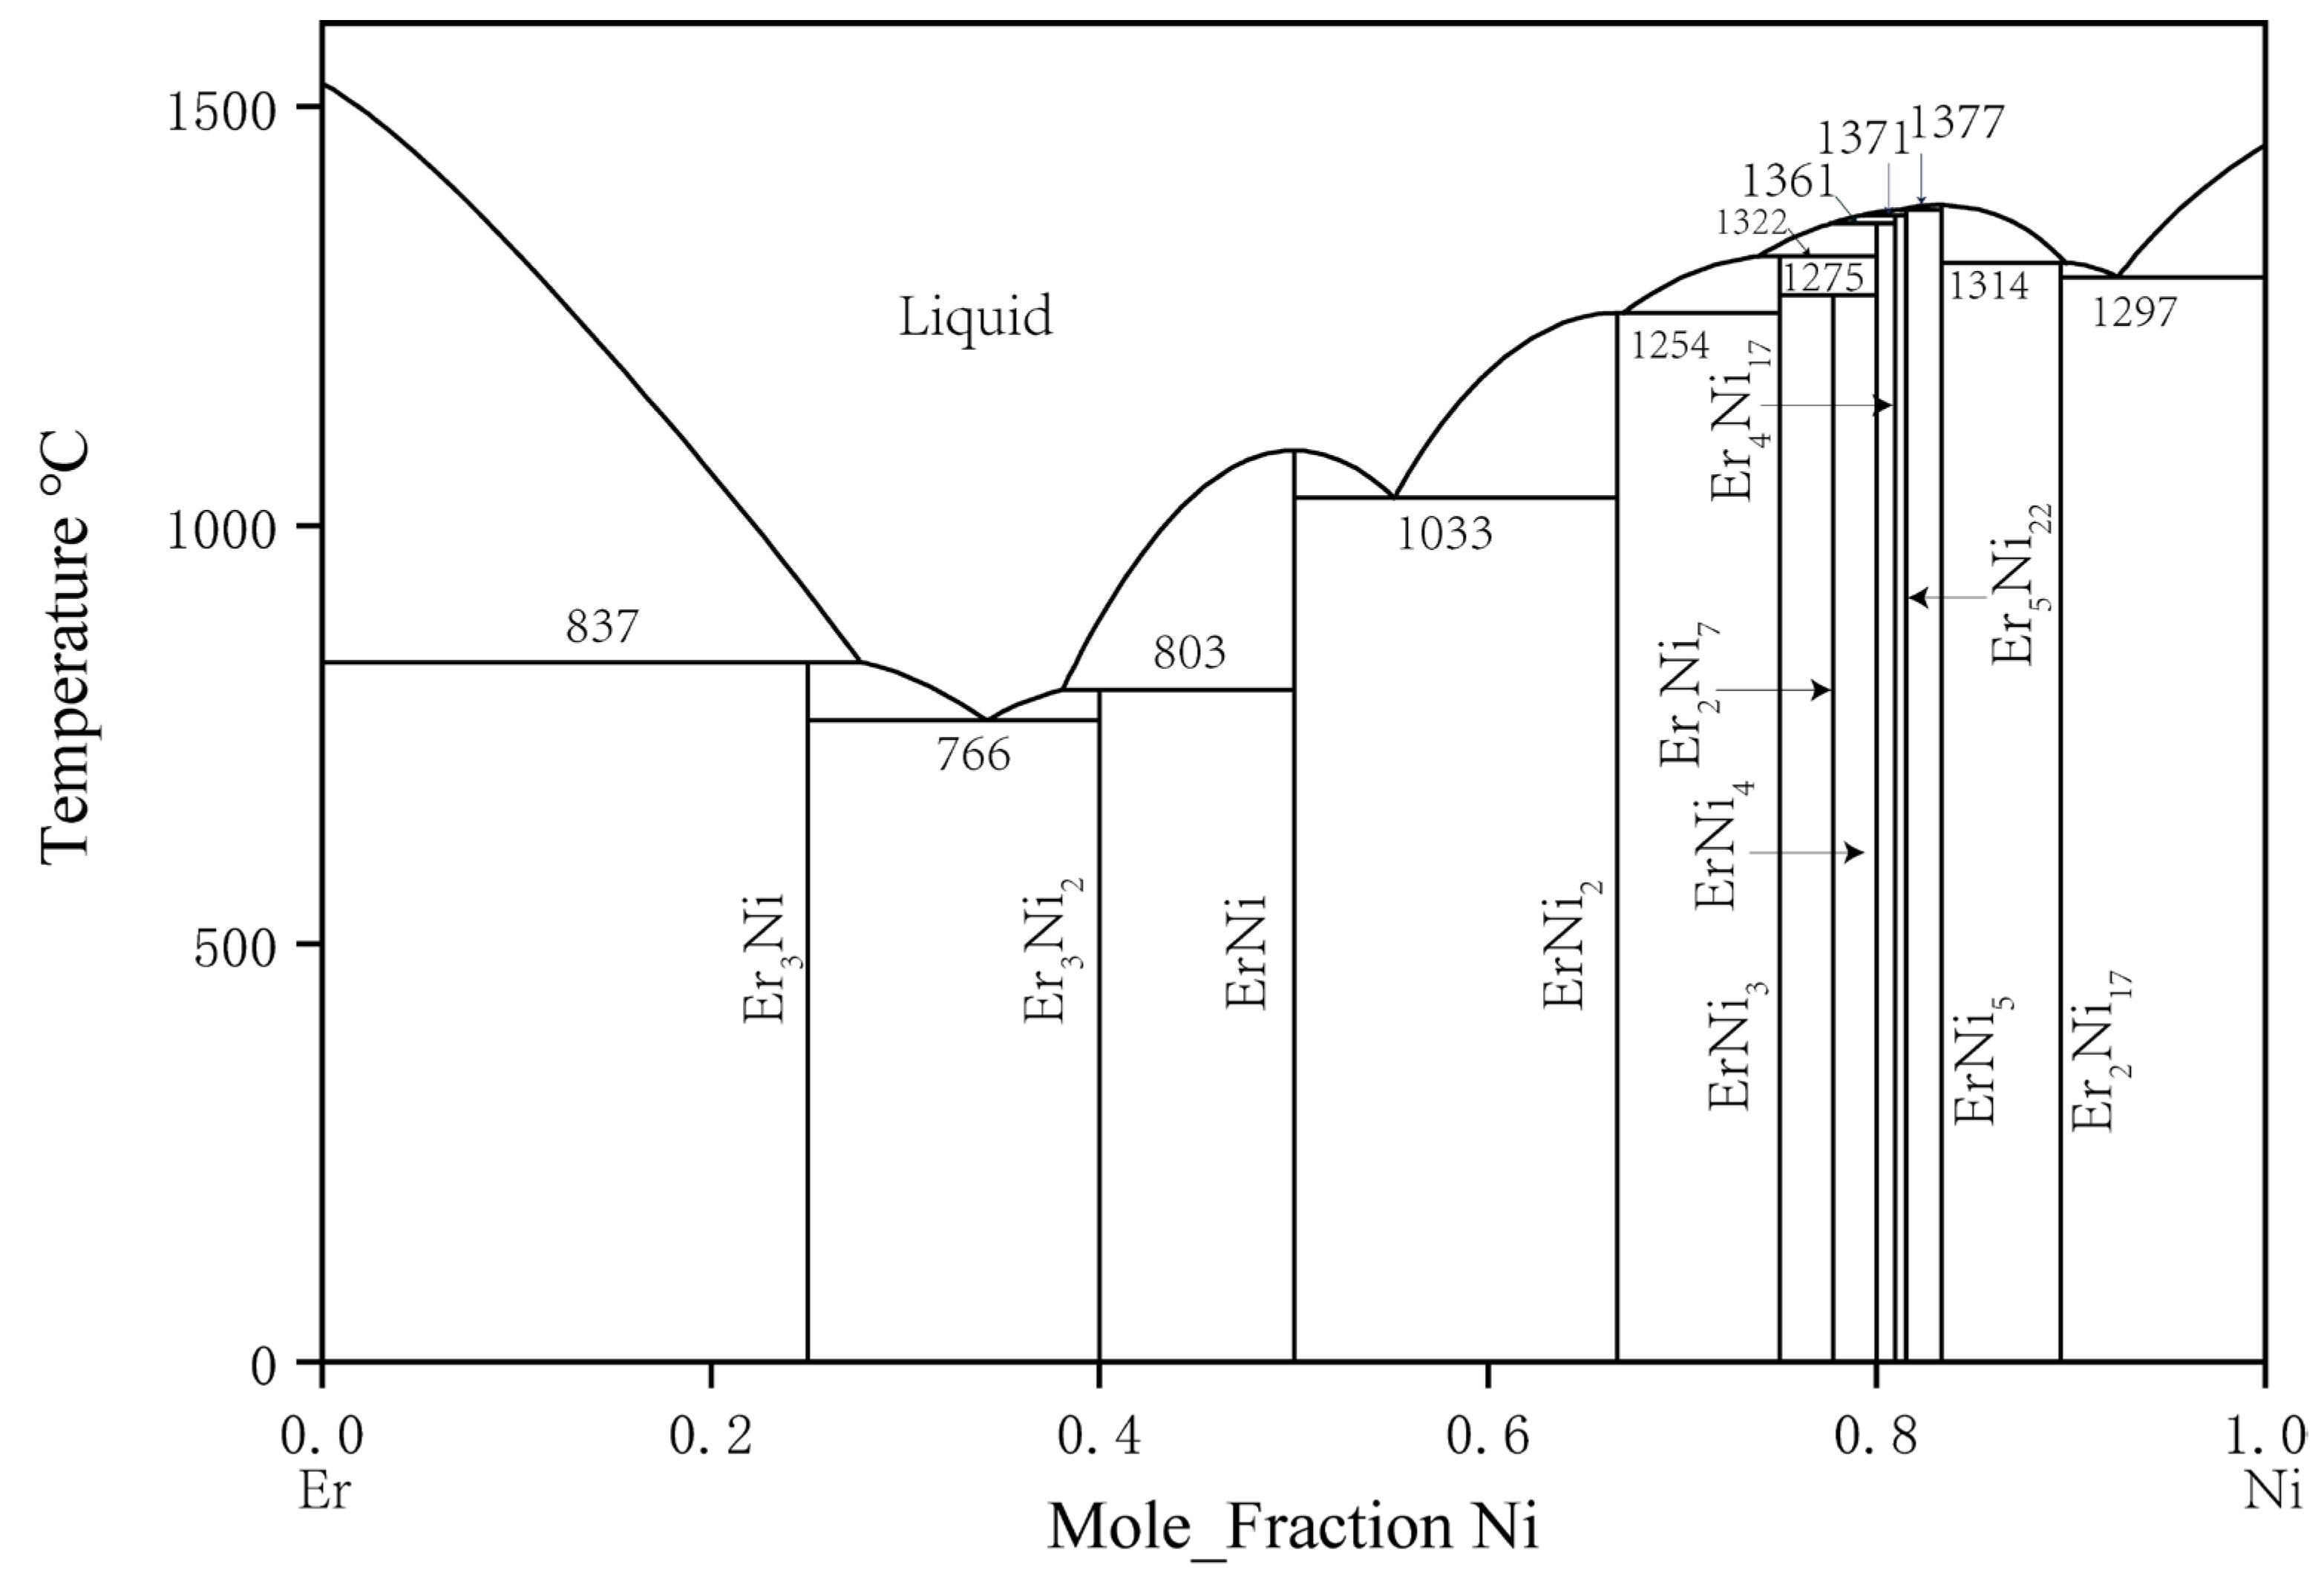
Figure 2. Er–Ni phase diagram assessed by Du et al. [25].
4. Binary Al–Er System
In 1965, The binary Al–Er system was first studied by Buschow and Vucht [26]. They discovered AlEr2, Al2Er3, AlEr, Al2Er, and Al3Er. Their study indicated that the solid solubility of Al in Er was close to 8 at. % at 860 °C, which seemed unusually high. In 1988, Gschneidner and Calderwood [27] restudied this system. Considering the 23% size difference between Er and Al, the actual solid solubility had to be less than 1 at. %. The previous observation might have been due to an impurity effect or nonequilibrium conditions. However, in their results, the curvature change in the liquidus curve did not conform to convention in the 50 to 80 at. % Er composition range. In 2002, Cacciamani et al. [28] conducted thermodynamic modeling and optimization for the Al–Er system, and their Al–Er phase diagram is shown in Figure 3. In 2022, L Xu et al., thermodynamically assessed this system [29].
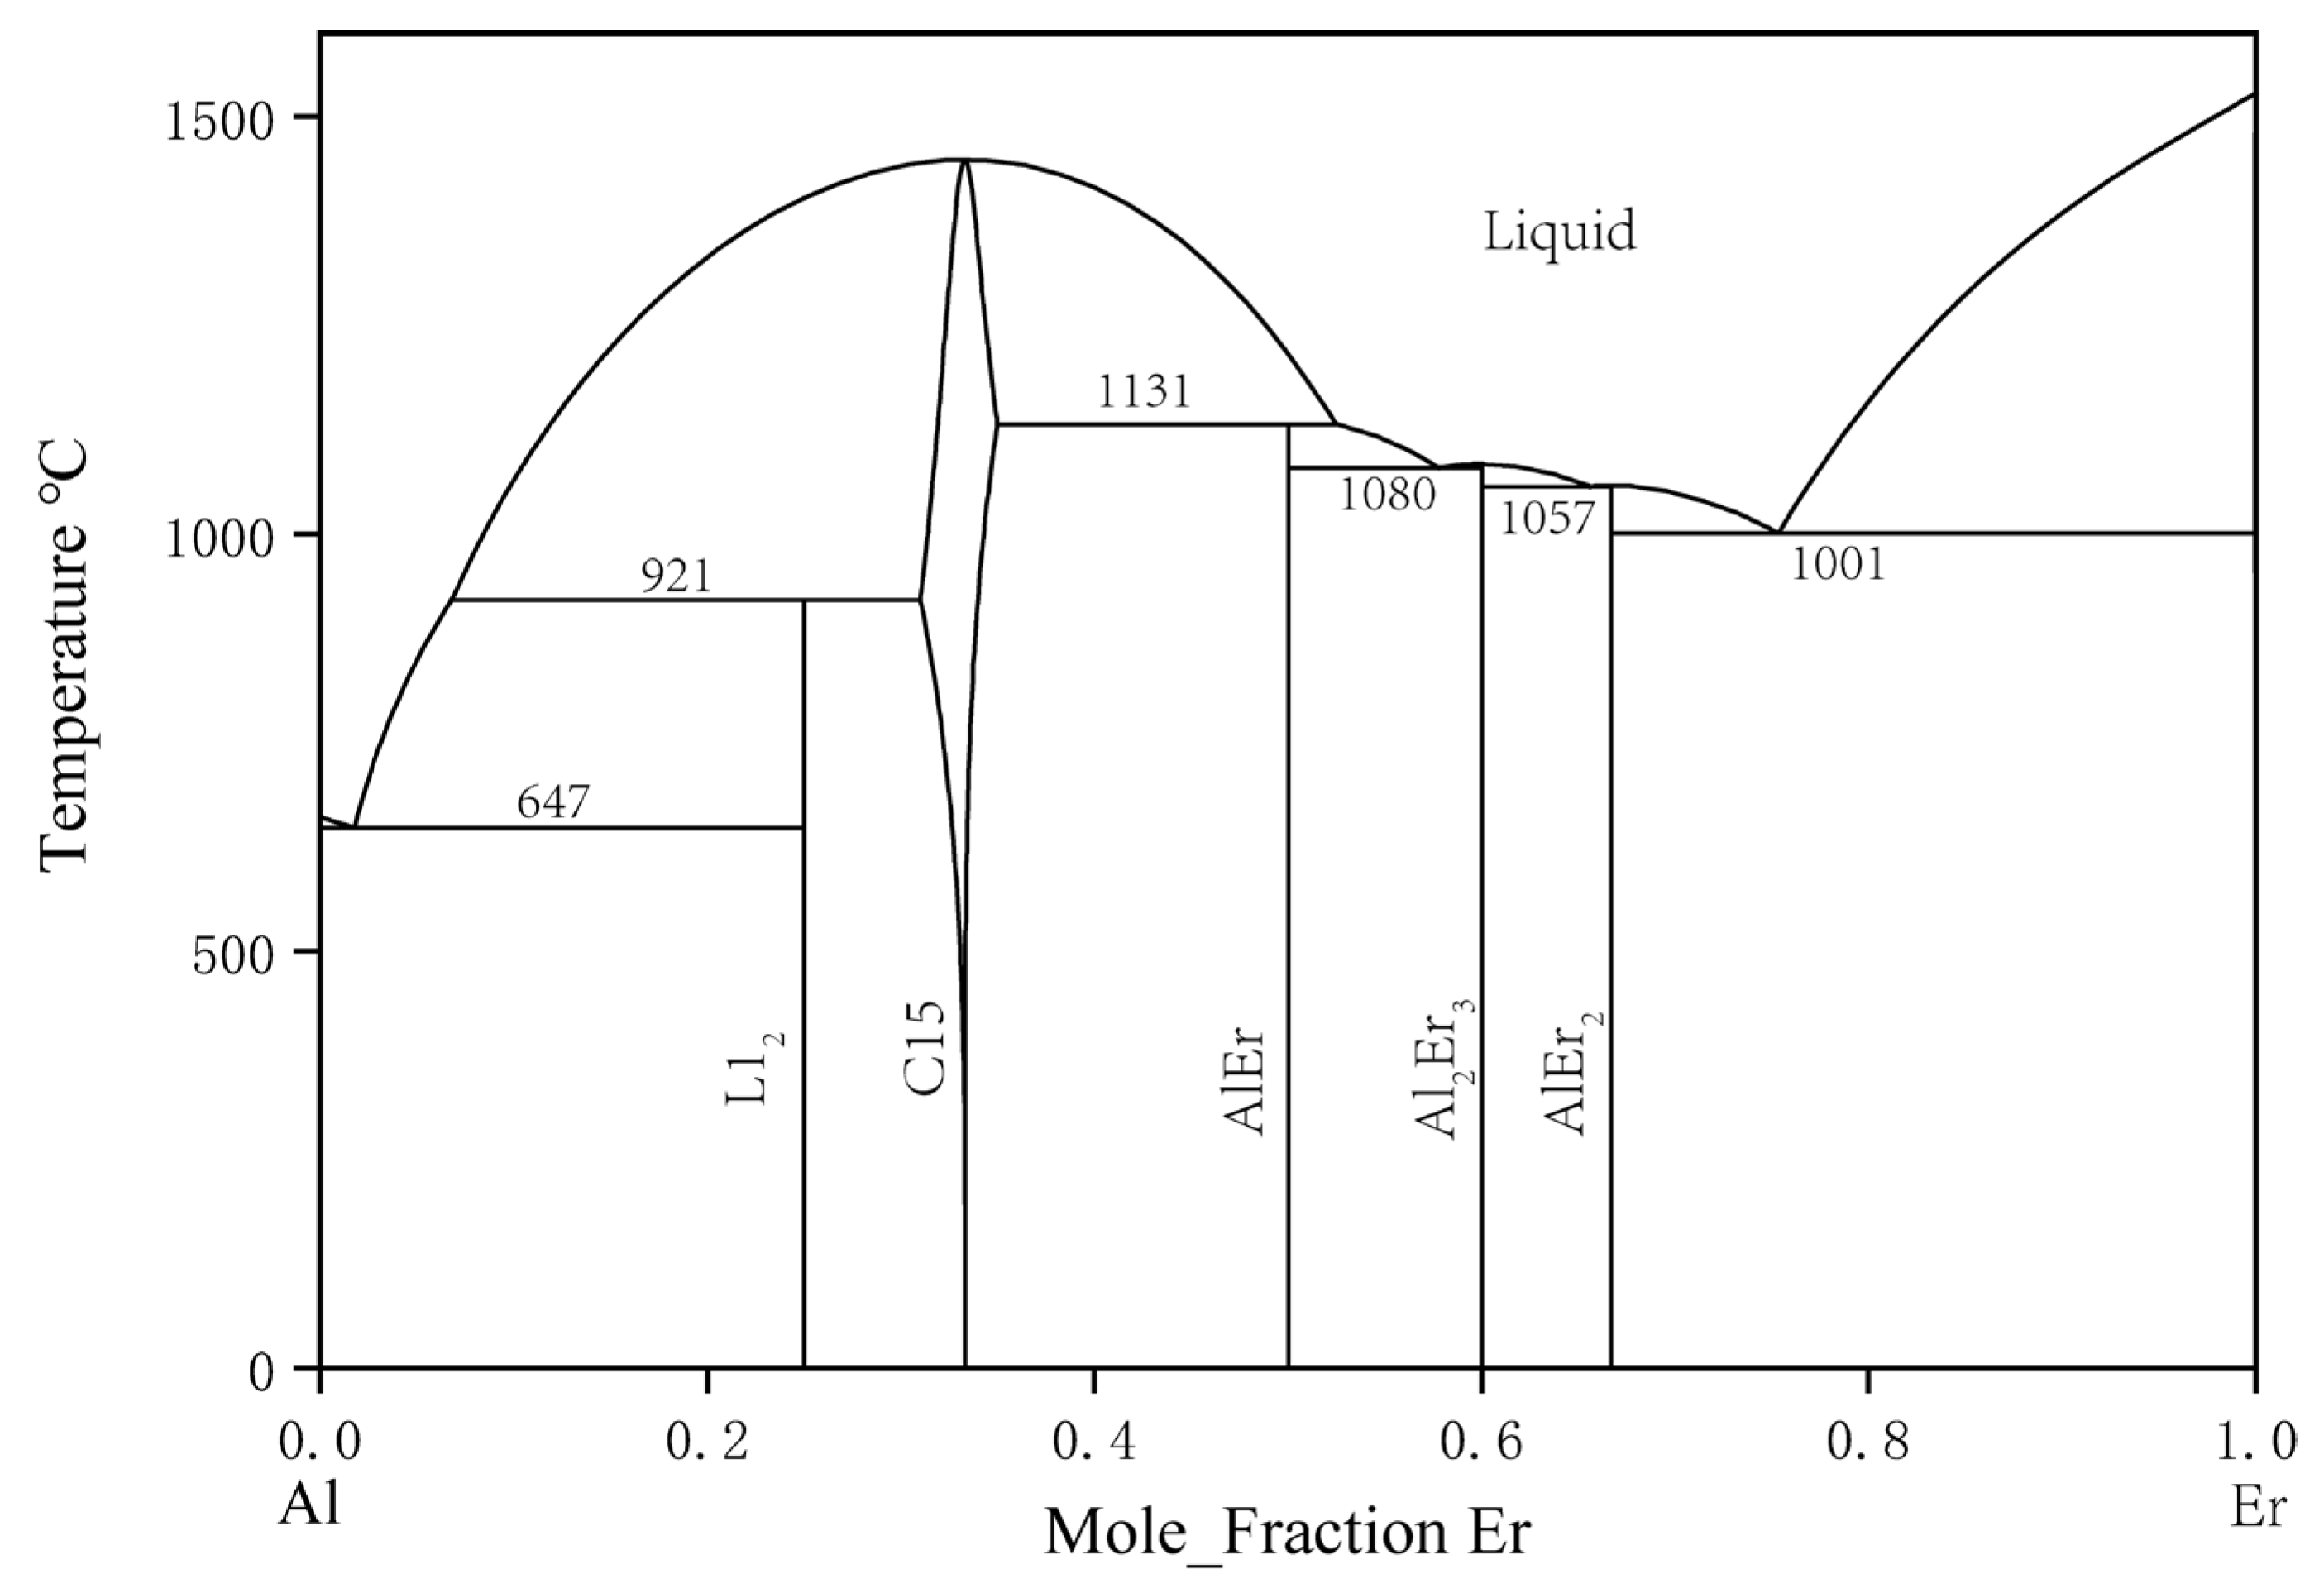
Figure 3. Calculated Al–Er phase diagram by Cacciamani et al. [28].
5. Ternary Al–Ni–Er System
There is relatively little information about the ternary Al–Ni–Er system. In 1982, Zarechnyuk et al. [30] first reported that the Er content in this system was 0–33 at. %. At the isothermal cross section at 800 °C, nine intermediate compounds were determined: τ4–Al4NiEr, τ5–Al3–xNi2+xEr, τ6–Al2NiEr, τ7–AlNi8Er3, τ8–Al2Ni6Er3, τ9–AlNi2Er2, τ10–AlNiEr, Al7Ni3Er2, and Al16Ni3Er. Combined with the later findings regarding the τ2–Al9Ni3Er phase, the Al2Ni3Er phase was reported by Gladyshevskii [31], and Sorgic et al. [32]. Riccardo et al. [33] drew a relatively complete isothermal section phase diagram of the ternary Al–Ni–Er system at 800 °C, as shown in Figure 4.
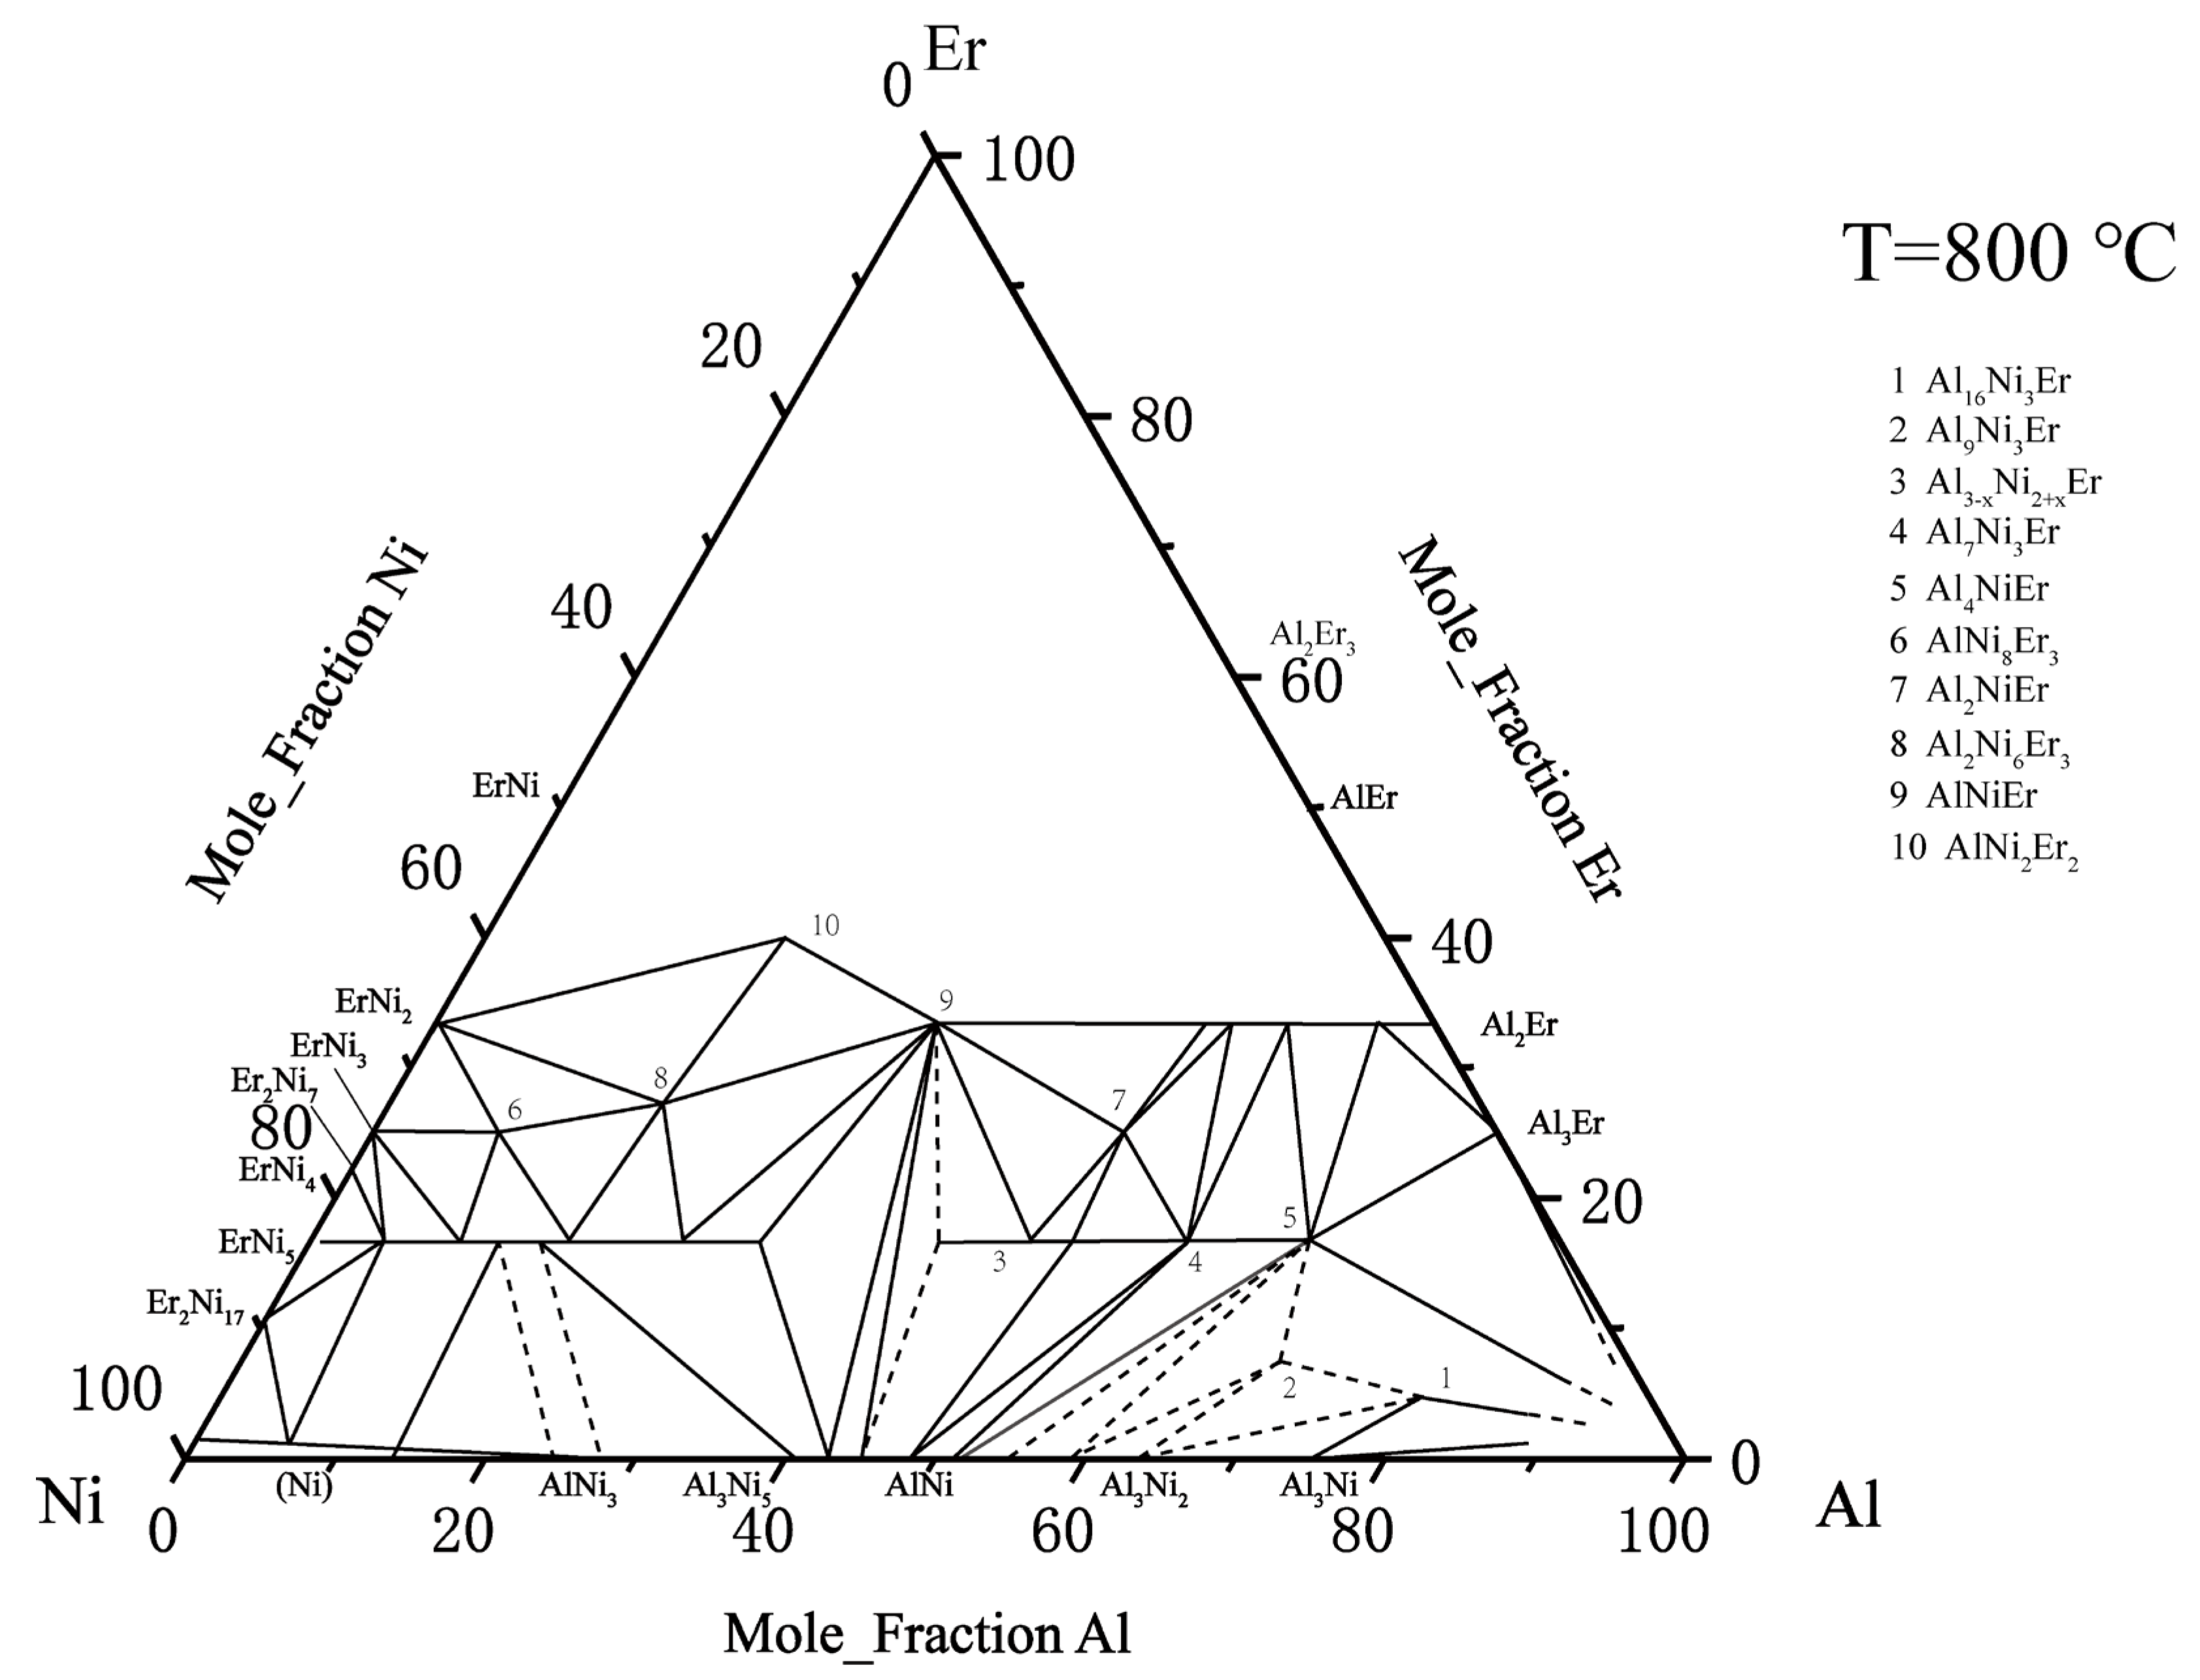
Figure 4. Al–Ni–Er phase diagram assessed by Riccardo et al. [33].
On the basis of the above research, Zhao et al. [34] used the equilibrium alloy method to determine most of the phase diagram of the ternary Al–Ni–Er system at 600 °C with Er content from 0 to 67 at. %. Three new ternary mesophase, namely, AlNiEr4, AlNi6Er13 and AlNi2Er were named τ11, τ12, and τ13. Because the pure phase was not obtained in the experiment, the structures of these ternary compounds were not discussed. The above work also revised ErNi5 τ5. Al2Er, ErNi2, and τ10. The isothermal section of the ternary Al–Ni–Er system at 600 °C was drawn as shown in Figure 5.
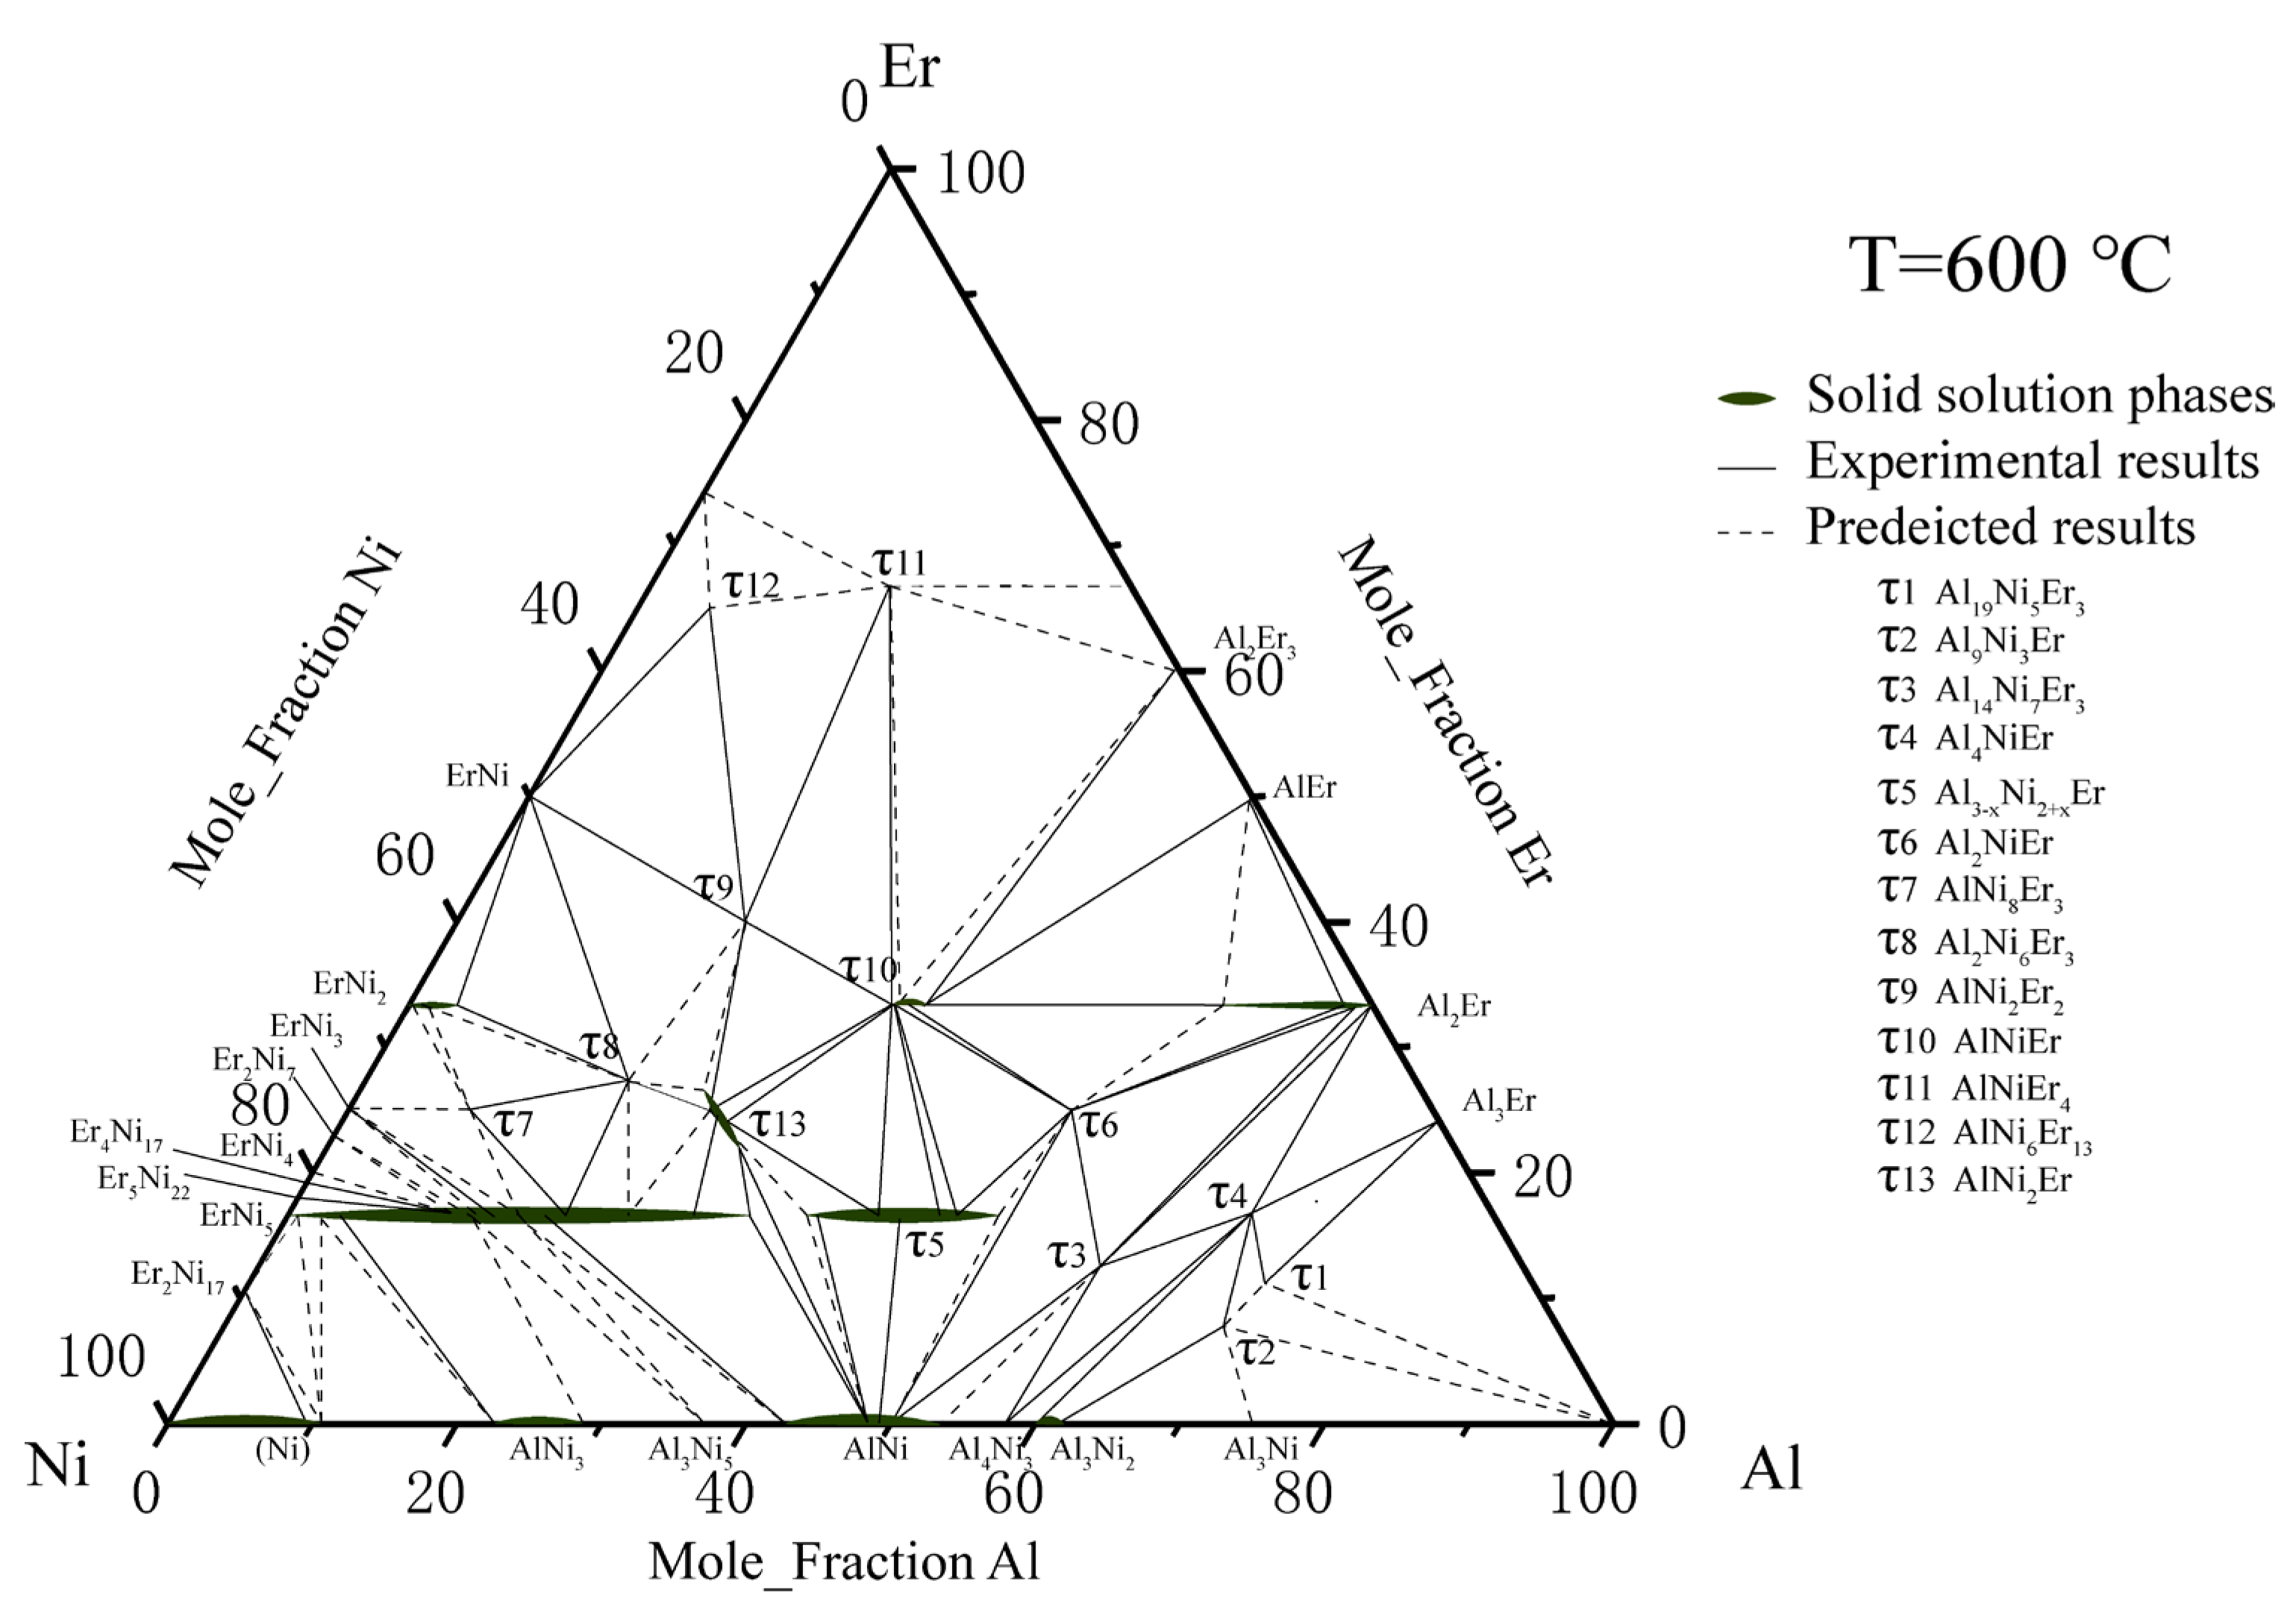
Figure 5. Al–Ni–Er phase diagram assessed by Zhao et al. [34].
Similarly, Zhao et al. measured the isothermal section of the Al–Ni–Er system at 700 °C and 6 phase zones at the Al-rich corner: Al2Er + Al3Er + τ4, Al + τ1 + τ2, Al + τ2 + Al3Ni, Al3Ni2 + τ2 + Al3Ni, Al + τ1 + Al3Er, and τ1 + Al3Er + τ4. At the Al-rich corner (60–100% Al) of the experimental phase diagram of the ternary Al–Ni–Er alloy, at the margin, there were four ternary intermetallic compounds, namely, τ1, τ2, τ3, τ4, and four binary compounds, Al3Ni2, Al3Ni, Al2Er and Al3Er.
According to the literature research, Al2Er should show a certain solid solubility to Ni in a parallel direction to Er. The ideal stoichiometric composition, solid-phase crystal structure, and lattice parameters of the above compounds could be obtained by investigating the existing literature data, as shown in Table 1.
Table 1. Crystallographic data of all phases in the Al–Ni–Er system.
| System | Phase | Prototype | Pearson Symbol | Lattice Parameters (nm) | Refs. | ||
|---|---|---|---|---|---|---|---|
| a | b | c | |||||
| Al | Fcc_A1, (Al) | Cu | cF4 | 0.40496 | [35] | ||
| Ni | Fcc_A1, (Ni) | Cu | cF4 | 0.3524 | [35] | ||
| Er | Hcp_A3, (Er) | Mg | hP2 | 0.359 | 0.555 | [35] | |
| Al–Ni | Al3Ni | Al3Ni | oP16 | 0.6613 | 0.7367 | 0.4811 | [36] |
| Al3Ni2 | Al3Ni2 | hP5 | 0.4028 | 0.4811 | [37] | ||
| AlNi | CsCl | cP2 | 0.28872 | [35] | |||
| Al3Ni5 | Pt5Ga3 | oC16 | 0.753 | 0.661 | 0.376 | [35] | |
| AlNi3 | Cu3Au | cP4 | 0.35792 | [35] | |||
| Al4Ni3 | Ga4Ni3 | cI112 | 1.144 | [22] | |||
| Ni–Er | Er2Ni17 | Th2Ni17 | hP38 | 0.8287 | 0.8017 | [22] | |
| Er5Ni22 | hP108 | 0.4862 | 7.177 | [22] | |||
| Er4Ni17 | hP126 | 0.4869 | 8.407 | [22] | |||
| ErNi4 | PuNi4 | mS30 | 0.4855 | 0.8444 | 1.0231 | [22] | |
| Er2Ni7 | Gd2Co7 | hR54 | 0.4909 | 3.6067 | [38] | ||
| ErNi3 | PuNi3 | hR36 | 0.4941 | 2.4252 | [30] | ||
| ErNi2 | MgCu2 | cF24 | 0.71175 | [31] | |||
| Er3Ni2 | Er3Ni2 | hR45 | 0.8472 | 1.5680 | [39] | ||
| ErNi | FeB | oP8 | 0.6977 | 0.4110 | 0.5443 | [39] | |
| Er3Ni | Fe3C | oP16 | 0.6804 | 0.9432 | 0.6245 | [40] | |
| Al–Er | Al3Er | AuCu3 | cP4 | 0.4235 | [26] | ||
| Al2Er3 | Al2Zr3 | tP20 | 0.81323 | 0.75039 | [41] | ||
| AlEr2 | Co2Si | oP12 | 0.6516 | 0.5015 | 0.9279 | [42] | |
| AlEr | AlDy | oP16 | 0.55791 | 1.1277 | 0.5574 | [43] | |
| Al–Ni–Er | |||||||
| τ1 | Al19Ni5Er3 | Al119Ni5Gd3 | oS108 | 4.0565 | 15.8906 | 26.9752 | [24] |
| τ2 | Al9Ni3Er | Al9Ni3Er | hR78 | 7.2716 | 27.346 | [44] | |
| τ3 | Al14Ni7Er3 | Al14Ni7Gd3 | hP72 | 17.8776 | 4.03212 | [25] | |
| τ4 | Al4NiEr | YNiAl4 | oS24 | 4.044 | 15.08 | 6.631 | [22] |
| τ5 | Al3–xNi2+xEr | Al3Ni2Y | hP18 | 9.01 | 4.049 | [22] | |
| τ6 | Al2NiEr | MgCuAl2 | oS16 | 4.064 | 10.06 | 6.898 | [22] |
| τ7 | AlNi8Er3 | Ce3Co8Si | hP24 | 5.002 | 15.99 | [22] | |
| τ8 | Al2Ni6Er3 | Ce3Ni6Si2 | cI44 | 8.88 | [22] | ||
| τ9 | AlNi2Er2 | W2CoB2 | oI10 | 5.347 | 8.374 | 4.157 | [37] |
| τ10 | AlNiEr | AlNiZr | hP9 | 6.970 | 3.8003 | [45] | |
| τ11 | AlNiEr4 | [34] | |||||
| τ12 | AlNi6Er13 | [34] | |||||
| τ13 | AlNi2Er | [34] | |||||
| τ14 | Al12Ni2Er3 | This work | |||||
References
- Zhang, X.; Deng, Y.; Zhang, Y. Development of high strength aluminum alloys and processing techniques for the materials. Acta Metall. Sin. 2015, 51, 257–271.
- Kong, Y.; Jia, Z.; Liu, Z.; Liu, M.; Roven, H.J.; Liu, Q. Effect of Zr and Er on the microstructure, mechanical and electrical properties of Al-0.4Fe alloy. J. Alloys Compd. 2020, 857, 157611.
- Barkov, R.Y.; Mikhaylovskaya, A.; Yakovtseva, O.; Loginova, I.; Prosviryakov, A.; Pozdniakov, A. Effects of thermomechanical treatment on the microstructure, precipitation strengthening, internal friction, and thermal stability of Al–Er-Yb-Sc alloys with good electrical conductivity. J. Alloys Compd. 2020, 855, 157367.
- Shang, Q.X.; Liu, Y.R.; Su, K.P.; Hu, S.L.; Wang, H.O.; Huang, S.; Yang, D.X.; Huo, D.X.; Liu, J. The Isothermal Section of the Al–Mn–In Ternary System at 773K and Hard Magnetic Properties of MnAlIn Alloys. J. Phase Equilibria Diffus. 2021, 42, 888–897.
- Shen, Y.; Perepezko, J. Al-based amorphous alloys: Glass-forming ability, crystallization behavior and effects of minor alloying additions. J. Alloys Compd. 2017, 707, 3–11.
- Yang, H.; Wang, J.; Li, Y. Influence of TM and RE elements on glass formation of the ternary Al–TM–RE systems. J. Non-Cryst. Solids 2008, 354, 3473–3479.
- Abrosimova, G.; Aronin, A.; Budchenko, A. Amorphous phase decomposition in Al–Ni–RE system alloys. Mater. Lett. 2015, 139, 194–196.
- Chang, Y.; Chen, S.; Zhang, F.; Yan, X.; Xie, F.; Schmid-Fetzer, R.; Oates, W. Phase diagram calculation: Past, present and future. Prog. Mater. Sci. 2004, 49, 313–345.
- Deffrennes, G.; Joubert, J.-M.; Oudot, B. On models to describe the volume in the context of establishing high-pressure Gibbs energy databases. Calphad 2022, 78, 102435.
- Pelton, A.D. Thermodynamics and phase diagrams of materials. In Phase Transformations in Materials; Wiley Online Library: New York, NY, USA, 2001; pp. 1–80.
- Li, C.; Song, Q.; Yang, X.; Wei, Y.; Hu, Q.; Liu, L.; Zhang, L. Experimental Investigation of the Phase Relations in the Fe-Zr-Y Ternary System. Materials 2022, 15, 593.
- Okamoto, H. Al-Ni (aluminum-nickel). J. Phase Equilibria Diffus. 2004, 25, 394.
- Lee, K.J.; Nash, P. The Al-Ni-Ti system (Aluminum-Nickel-Titanium). J. Phase Equilibria Diffus. 1991, 12, 551–562.
- Wang, Y.; Cacciamani, G. Thermodynamic modeling of the Al-Cr-Ni system over the entire composition and temperature range. J. Alloys Compd. 2016, 688, 422–435.
- Gwyer, A.G.C. über die Legierungen des Aluminiums mit Kupfer, Eisen, Nickel, Kobalt, Blei und Cadmium. Z. Anorg. Chem. 1908, 57, 113–153.
- Ansara, I.; Dupin, N.; Lukas, H.L.; Sundman, B. Thermodynamic assessment of the Al-Ni system. J. Alloys Compd. 1997, 247, 20–30.
- Du, Y.; Clavaguera, N. Thermodynamic assessment of the AlNi system. J. Alloys Compd. 1996, 237, 20–32.
- Huang, W.; Chang, Y. A thermodynamic analysis of the Ni-Al system. Intermetallics 1998, 6, 487–498.
- Dupin, N.; Ansara, I.; Sundman, B. Thermodynamic re-assessment of the ternary system Al-Cr-Ni. Calphad 2001, 25, 279–298.
- Lu, X.-G.; Sundman, B.; Ågren, J. Thermodynamic assessments of the Ni–Pt and Al–Ni–Pt systems. Calphad 2009, 33, 450–456.
- Chen, H.-L.; Doernberg, E.; Svoboda, P.; Schmid-Fetzer, R. Thermodynamics of the Al3Ni phase and revision of the Al–Ni system. Thermochim. Acta 2011, 512, 189–195.
- Ellner, M.; Kek, S.; Predel, B. ChemInform Abstract: Ni3Al4-A Phase with Ordered Vacancies Isotypic to Ni3Ga4. Less-Common Met. 1989, 154, 207–215.
- Buschow, K. Crystal structures, magnetic properties and phase relations of erbium-nickel intermetallic compounds. J. Less Common Met. 1968, 16, 45–53.
- Moreau, J.M.; Paccard, D.; Gignoux, D. The crystal structure of Er3Ni2. Acta Crystallogr. Sect. B Struct. Crystallogr. Cryst. Chem. 1974, 257, 195–209.
- Du, Z.; Wang, D.; Zhang, W. Thermodynamic assessment of the Co–Pr, Er–Ni and Ni–Pr systems. J. Alloys Compd. 1999, 284, 206–212.
- Buschow, K.H.J.; van Vucht, J.H.N. Das System Erbium-Aluminium und ein Vergleich mit dem System Yttrıum-Aluminium. Int. J. Mater. Res. 1965, 56, 9–13.
- Gschneidner, K.A.; Calderwood, F.W. The Al−Er (Aluminum-Erbium) system. Bull. Alloy Phase Diagr. 1988, 9, 676–678.
- Cacciamani, G.; Saccone, A.; De Negri, S.; Ferro, R. The Al-Er-Mg ternary system Part II: Thermodynamic modeling. J. Phase Equilibria 2002, 23, 38.
- Xu, L.; Shi, X.; Xia, D.; Huang, D.; Tang, H. Experimental investigation and thermodynamic assessment of the Al–Er system. Calphad 2022, 79, 102482.
- Zarechnyuk, O.; Rykhal, R.; Romaka, V.; Kovalska, O.; Shazabura, G. Isothermal sections of the Holmium, erbium-nickel-aluminium ternary systems at 800 °C in the 0 to 0.333 atomic fraction range of the rare-earth metal. Dop. Akad. Nauk Ukr. RSR Ser. A Fiz. Mat. Tekh. Nauki 1982, 14, 78–80.
- Gladyshevskii, R.; Cenzual, K.; Parthé, E. The crystal structure of orthorhombic Gd3Ni5Al19, a new representative of the structure series R2+mT4+mAl15+4m. J. Solid State Chem. 1992, 100, 9–15.
- Šorgić, B.; Drašner, A.; Blaẑina, Ẑ. The effect of aluminium on the structural and hydrogen sorption properties of ErNi5. J. Alloys Compd. 1996, 232, 79–83.
- Riccardo, F.; Gilda, Z.; Rinaldo, M. Al-Er-Ni (aluminium–erbium–nickel). Landolt-Börnstein-Group IV Phys. Chem. 2005, 11A2, 249–256.
- Zhao, F.; Zhang, L.; Wang, H.; Liu, L. Phase equilibria investigation of the Al–Ni–Er ternary system at 600 °C and 700 °C. Calphad 2021, 75, 102353.
- Massalski, T.B.; Okamoto, H.; Subramanian, P.R. Binary Alloy Phase Diagrams, 2nd ed.; ASM International: Materials Park, OH, USA, 1990.
- Viklund, P.; Haussermann, U.; Lidin, S. NiAl3: A structure type of its own? In Acta Crystallographica A-Foundation and Advances; Int Union Crystallography: Chester, UK, 1996; Volume 52, p. C321.
- Bouche, K.; Barbier, F.; Coulet, A. Phase formation during dissolution of nickel in liquid aluminium. Zeitschrift Fuer Met. 1997, 88, 446–451.
- Dwight, A.; Mueller, M.; Conner, R.; Downey, J.; Knott, H. Ternary compounds with the Fe2P-type structure. Trans. Am. Inst. Min. Metall. Pet. Eng. 1968, 242, 2075–2080.
- Hilpert, K.; Kobertz, D.; Venugopal, V.; Miller, M.; Gerads, H.; Bremer, F.J.; Nickel, H. Phase Diagram Studies on the Al-Ni System. Ztschrift Für Nat. A 1987, 42, 1327–1332.
- Delsante, S.; Richter, K.W.; Ipser, H.; Borzone, G. Synthesis and structural characterization of ternary compounds belonging to the series RE2+mNi4+mAl15+4m (RE = rare earth metal). Z. Für Anorg. Und Allg. Chem. 2009, 635, 365–368.
- Buschow, K.; Van Der Goot, A. The crystal structure of rare-earth nickel compounds of the type R2Ni7. J. Less Common Met. 1970, 22, 419–428.
- Dwight, A.E. The unit-cell constants of some PuNi3-type compounds. Acta Crystallogr. Sect. B Struct. Crystallogr. Cryst. Chem. 2010, 24, 1395–1396.
- Wang, D.; Li, Y.; Long, Y.; Ye, R.; Chang, Y.; Wan, F. Hydrogen induced structural and magnetic transformations in magnetic regenerator materials ErNin (n = 1, 2) and HoCu2. J. Magn. Magn. Mater. 2007, 311, 697–701.
- Okamoto, H.; Massalski, T.B. guidelines for binary phase diagram assessment. J. Phase Equilibria Diffus. 1993, 14, 316–335.
- Garde, C.S.; Ray, J. Magnetic and superconducting behaviour of the (R = La, Pr, Gd, Tb, Ho and Er) systems. J. Phys. Condens. Matter 1997, 9, 7419–7434.
More
Information
Contributors
MDPI registered users' name will be linked to their SciProfiles pages. To register with us, please refer to https://encyclopedia.pub/register
:
View Times:
1.0K
Revisions:
2 times
(View History)
Update Date:
03 Nov 2023
Table of Contents


Notice
You are not a member of the advisory board for this topic. If you want to update advisory board member profile, please contact office@encyclopedia.pub.
OK
Confirm
Only members of the Encyclopedia advisory board for this topic are allowed to note entries. Would you like to become an advisory board member of the Encyclopedia?
Yes
No
${ textCharacter }/${ maxCharacter }
Submit
Cancel
Back
Comments
${ item }
|
${ item.createdUser.fullName }
${ item.createdAt }
${ item.vote }
${ item.reply }
Delete
${ reply.createdUser.fullName }
${ reply.createdAt }
${ reply.vote }
Delete
There is no reply to this comment~
${ item.replyTextCharacter }/${ item.replyMaxCharacter }
Submit
Cancel
More
No more~
There is no comment~
${ textCharacter }/${ maxCharacter }
Submit
Cancel
${ selectedItem.replyTextCharacter }/${ selectedItem.replyMaxCharacter }
Submit
Cancel
Confirm
Are you sure to Delete?
Yes
No